It’s A Race To The Finish
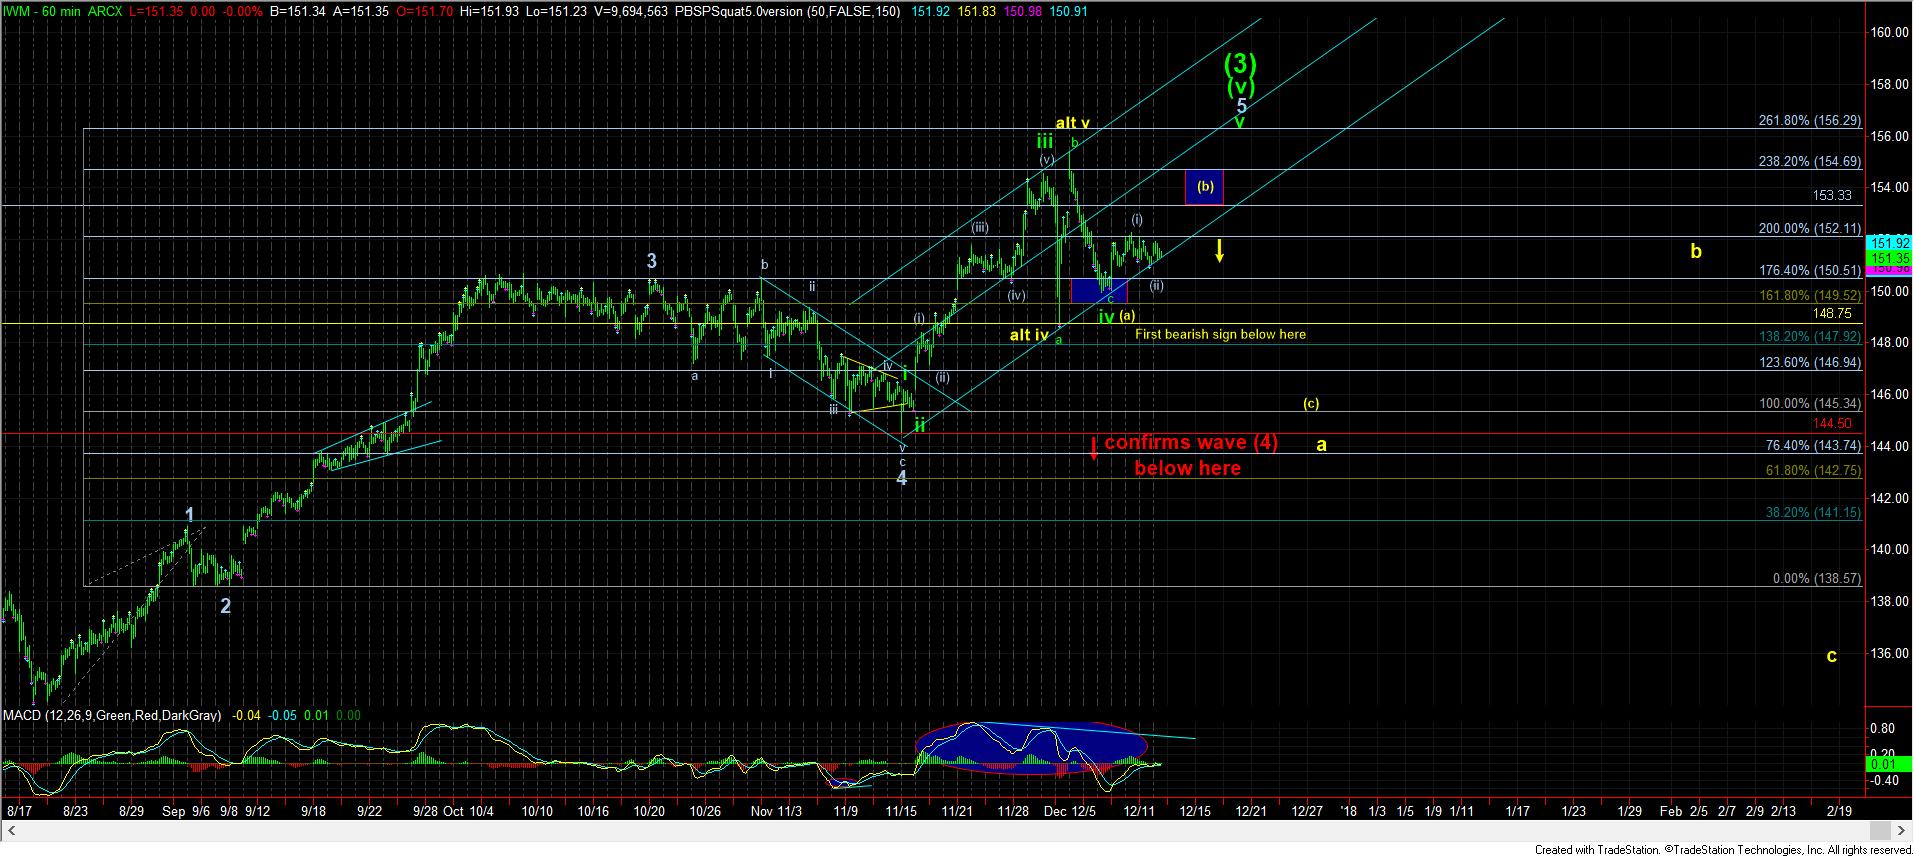
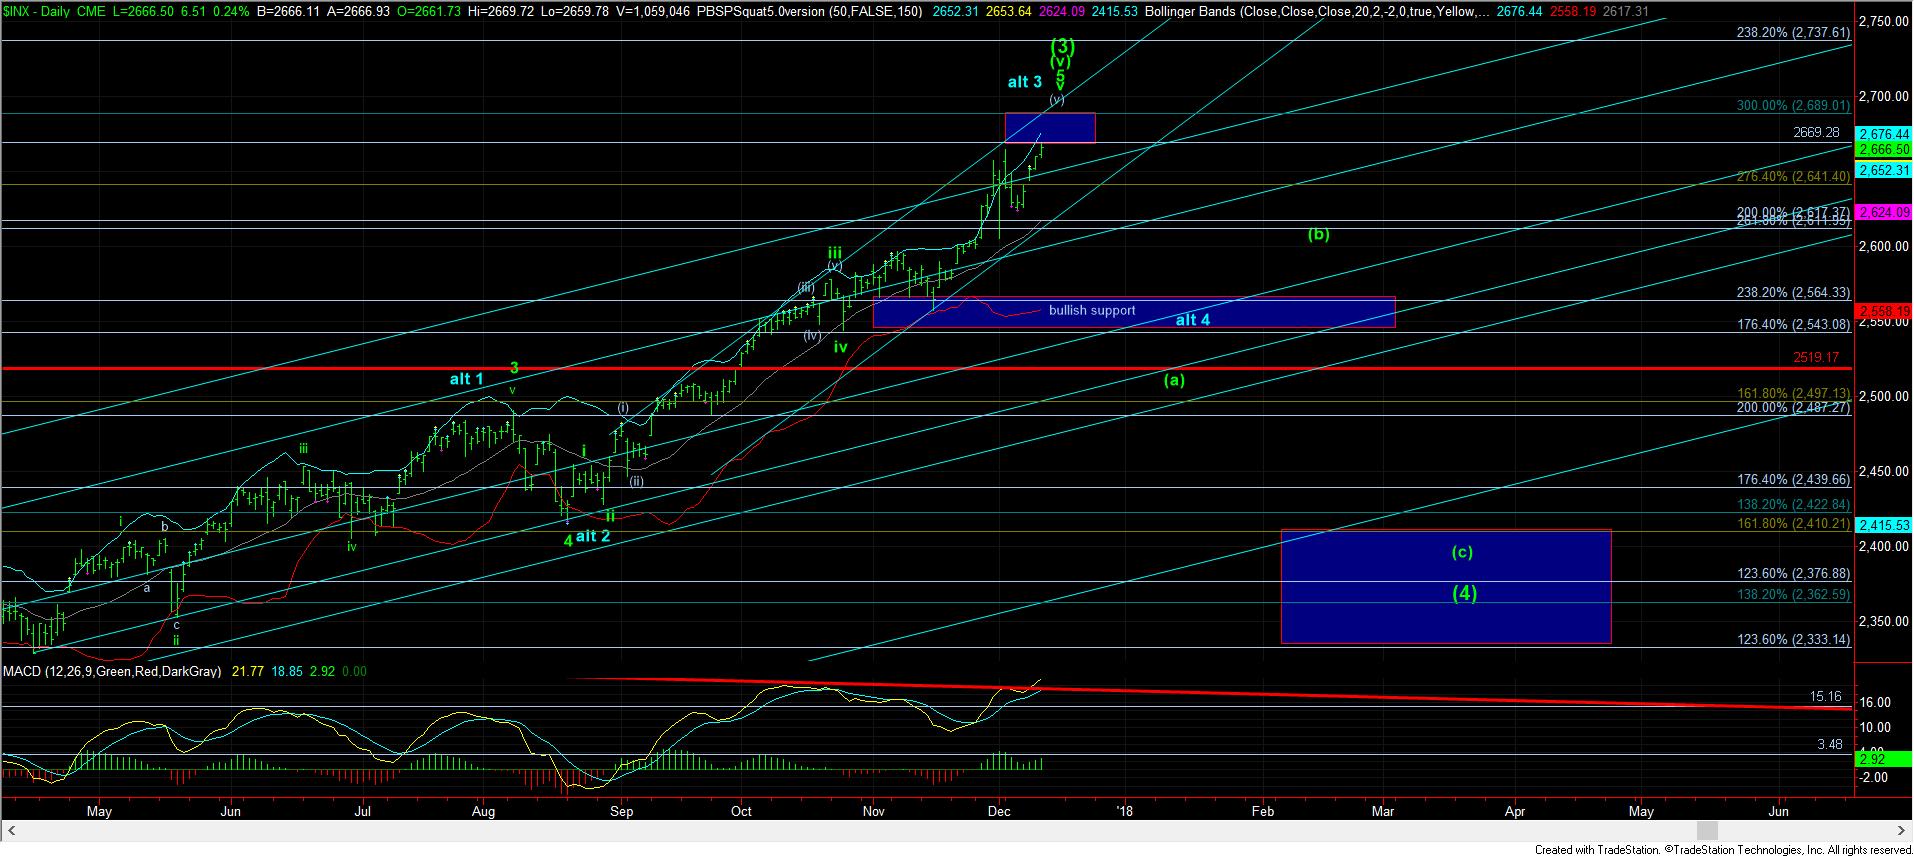
With the IWM seriously lagging at this time, whereas the SPX and NQ are around their all-time highs, it makes me strongly consider whether the IWM has indeed topped at its last highs. For this reason, I have added the (b) wave count in yellow.
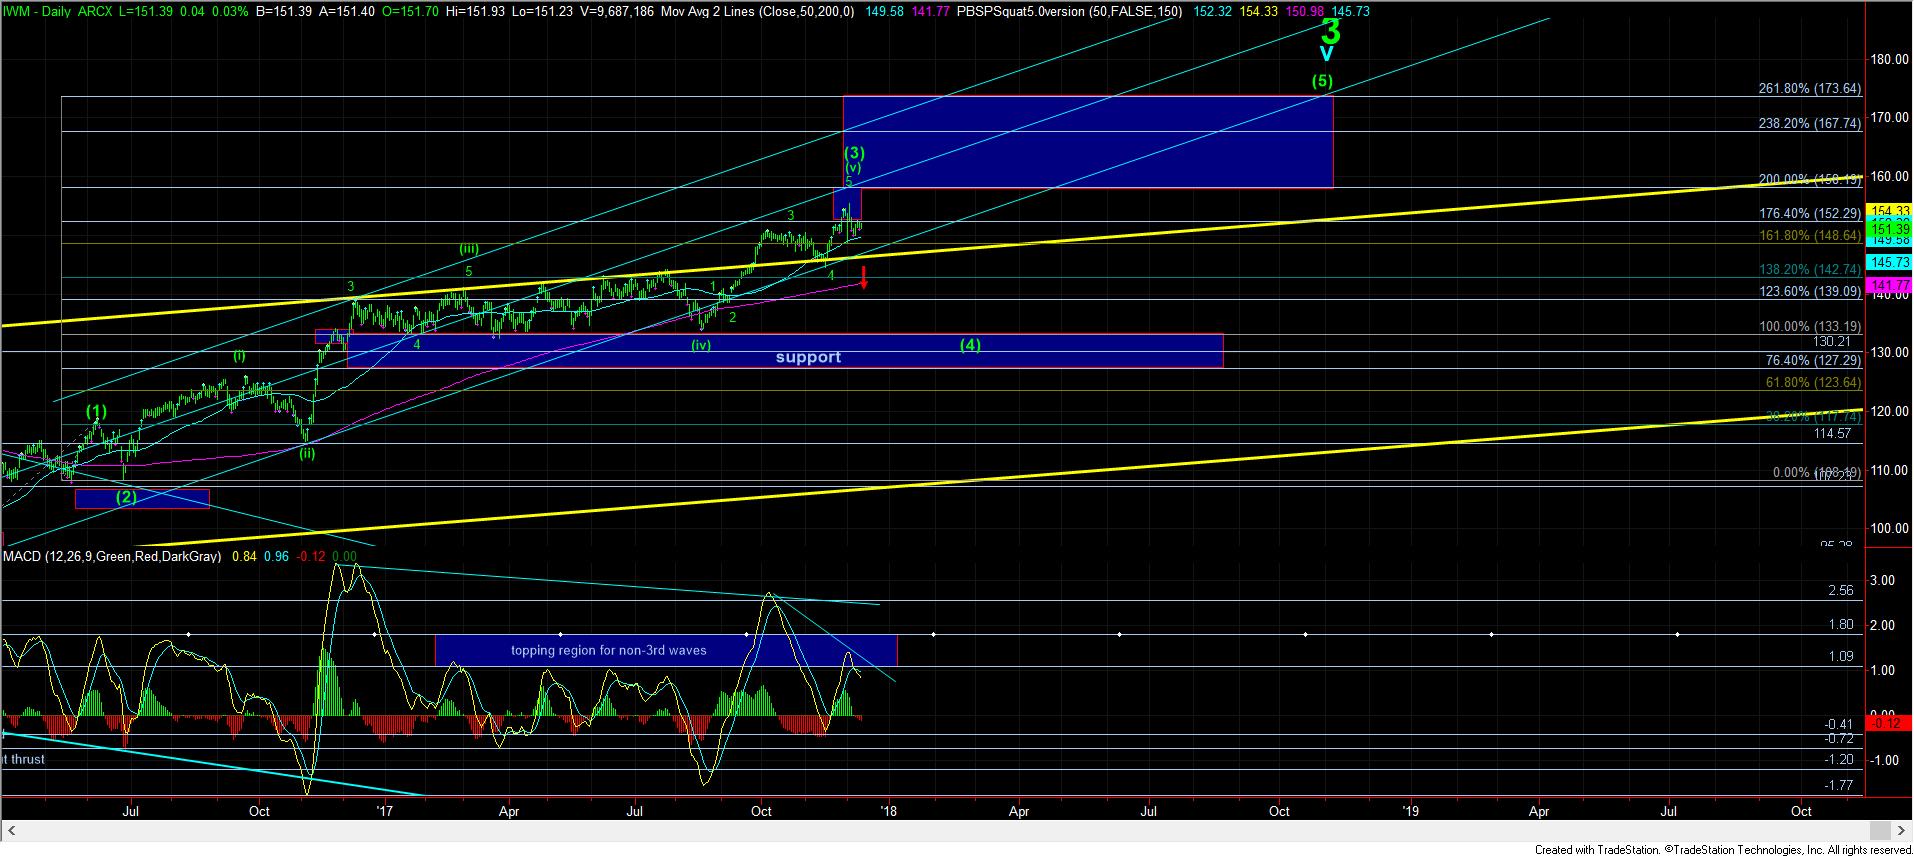
To put this (b) wave potential into perspective, I would still want to see one more rally take hold in the IWM, which may coincide with the final move higher in the NQ. Once we strike the 153+ region, then we can move support up to the 152 region. If we see a sustained break of 152 after we strike 153+ in the IWM, that will be our first indication that the highs are in place, and that we have even struck the top of a (b) wave rally. This would point us back down towards the lows seen in November to complete the a-wave of the larger degree wave (4), pointing us back towards the 133 region. This is now shown as the yellow count potential on the 60-minute IWM chart.
However, I will have to note that I may even question the potential for the IWM to rally back to 153 if we see a sustained break below 150.50.
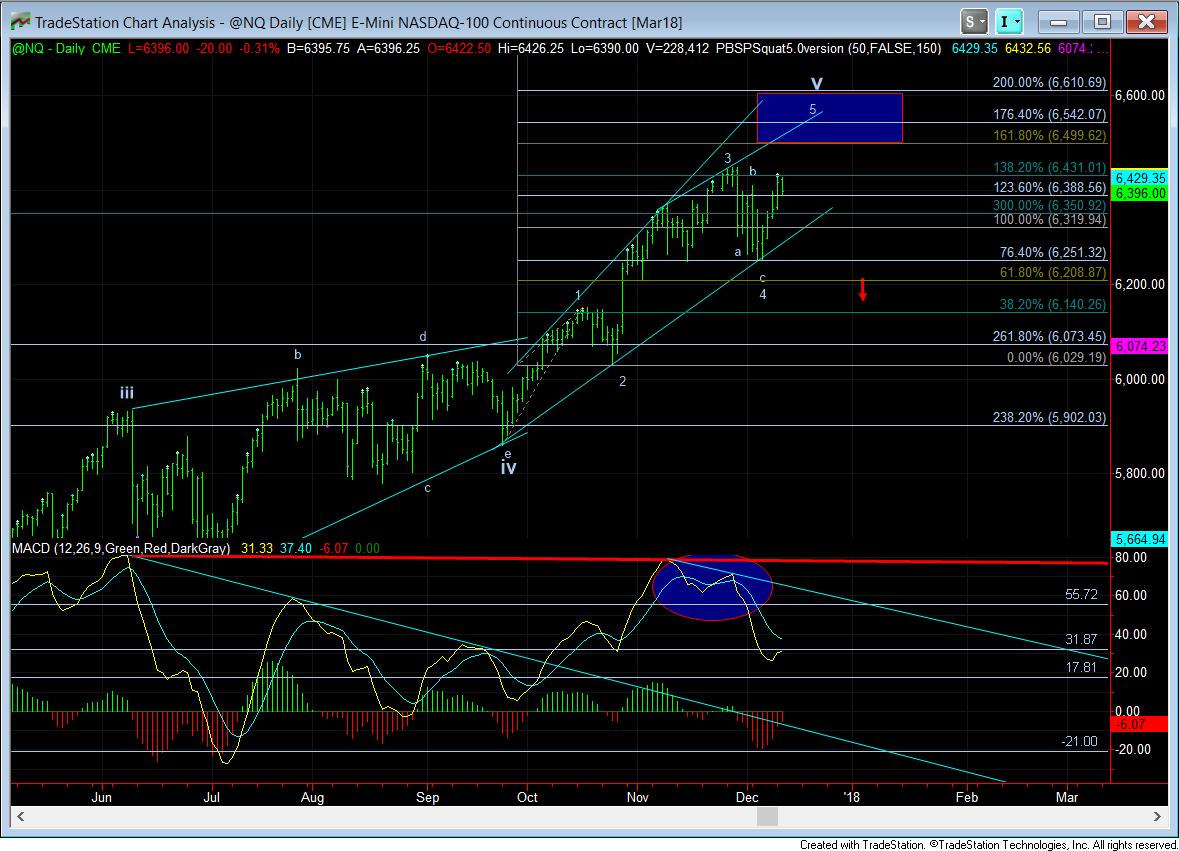
This still means that I am expecting the NQ to strike the target box overhead. And, when we finally do move into that box, I will turn extremely cautious that a major reversal can be seen at any time. But, for now, I still think the market is pointing us just a bit higher before this segment can top out. Yet, I will be watching the IWM VERY closely, as it has been a truly wonderful guide for the last month as to where we stand in this market.