Is This The Start Of [2]?
Maybe.
I am sorry to be unable to provide a definitive answer to the title question, but this market has been terribly stingy when it comes to pullbacks. And, as I write this update, we are again testing maximum resistance for a corrective bounce.
While the market has indeed broken the support we have been tracking to suggest that the diagonal is likely complete, the question we have to deal with now is what degree of pullback does this represent?
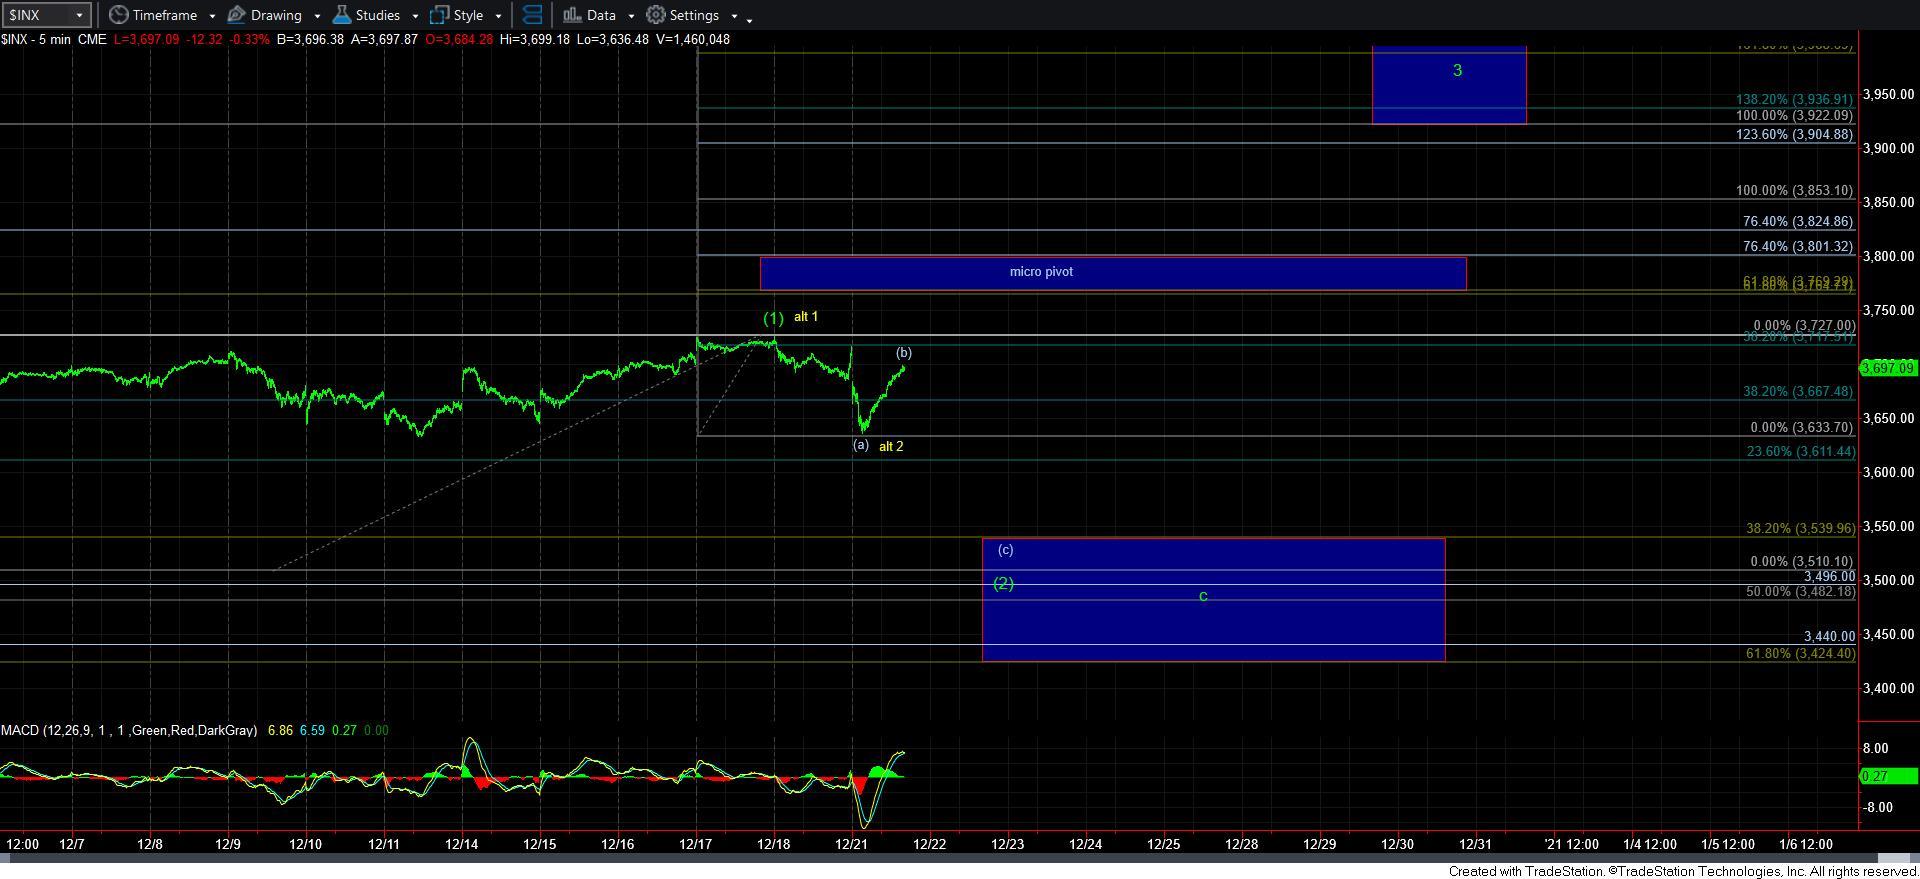
As you know, I have preferred to see more of a standard sized wave [2], which should ideally take us down closer to the 3500SPX region. The overnight action dropped us down to the 3600SPX region and has since bounced quite strongly.
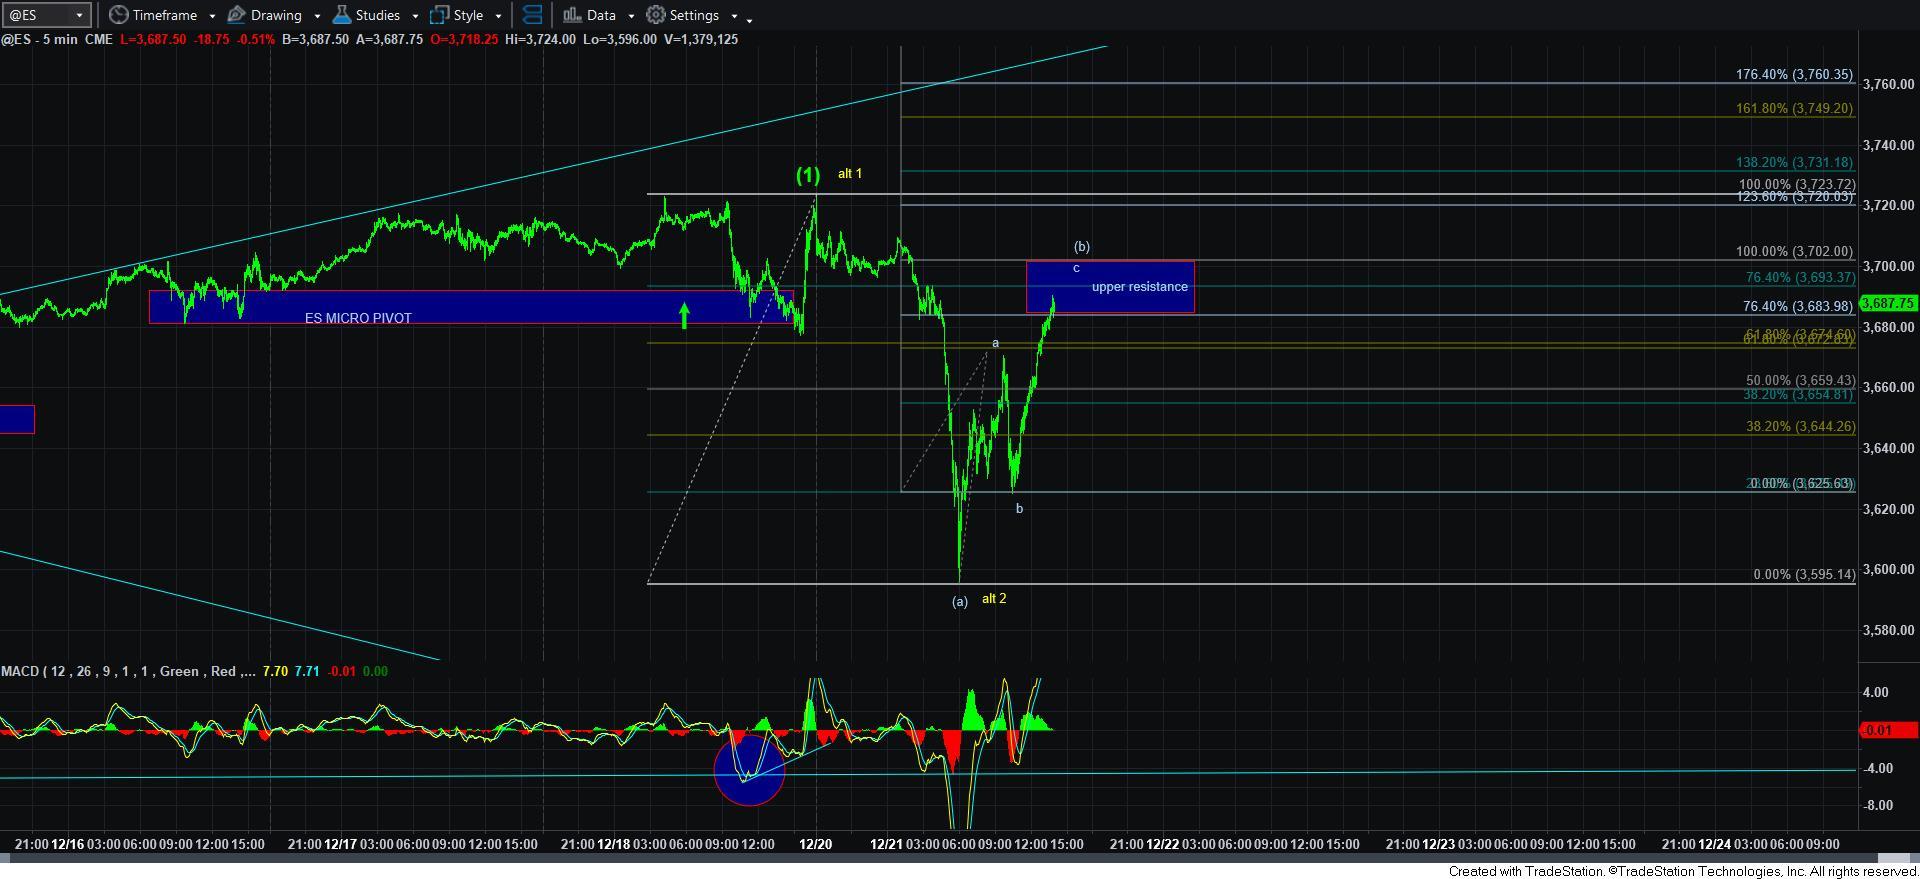
So, if you look at the attached ES chart, I would surmise that as long as we respect the 3702ES resistance, I can reasonably expect another drop to take us down towards the 3540SPX region. That would be my minimum expectation at this time for a potential wave [2]. I will outline alternatives should we get that [c] wave drop in the coming days.
However, if the market is unable to be restrained by the resistance box noted on the 5-minute ES chart, then I would have to view the pullback today as a 2nd wave of one degree higher – the wave 2 of wave [3].
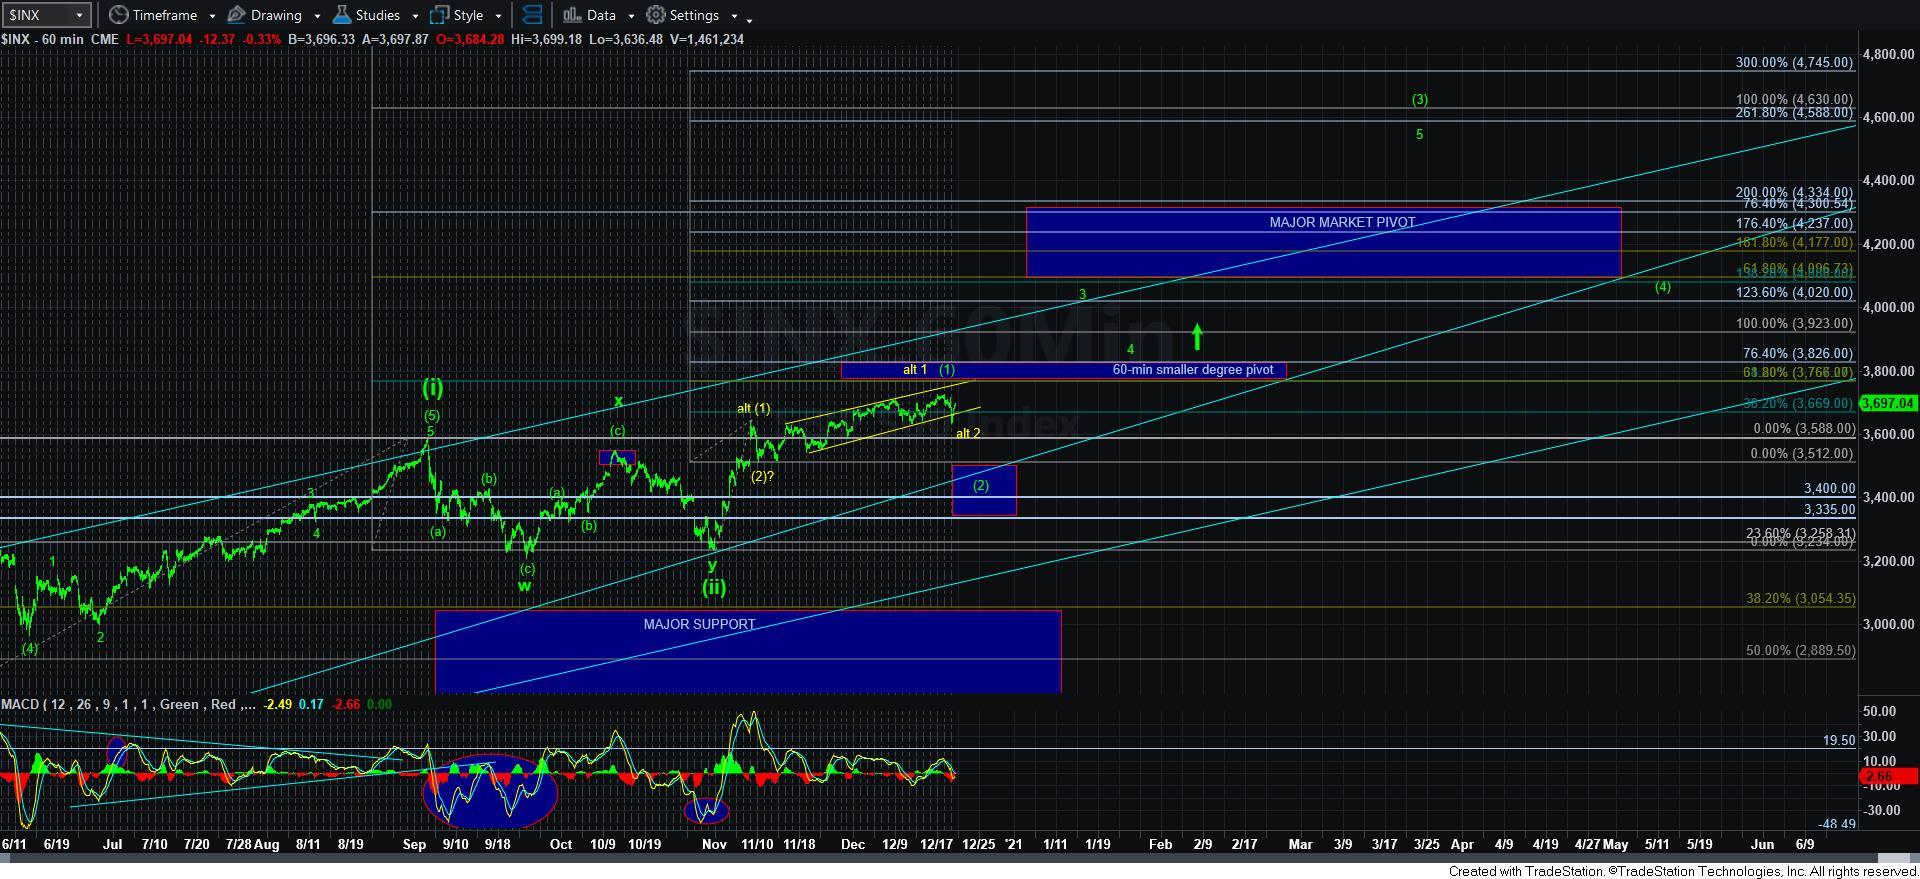
Ultimately, this market is poised to run much higher as we head into 2021, which, by now, should come as no surprise to anyone reading our analysis. Pullbacks are buying opportunities, especially within the individual stocks you are tracking. Our next major target for 2021 is the 4200/4300SPX region, but we expect much higher levels to be struck thereafter.
But, at the same time, I have been having strong issues with the miniscule size of what we would have to count as wave [2] if we completed it back in early November, and I have outlined these issues many times before. But, again, should the market prove to me that we are now rallying to 3900+ for wave 3 of [3], then I clearly have no choice but to accept that wave [2] as it currently stands. Until that is clear, I am still keeping counts on the chart for more of a standard wave [2]. I hope I have been quite clear in my perspective on this matter.
The last point I want to make is that if the market does break out through the 3702ES region, the projections for wave 3 do align rather well, and even suggest we can exceed the minimum target for wave 3 of [3], which currently standards at the 1.00 extension of waves [1] and [2] in the 3922SPX region. So, while I would certainly prefer a more standard wave [2], we have a minimum pullback struck for what we would normally expect of a wave 2 within a wave [2]. And, when a heart of a 3rd wave is about to take hold (and already has in many other charts), it is hard to maintain an expectation for more of a wave [2], especially if the market starts breaking out sooner rather than later.