Is This Really As Bullish As It “Feels?”
Today brought me back to feelings of late 2021 and 2019. Both those times, I was looking for a market top and pullback, and both those times the market extended beyond my ideal topping target. Clearly, the one I was expecting as we moved into 2020 was of a larger degree. But, in both those instances, the market pushed beyond my primary expectations before it eventually followed through with the respective pullbacks. And, I am getting the same “feeling” today.
So, I am going to present, again, my view as to where I think we are in the SPX, and also present some points on IWM and EEM as well.
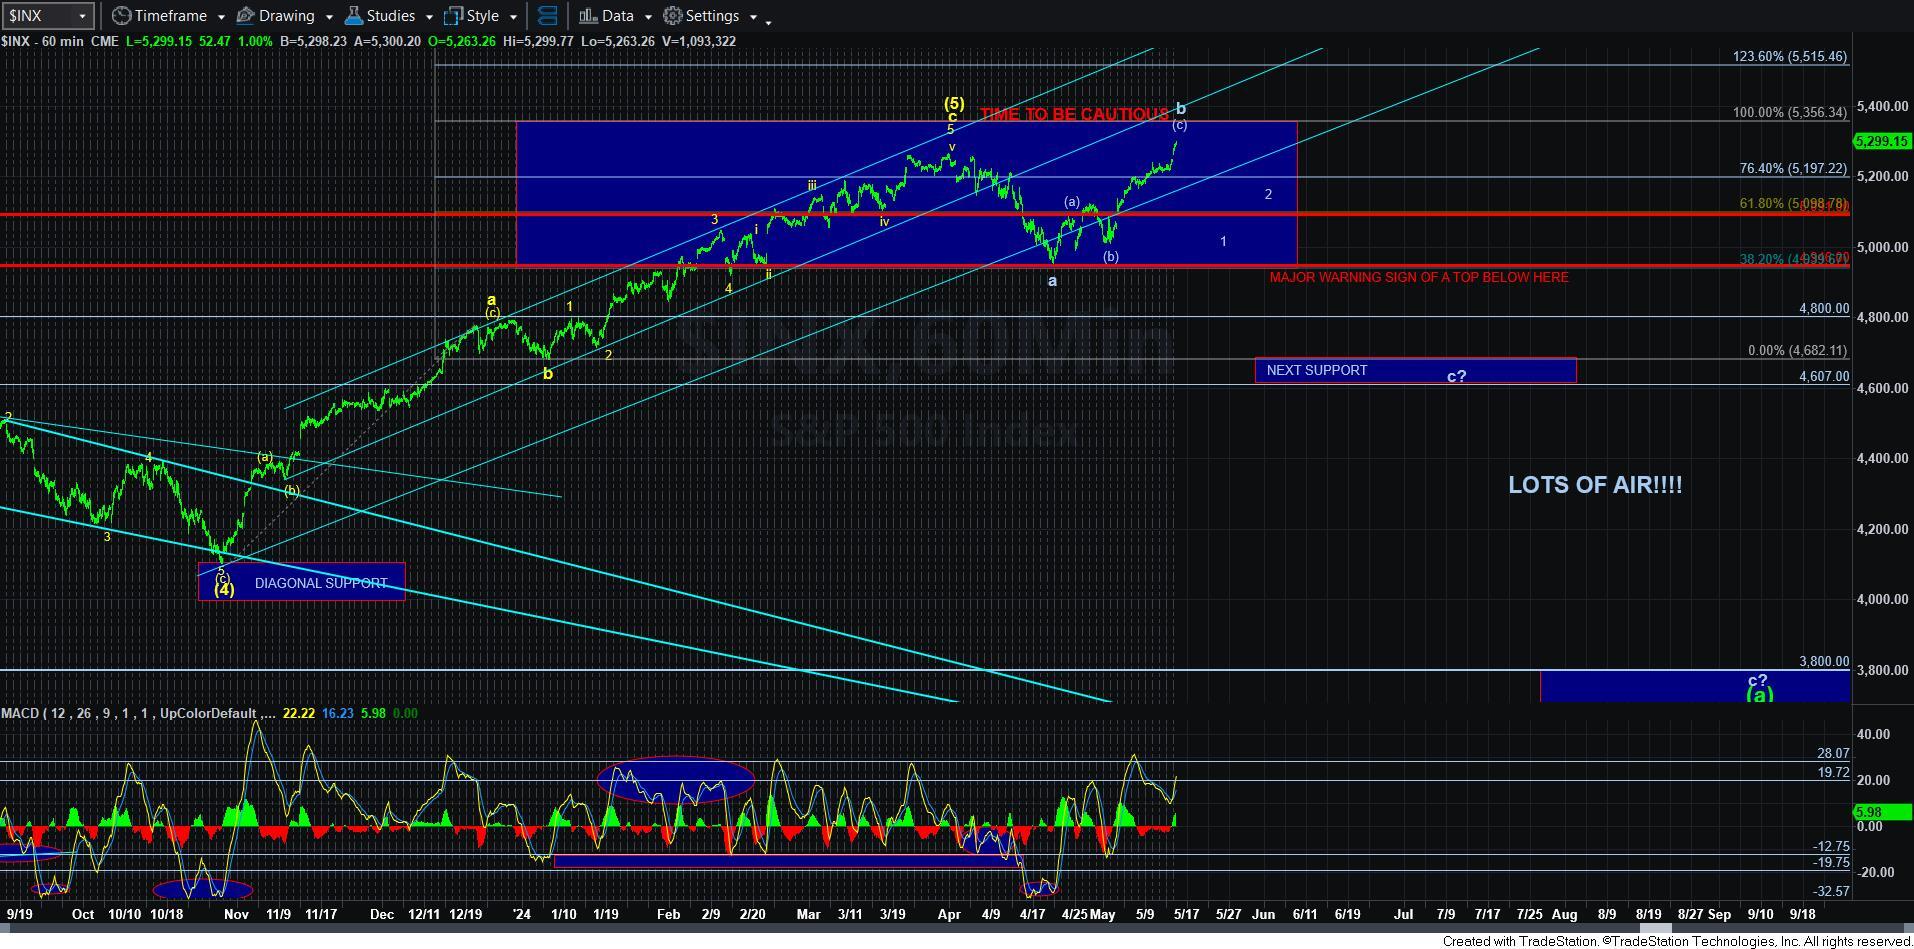
When the market was bottoming out in mid-April, I began looking higher for what I was expecting to be a corrective rally. Now, I know that the market came up a bit shy of our ideal target when it topped out on April 1, as the ideal target was the 5350SPX region. And, when the primary trend comes short, we oftentimes see the ensuing b-wave take us to the target that was missed. And, to be honest, I really did not expect we would rally that high in this instance, even though I was contemplating a bigger than normal b-wave rally. Yet, the market may be making that attempt here.
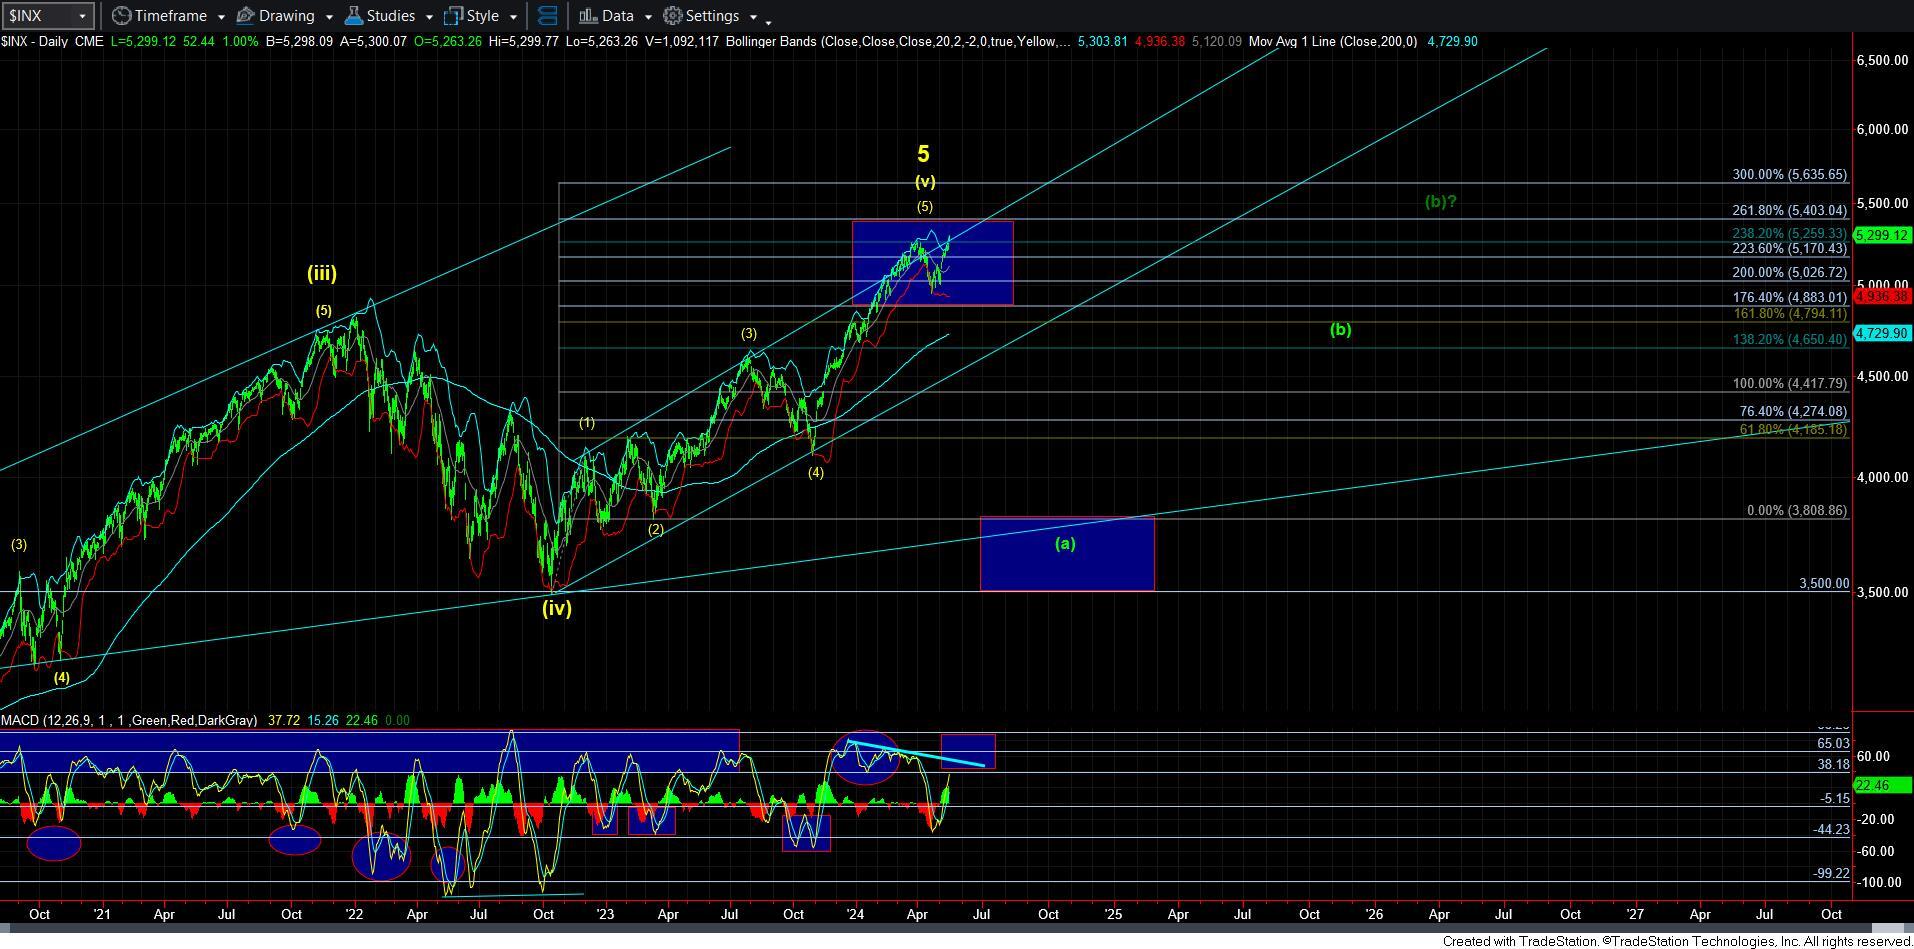
Now, the main reason that I am maintaining the b-wave count is because we have a rather completed structure into the April 1 high. And, the reason I view that as a higher probability count is because the rally off the October 2022 low was a relatively clear 3-wave structure throughout the move to the April 1 high struck in 2024.
In fact, I have seen many want to label the rally that I have labeled as wave [3] on my daily chart as something else. But if you look closely at the substructure of that move, it was NOT a 5-wave structure. Therefore, the labeling I have presented still makes the most sense. But, I digress.
At this point in time, I am seeing many people that have moved to targeting the 6000SPX region both within the virtual walls of our trading and outside of our community. However, I have yet to see a wave structure that takes us there that is more than “wave slapping.”
Therefore, after re-reviewing my work, I still come to the same determination as being presented on my charts. And, if you would know how much work I put into my analysis to find where I can be wrong, you would understand what it takes for me to come up with a primary wave count.
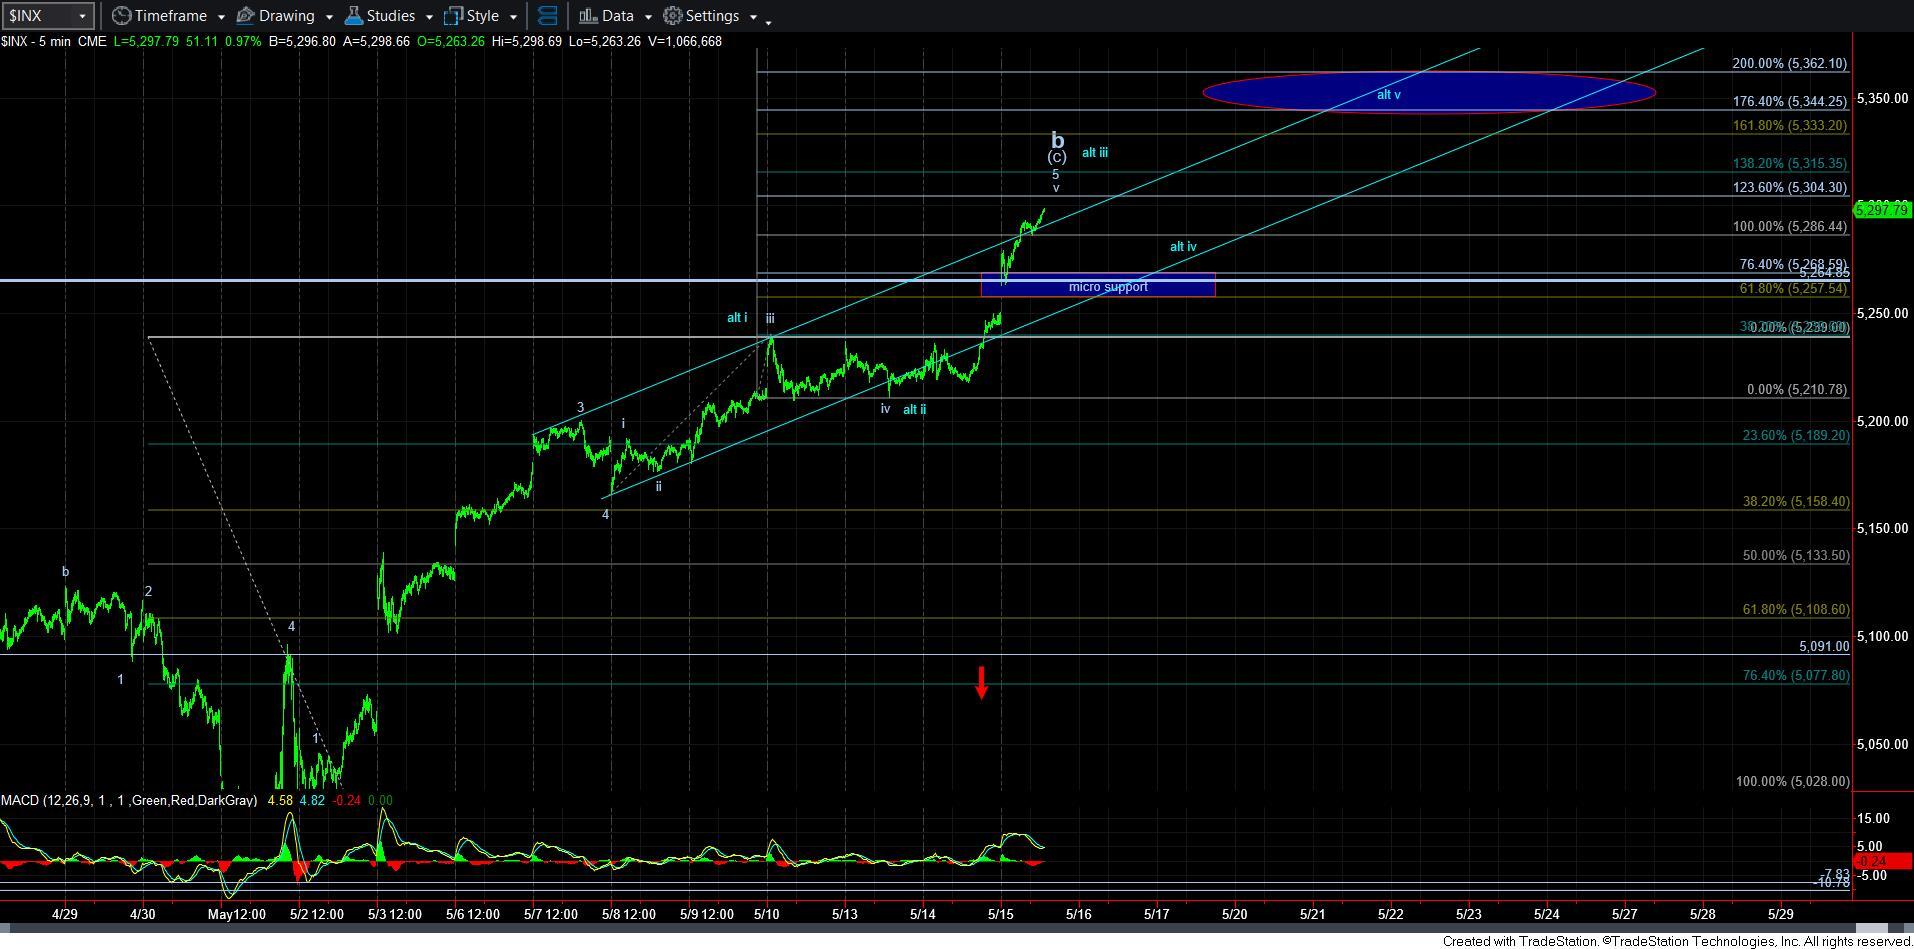
At this time, I have included a 5-minute SPX chart, which still suggests we are still trying to complete a b-wave. The question now is how high can this b-wave carry? And, could it carry us all the way to 5350SPX? Well, the answer is yes, but I have a hard time adopting that potential since the proportions of these structures just seem to unusual to adopt that as a primary count. Yet, I have presented that potential for a VERY extended 5th wave in blue on the 5-minute chart.
Instead, I am going to note that the micro support is now at the 5255-5268SPX region (as noted on the 5-minute chart). A break-down below that level – especially if impulsive – begins our confirmation process. However, as long as we remain over that support, the market may choose to carry us to our prior ideal target in the 5350SPX region.
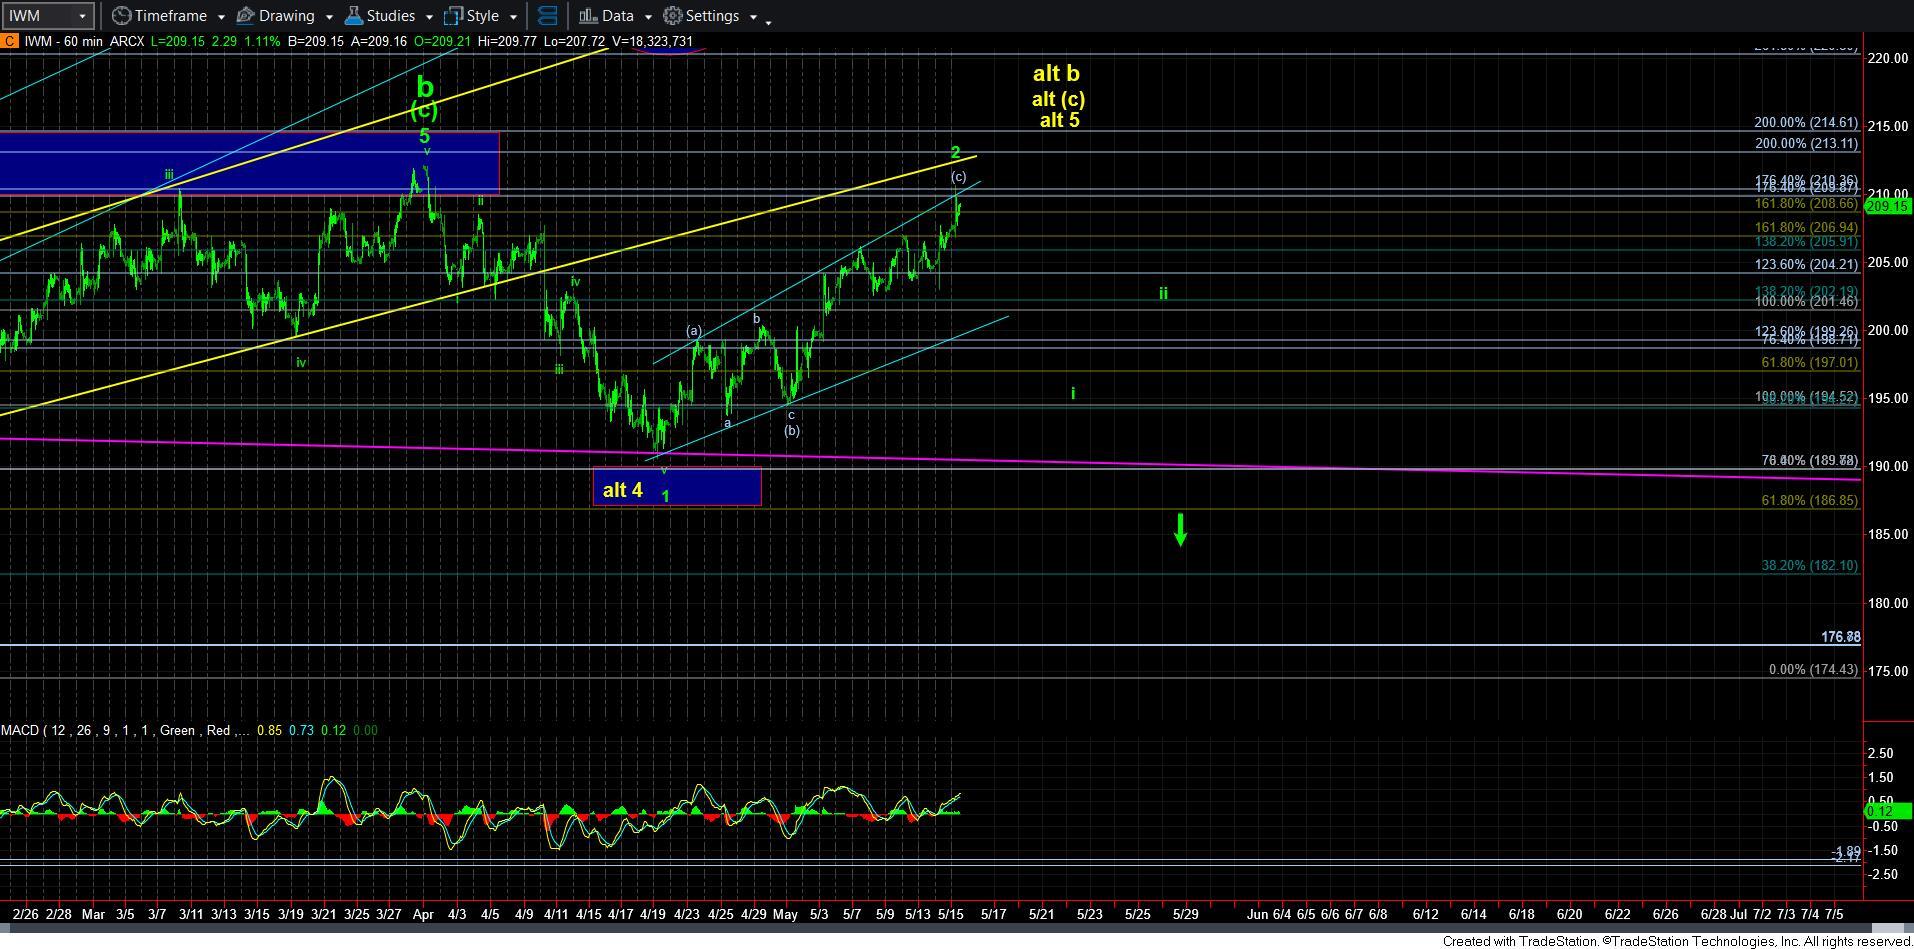
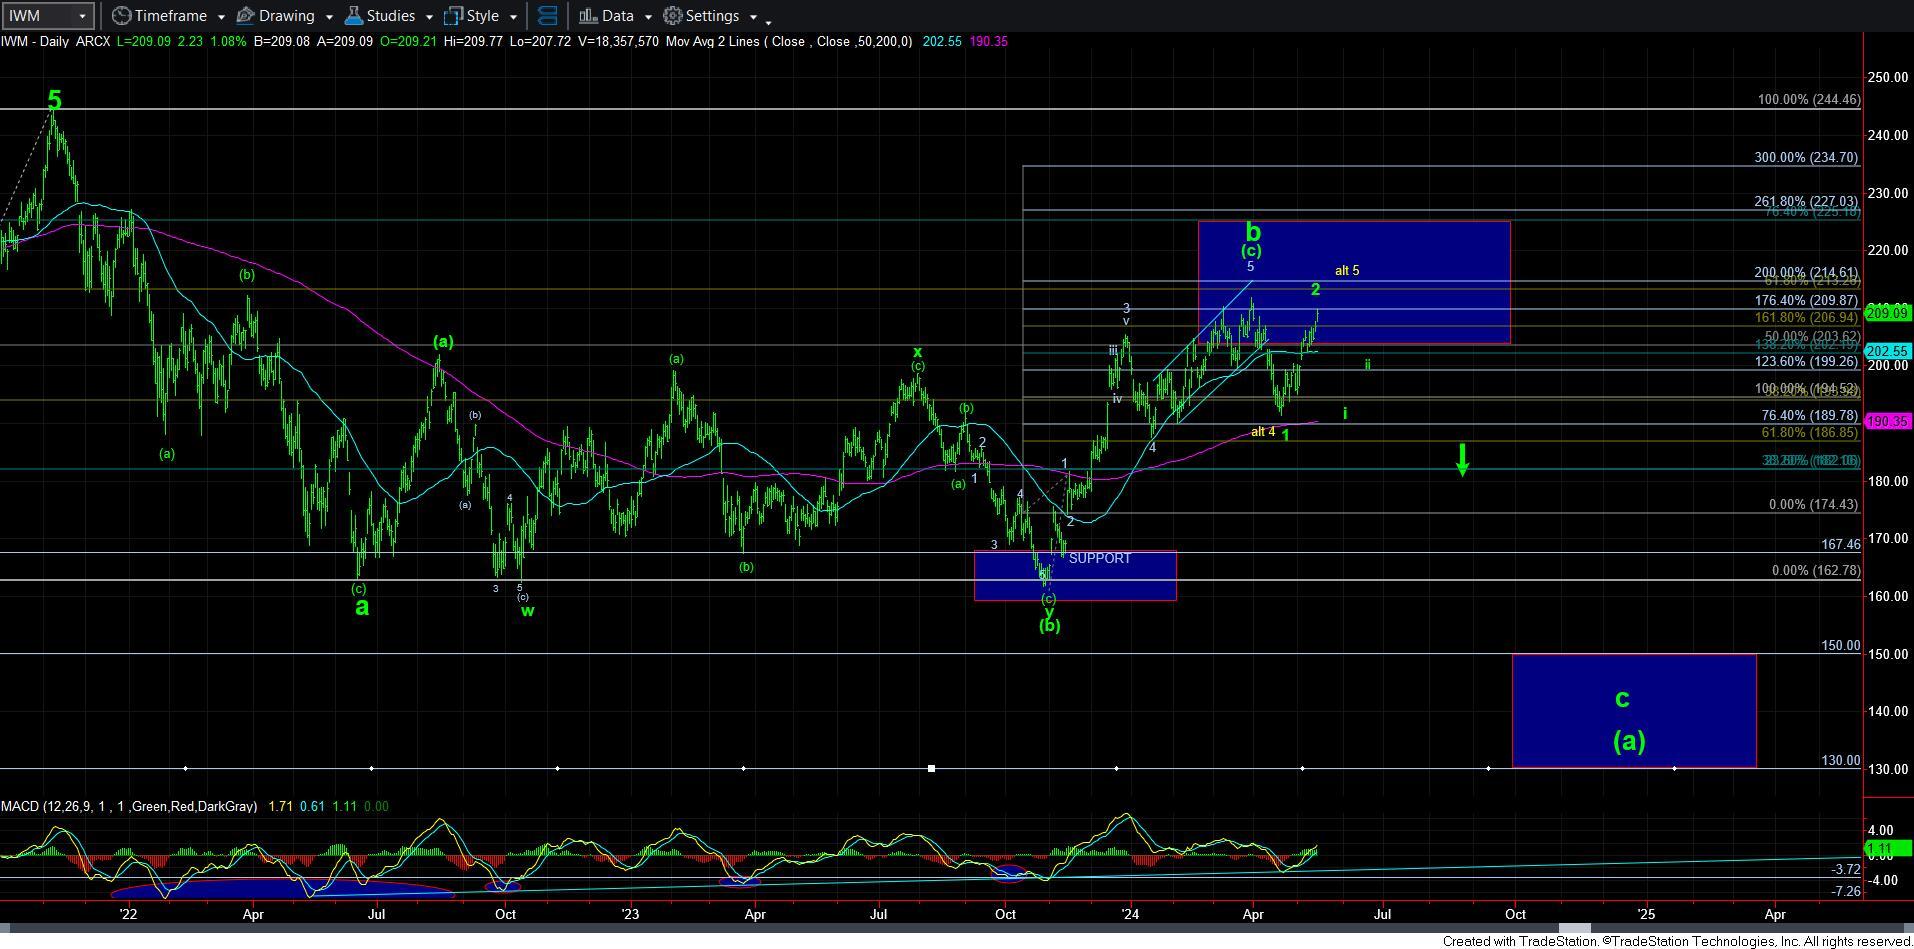
But, this does not change my perspective as viewing risk as rather high. Despite many attempts, I still cannot come up with a strong bullish alternative that would suggest that this bull market has much higher to run. The closest I have is presented on the IWM charts. It would indeed suggest that this is a 5th wave rally that can still carry us to the 215 region. But, again, this is clearly not my preferred path for all the reasons I have outlined many times before. Should the market be able to exceed the April 1 high in IWM, then I will have no choice but to adopt it.
Moreover, I have again reviewed the larger degree daily chart of the IWM, and still cannot come up with a major bullish alternative. The larger degree a-b-c structure being presented is far and away the highest probability view I can identify. Whether that b-wave has indeed topped is the question with which we are currently grappling.
Keep in mind that our goal is always to attempt to identify what we view as the highest probability paths. That does not mean it is a guarantee the market will follow that path. Rather, it means that we view that as the greater probability. And, sometimes, the lesser probability paths do take hold. That is simply the nature of the game. But, clearly, based upon our 13+ year history of doing this publicly, the market has followed our primary paths the great majority of the time.
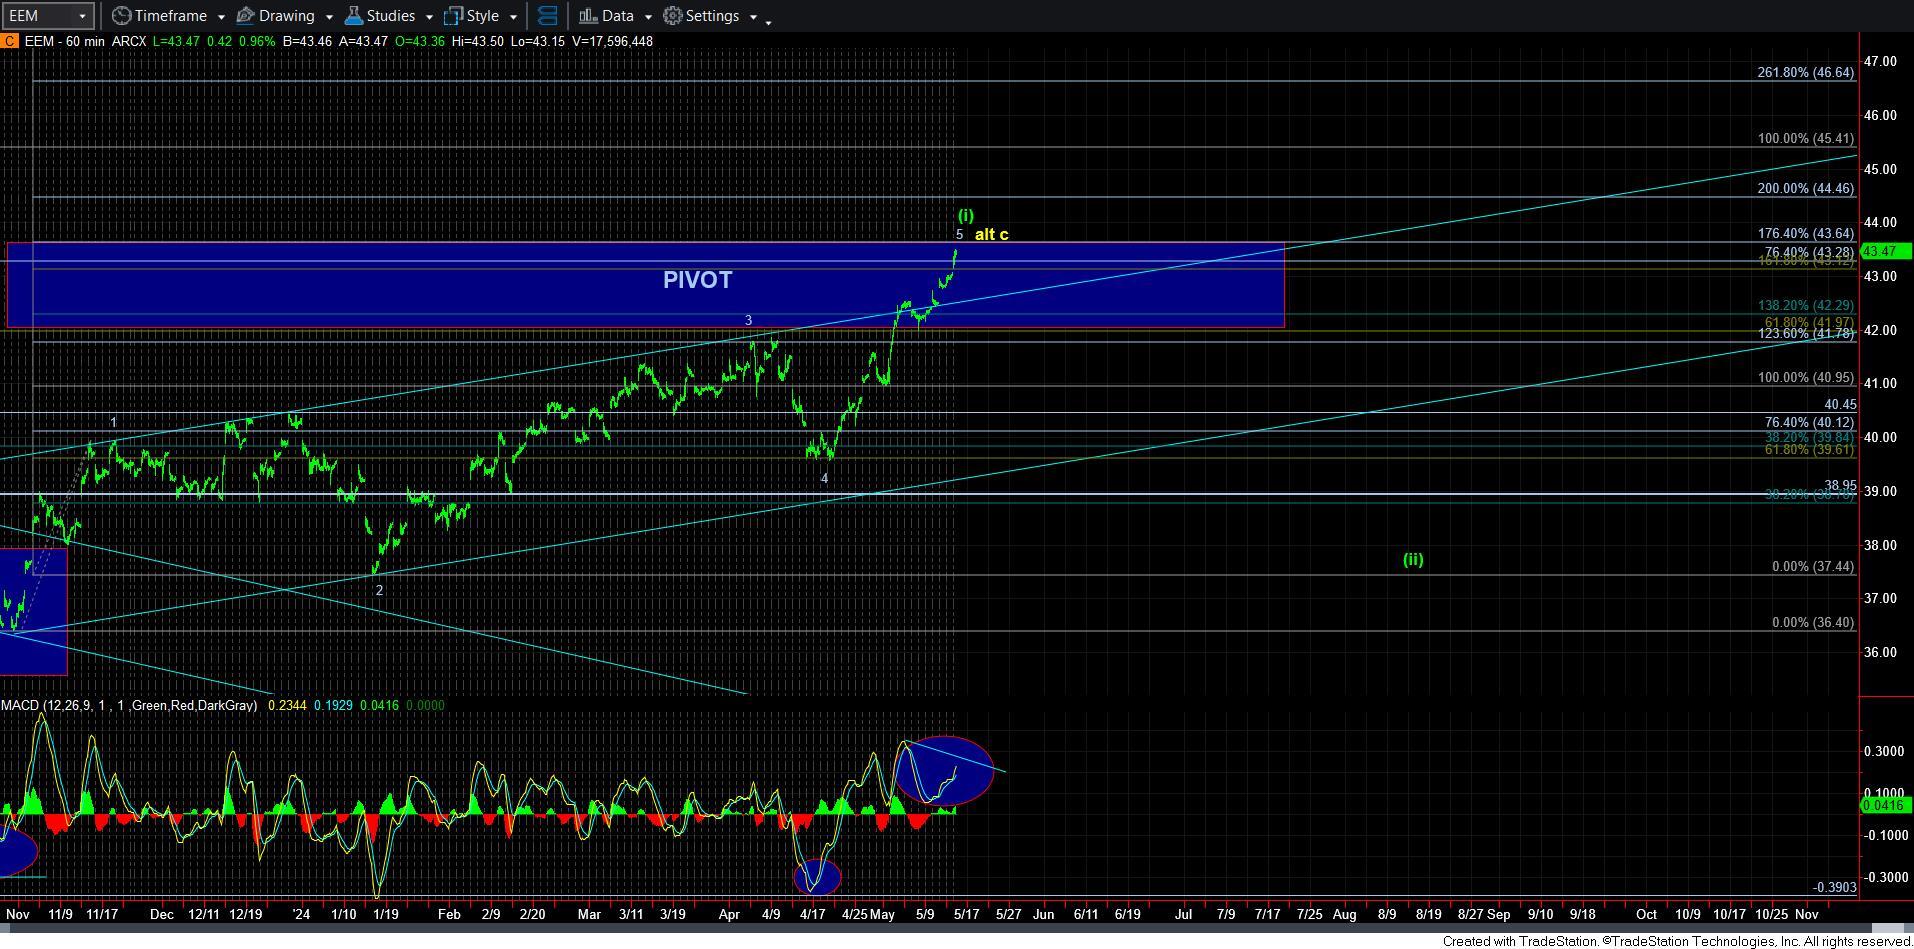
And, again, I want to note that I believe that risk is quite high right now in the bigger picture, no different than I viewed the risk as quite high in December and January of 2020. I view this so much so that I have personally moved out of most of my equity positions in the market, other than a smaller position in EEM, a handful of individual equity holdings, in addition to oil and metals equities, with a lot of that cash raised being put into Treasuries. Consider the rates that they are paying right now, and balance that against the risk I see in the market, and this was a relatively easy decision for me personally.
The EEM is also strongly indicative of a topping as well. While I have wanted to see more of a standard impulsive move in the EEM, as I have been correctly bullish for quite some time, the overlap we have seen over these last several months has been more indicative of a diagonal, with us now approaching the 1.764 extension of waves 1-2 within that diagonal, which is the typical target for wave 5 in a diagonal. So, this also tells me that risk is high now for a reversal.
I also want to point out that the MACD on the daily chart has now reached the resistance at which a corrective rally would be expected to top out. So, this just adds to the general risk assessment I have been outlining.
This again brings me to a warning that I have been posting almost incessantly. PLEASE do not begin to short his market until we see a confirmation of a top, as I have outlined many times. Should the market present evidence to disprove my base thesis regarding the market topping out, I will clearly communicate that to you. But, for now, and after re-reviewing all my work, I still come to the same conclusion: risk in the market is much higher than many choose to recognize right now, as many seem to be gripped with FOMO, without a recognition of what the larger degree long-term structures are now presenting in the equity markets. And, please do not view this as something that is coming from a perma-bear. Those that have followed me for years know quite well that I am simply focused on being perma-profit.