Is The Russell 2000 Leading The Markets Higher?
 By
By
Today we saw the market open higher after testing the lower end of the upper support zone yesterday. While we are still trading up just under half a percent at the time of this writing the Russell 2000 is currently up over 1.7% and closing in on the overtaking the high that was struck on 3/21. So that leads us to the question of whether the Russell 2000 is leading the markets higher or whether this move on the Russell 2000 is simply another fakeout in the form of a b wave before moving lower once again.
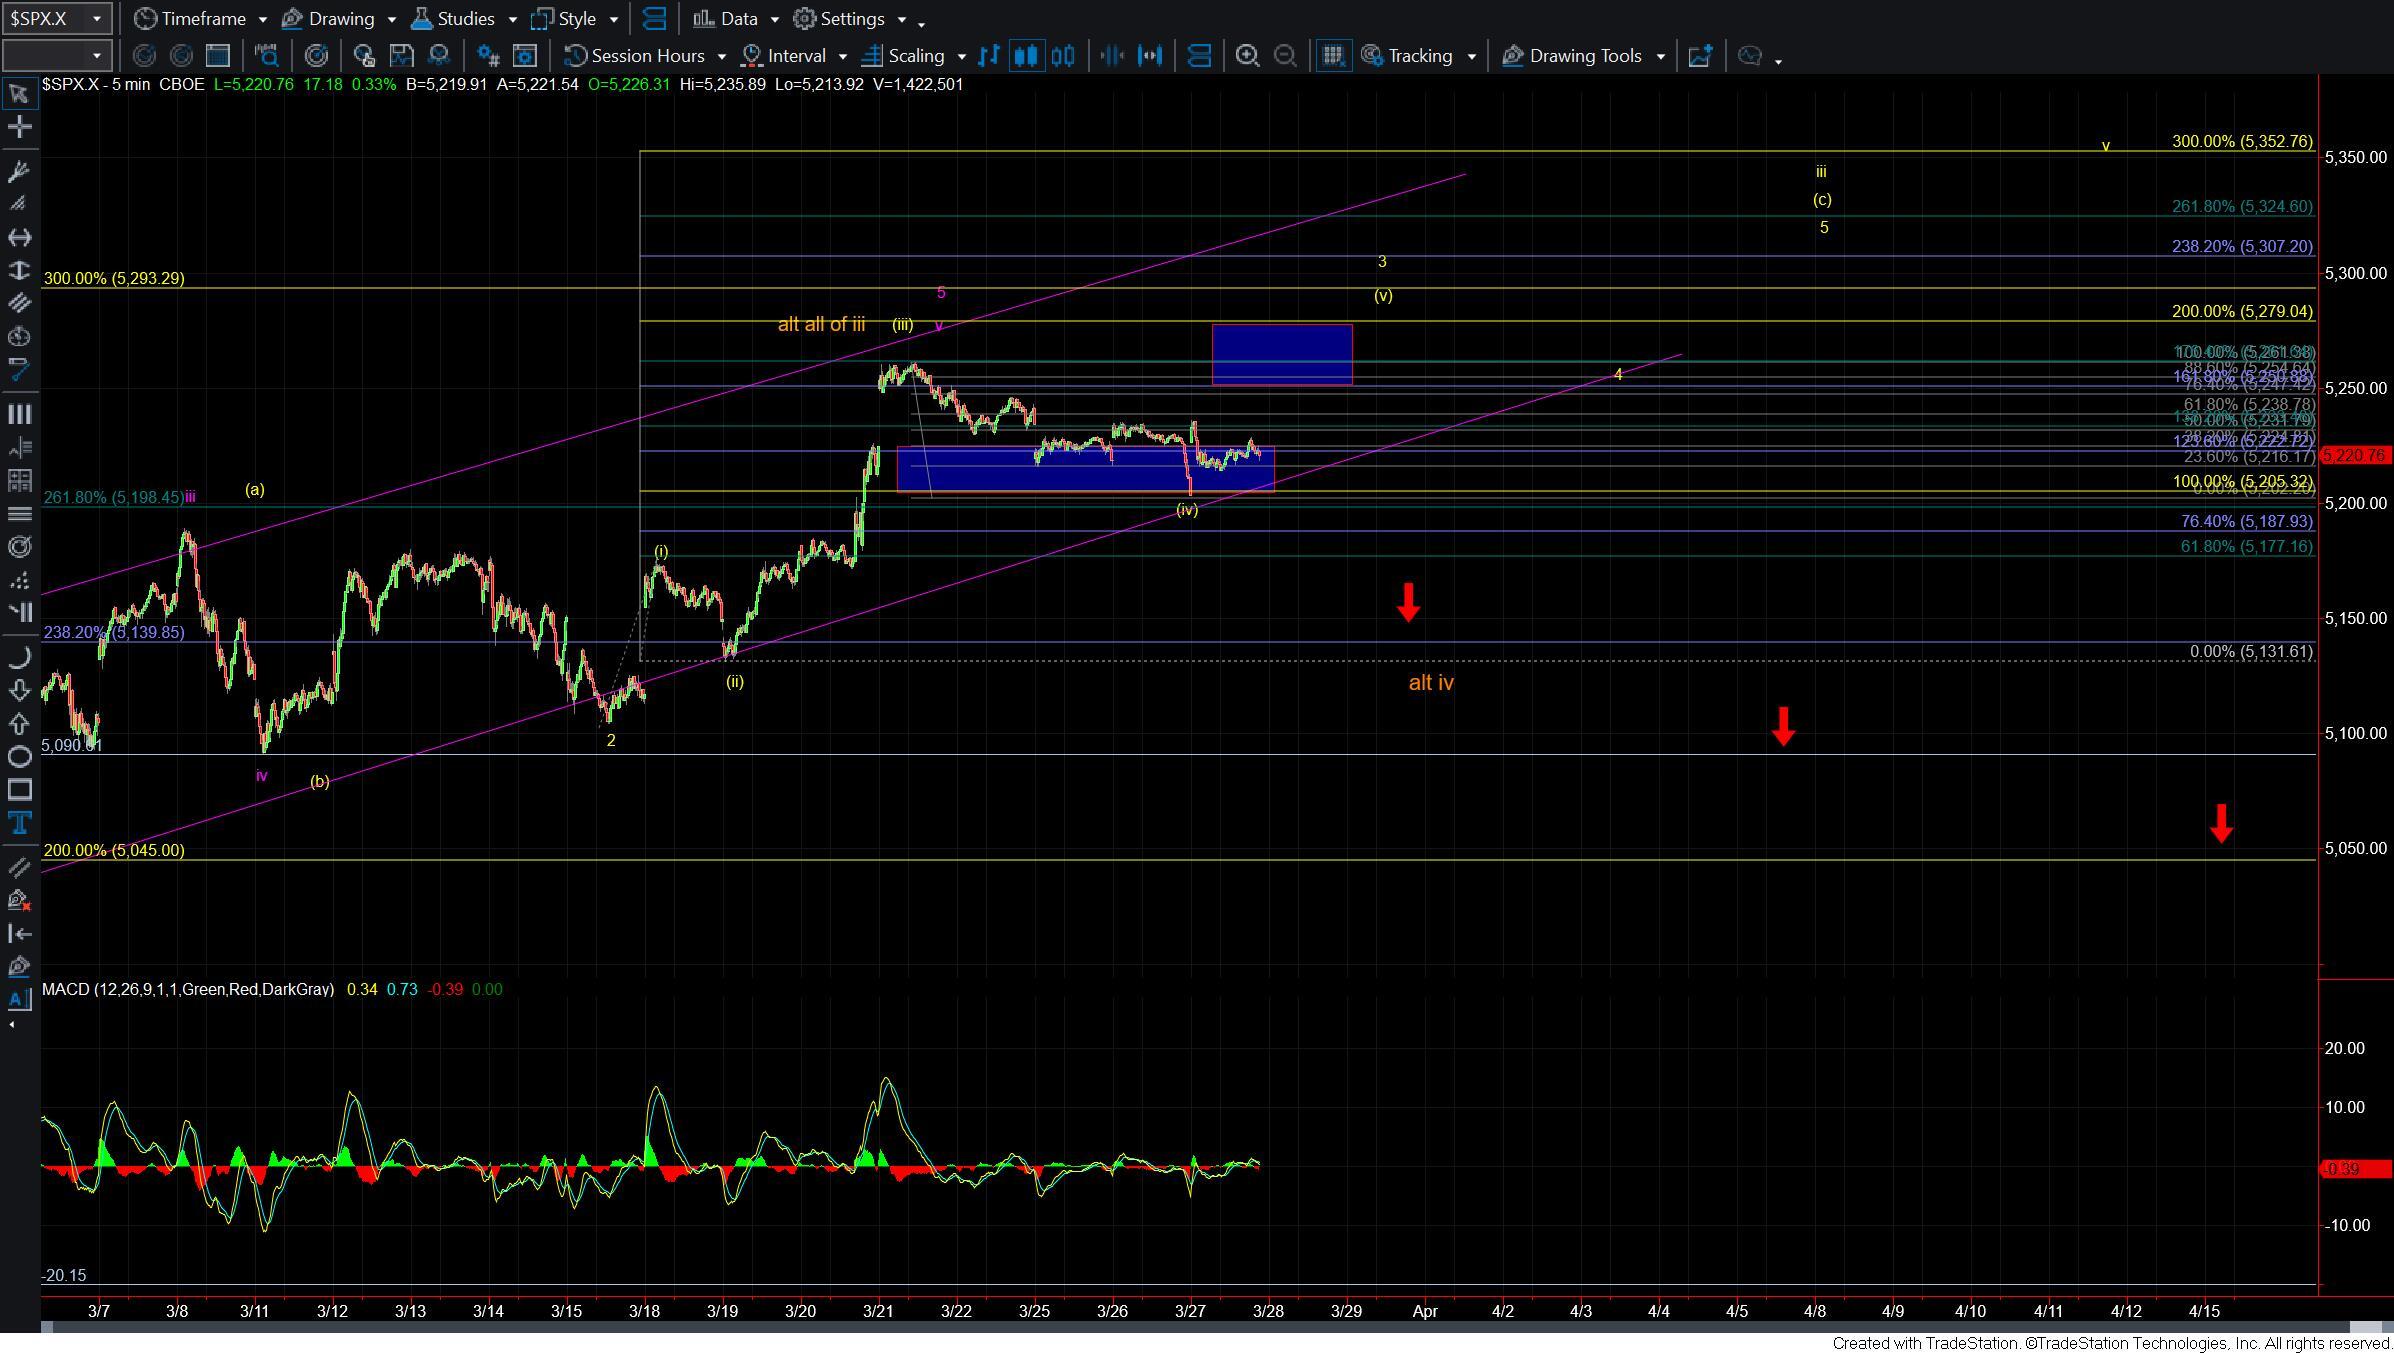
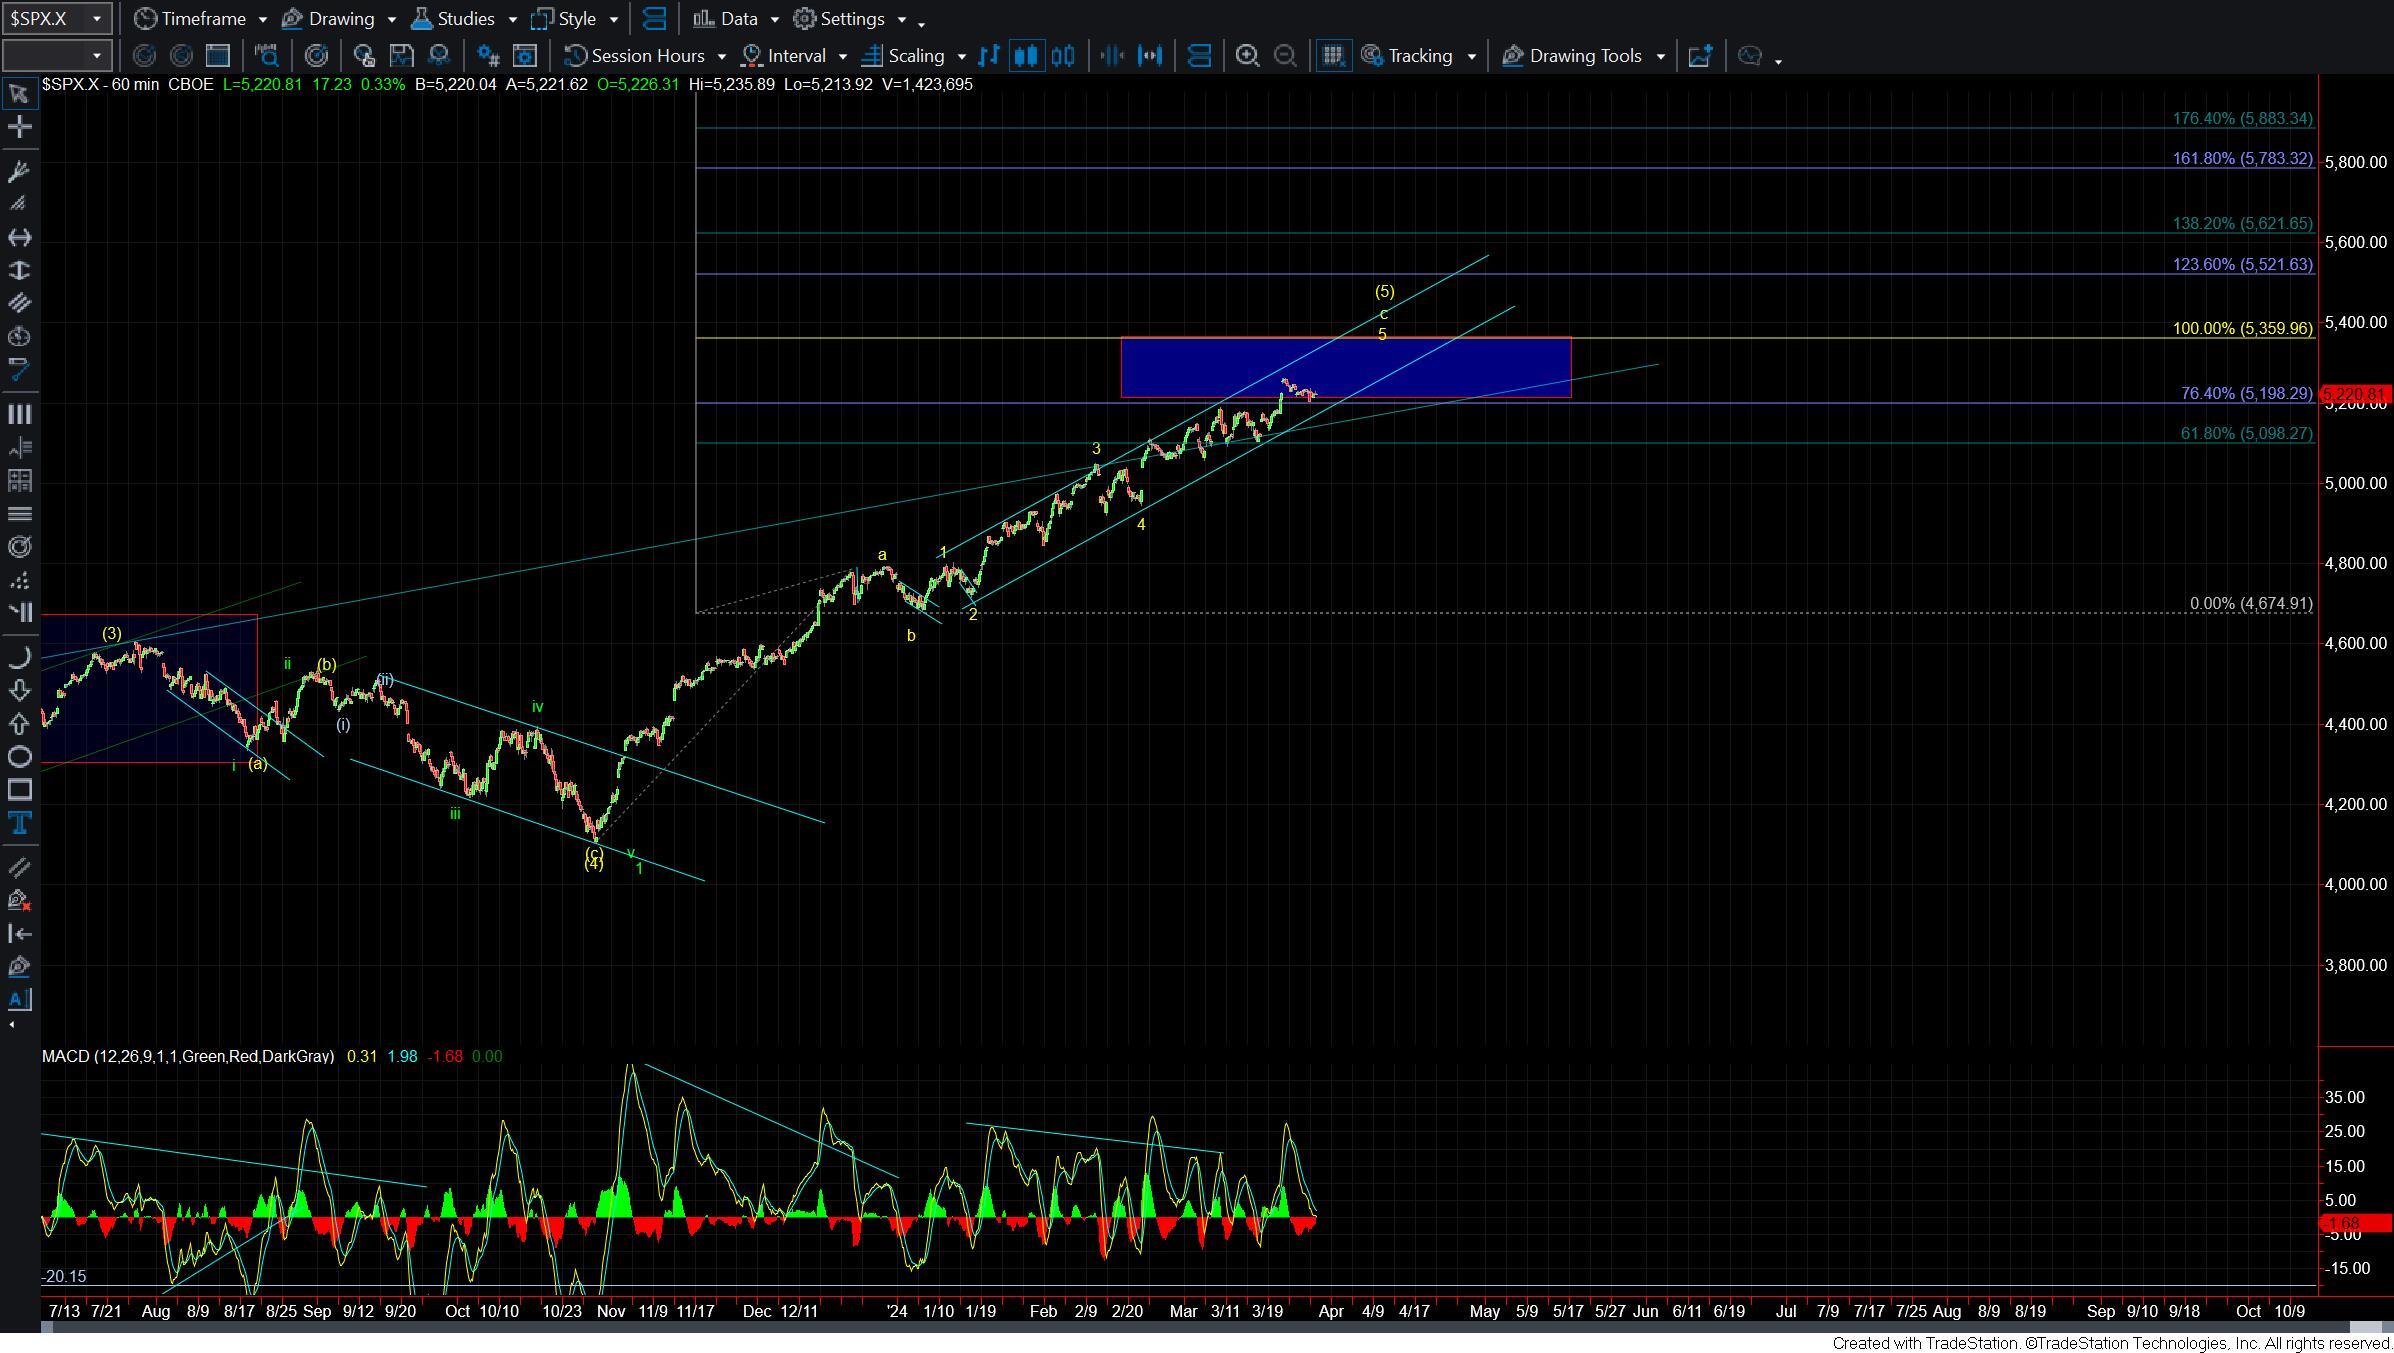
In regards to the SPX itself, very little has changed in the count. As I noted over the past several days upper support came in the 5222-5205 zone. The lower end of that zone held today and we managed to push higher off of that level. So as long as we can hold the low at the 5205 level then the next target overhead comes in at the 5250-5279 zone. From there we still should see a consolidation for a wave 4 followed by a wave 5 push higher to finish off the wave (c) of iii. Once we top in the wave iii I would expect a deeper pullback for the wave iv towards the 5150 area.
If the market is unable to hold over the upper micro support at the 5205 level then it would open the door for a local top to be in place. We still would however need to break back under the 5131 level followed by a break under the 5090 level to give us a signal that we may have put in a larger degree top in either all of the yellow wave iii or perhaps all of the wave 5 in purple.
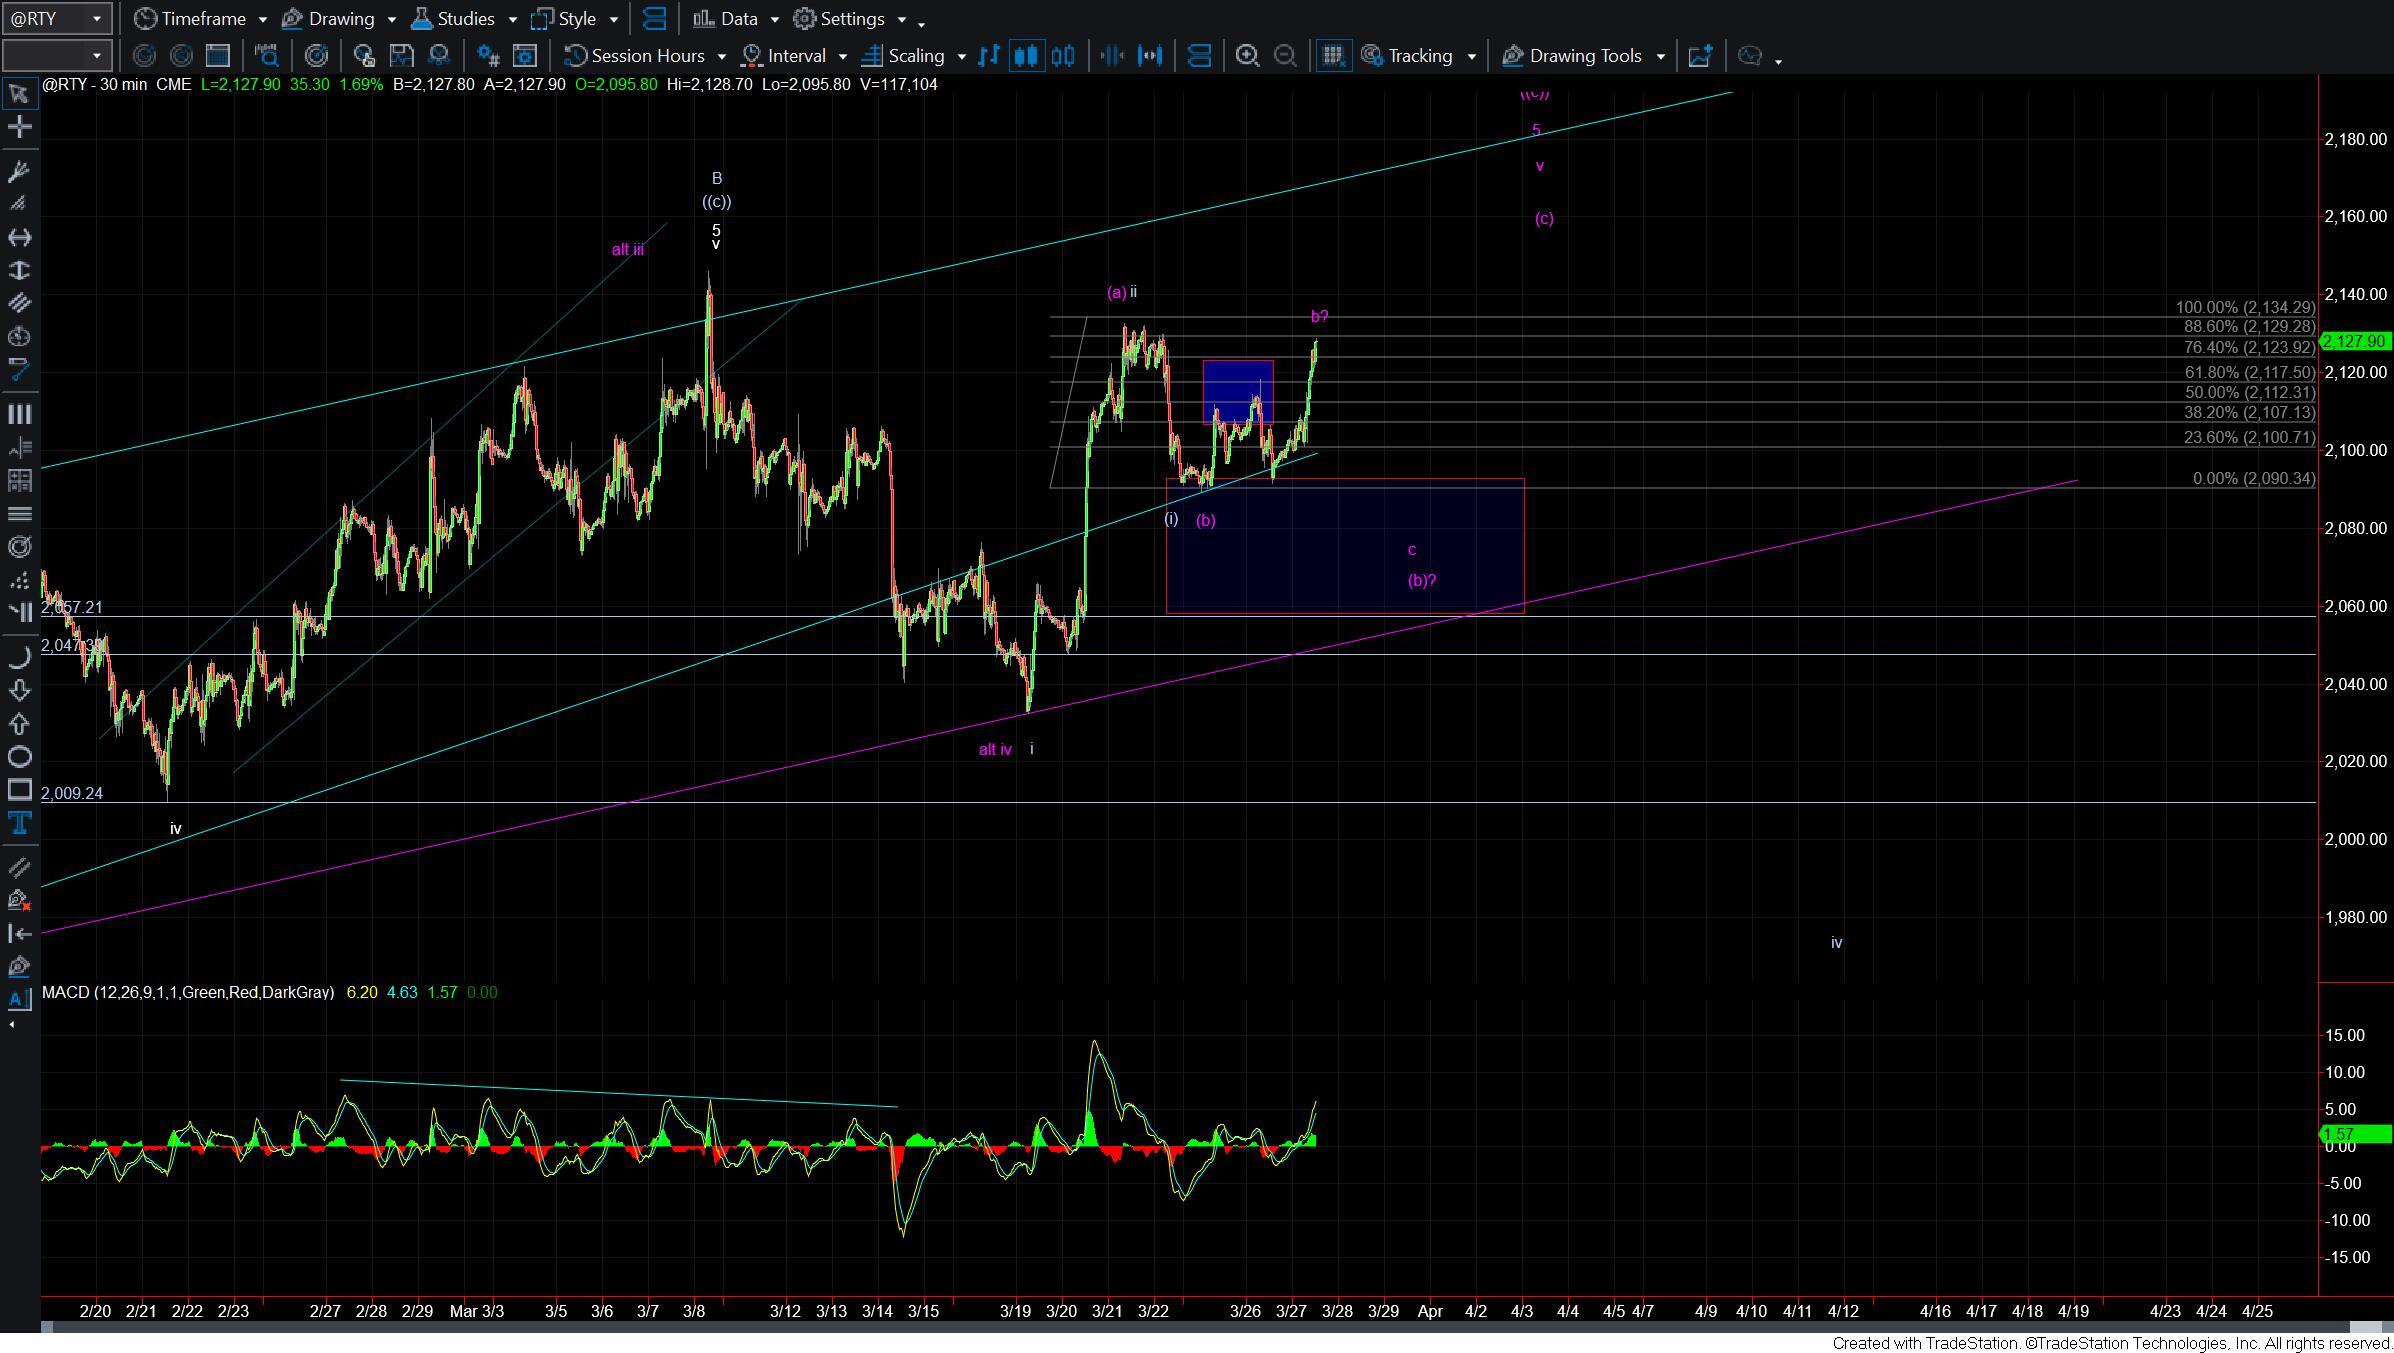
The strength today in the RTY is however increasing the odds that we will see a direct break higher as part of the wave (c) of v of larger wave 5. Under this case, if we can manage to break over the 2134 level we will have further confirmation that the RTY is ready to move directly to new highs. Under that scenario, I think its likely that the SPX would follow to make at least one more higher high and potentially continue higher following the yellow path as laid out above.
If the RTY is unable to break out over the 2134 level but rather turns lower then we will likely see several more days of sloppy wave action before this is resolved. This is fairly typical wave action when trading inside of an Ending Diagonal. For now however and as long as the RTY remains over the 2090 low then I think the odds favor pushing directly higher which again would likely to see the SPX and NQ follow higher as well.
Although the market likely has a bit of unfinished business to the upside the larger degree pattern is still very full up in this region and we are working on smaller degree ending diagonal patterns now on all three major indexes. So with that, I will remain cautious as we trade in this region however until we fill out the smaller degree pattern and then begin to break some support below we still do not have confirmation of a top being in place just yet.