Is The Rally Done?
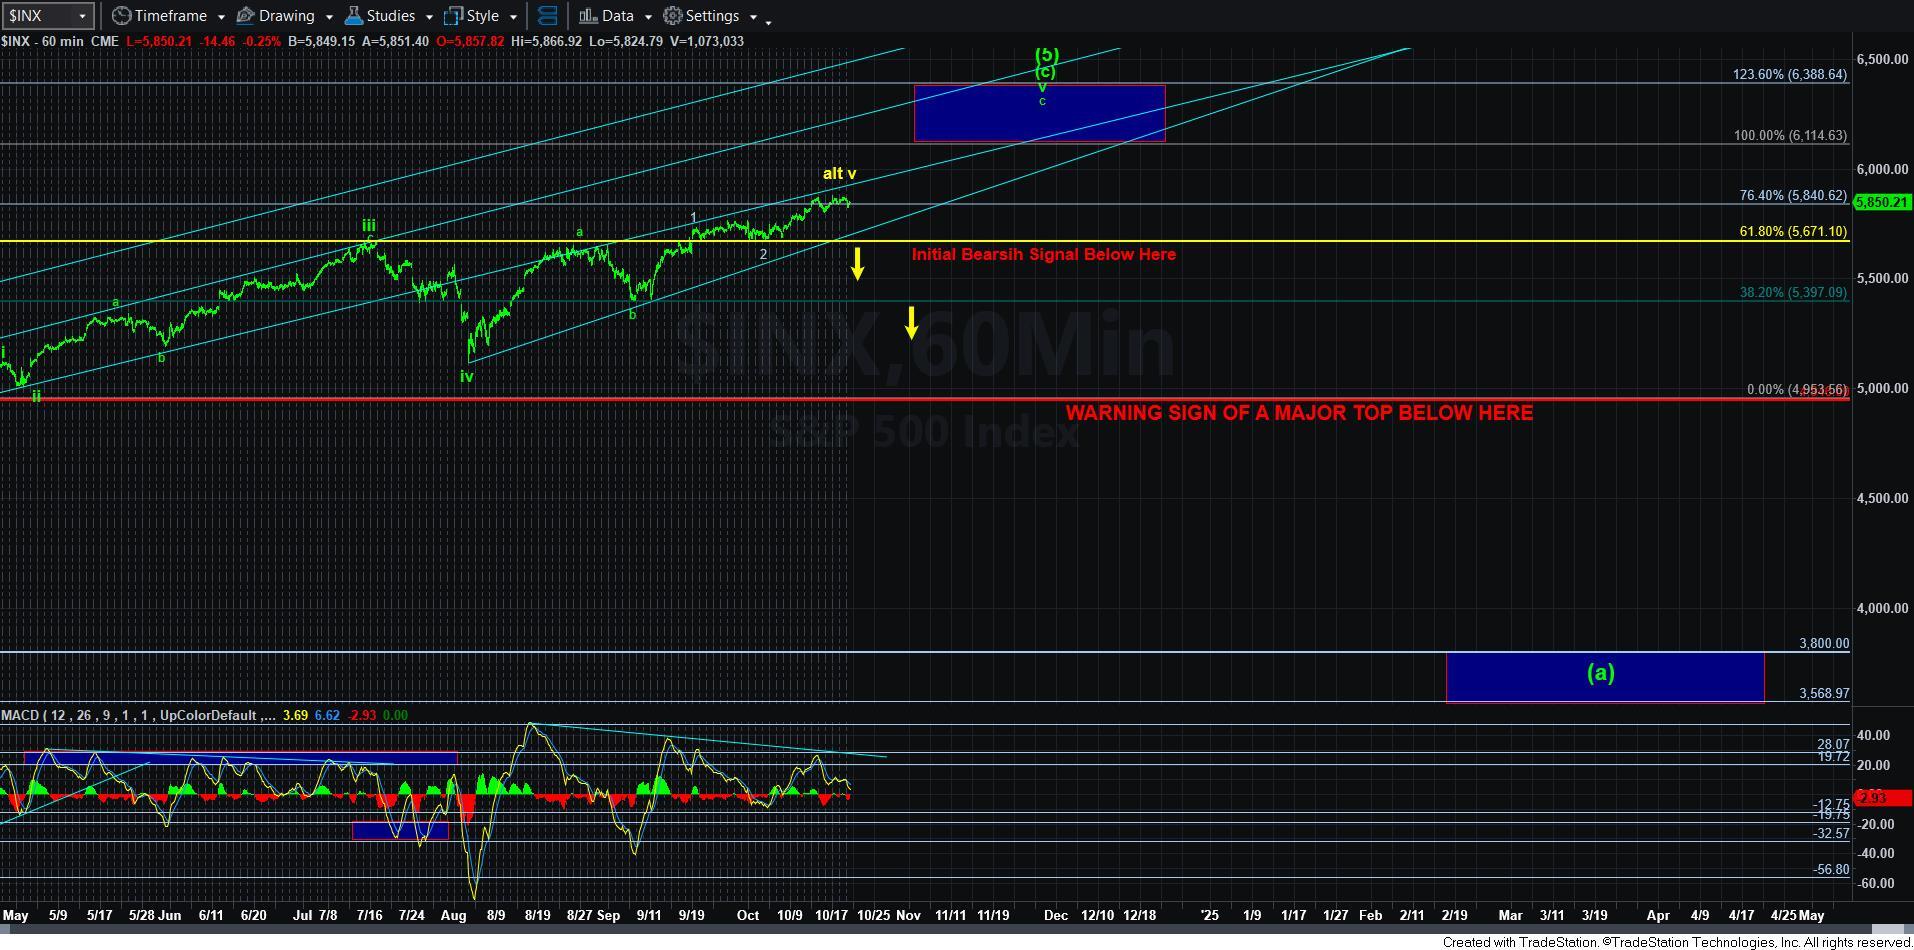
This is the question with which we have been grappling for the last week or two. It basically questions whether the rally off the 5674SPX low has completed its 5-wave structure. And, as I have been outlining over the last two weeks, the ES and SPX are presenting slightly different perspectives on the answer to this question.
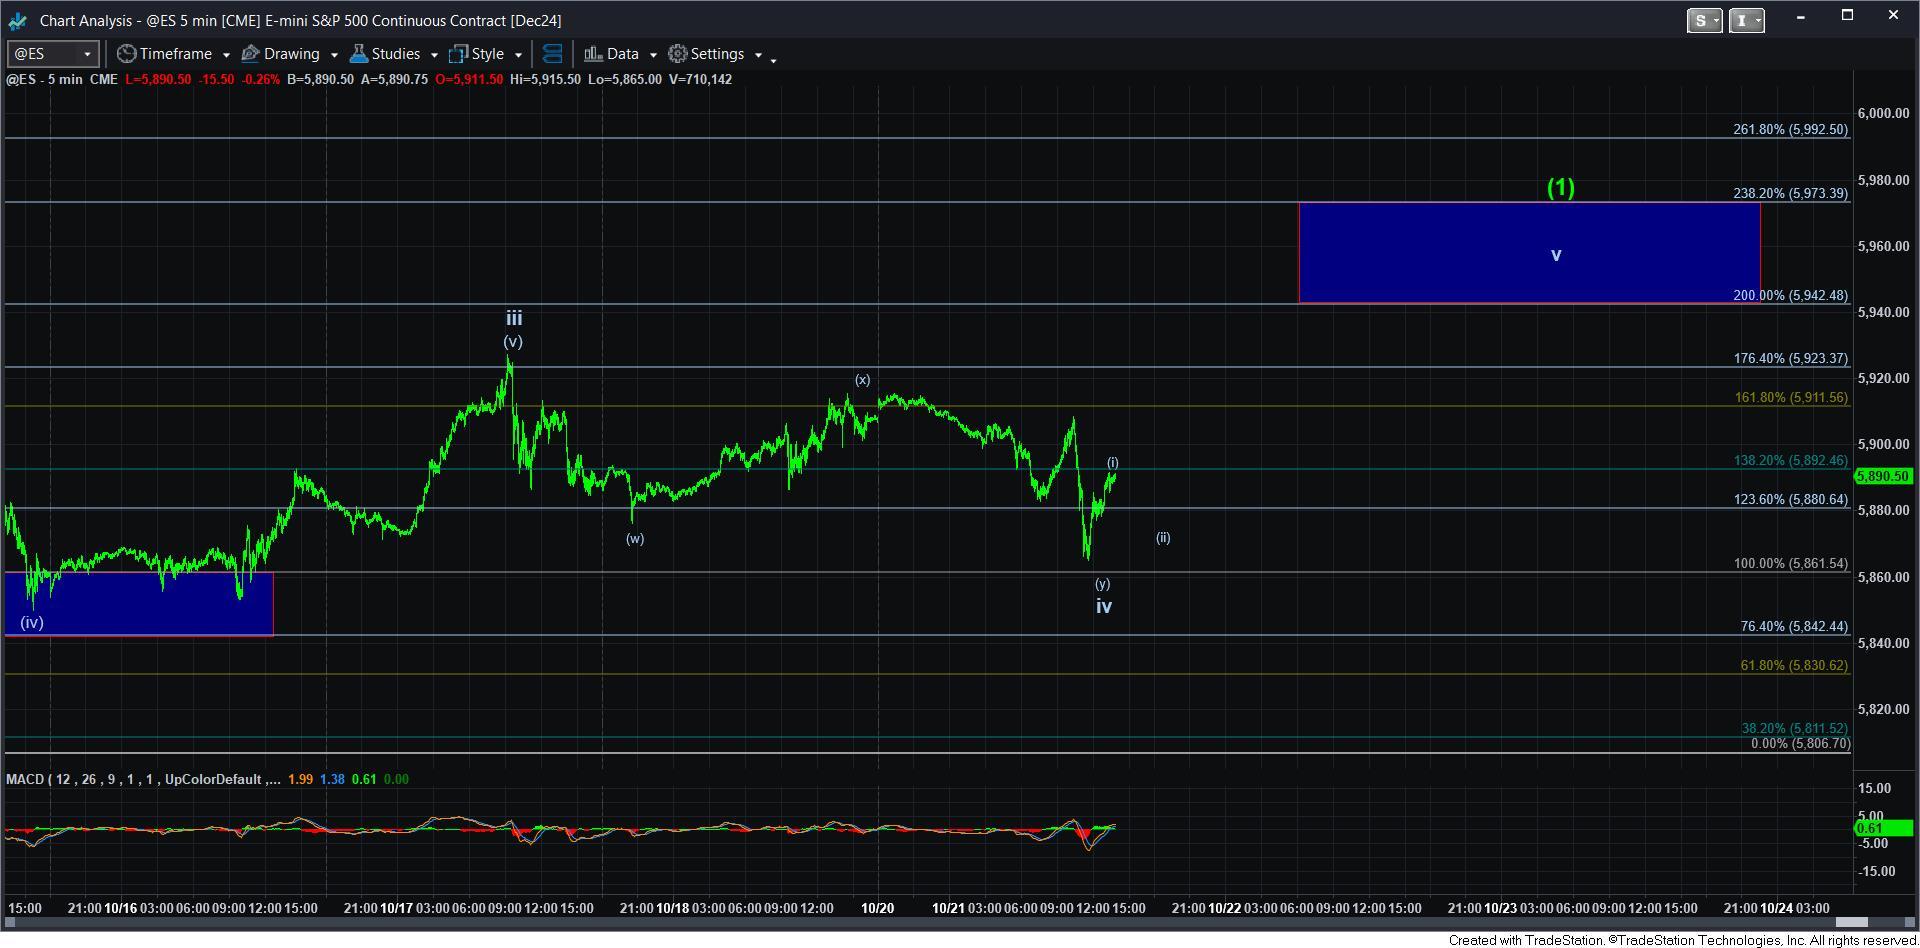
As I have shown you with the ES chart, there still is a reasonable structure that needs one more higher high before this 5-wave rally is done. And as long as we hold over today’s low, then we have a smaller degree structure in place to point us to that higher high to complete the green [1] or, alternatively, the yellow V.
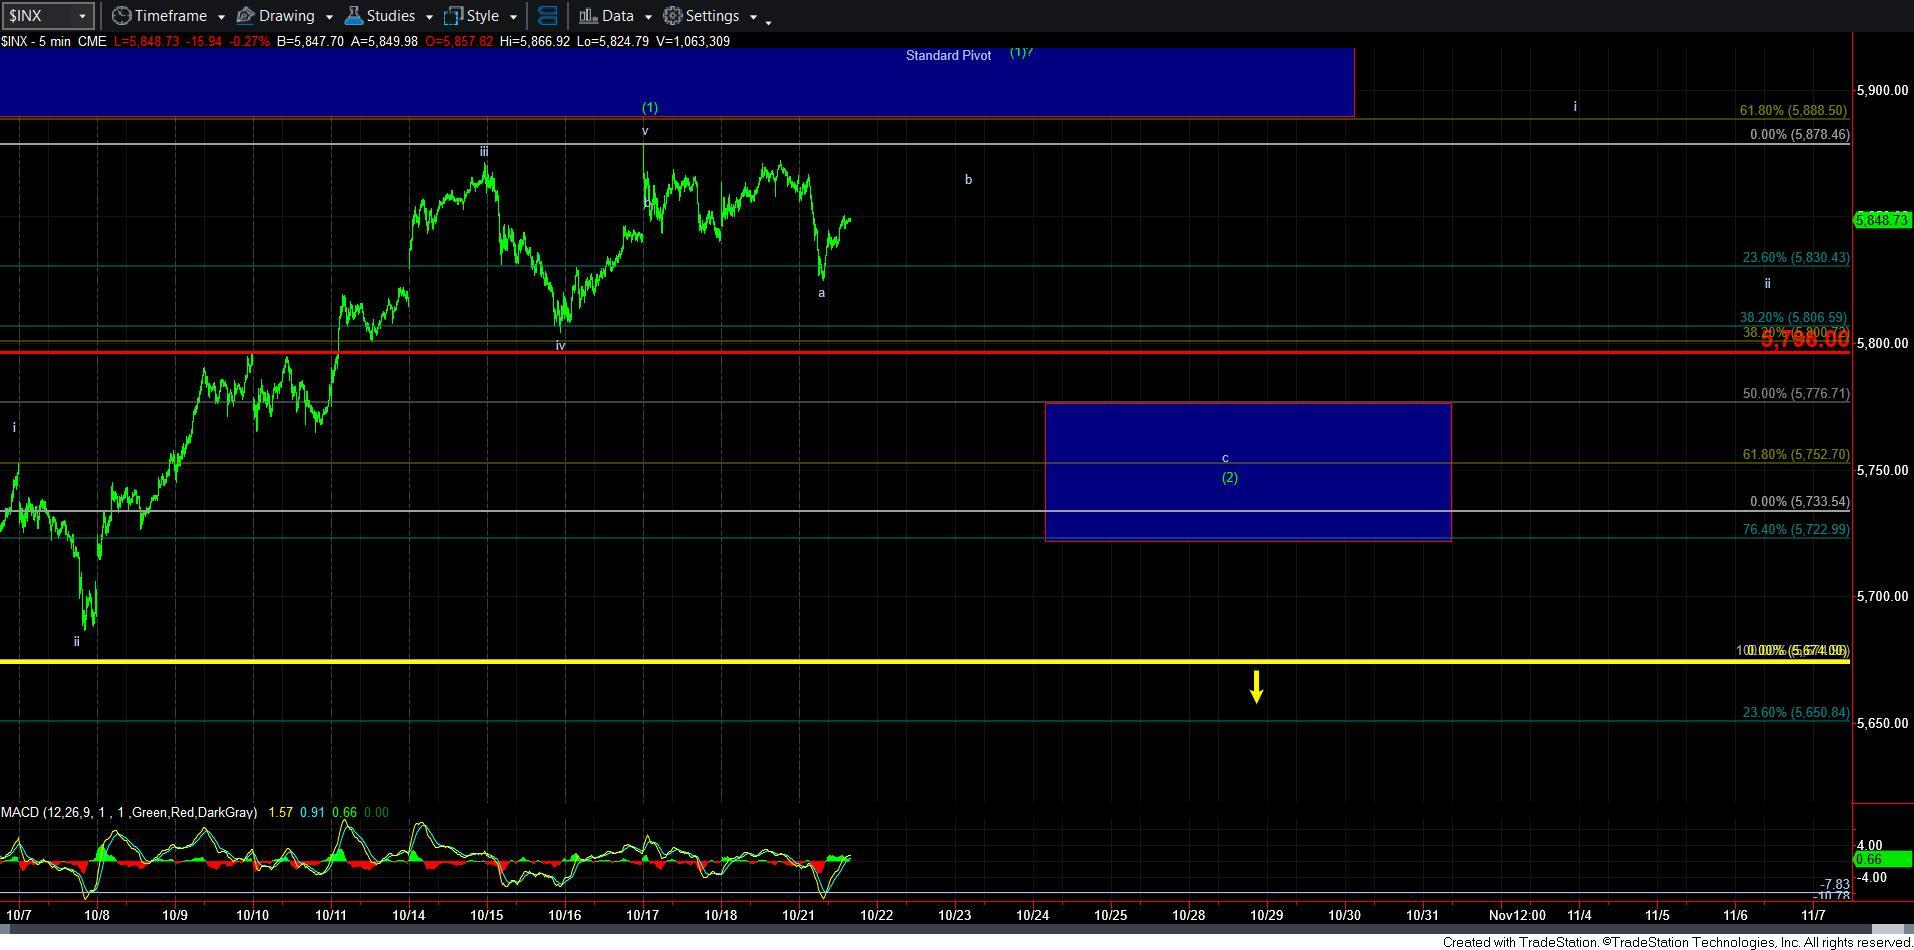
However, should the market see a sustained break down below the 5860ES region, then it makes it much more likely that we are already in the wave [2], as presented on the 5-minute SPX chart.
And, I will continue to reiterate the following point: Until the market actually breaks down below the 5674SPX level, we have to give the bulls the benefit of the doubt, and recognize the potential for this rally to take us north of 6000SPX in the coming weeks.
Lastly, for those that are seeking a high probability, lower risk entry point on the long-side, I penned the following alert to the live video members and the full-time members this morning:
“As I also outlined to the members of the live video service, the higher probability and lower risk entry for long trades would be to allow the market to provide us with a higher confidence (1)(2), i-ii structure, at which time you can buy the wave ii pullback and place your stop at the low of wave (2). But, the more aggressive ones amongst you can choose to buy initial positions during a wave (2) pullback and place stops around 5700SPX, as a break of that support would be an initial warning to bulls, with the break down below 5674SPX being a broken uptrend structure.”