Is The Rally Dead?
With so many seemingly giving up on the inverted heads and shoulders pattern due to the depth of this pullback, they have now turned immediately bearish. However, as we noted, that pattern was way too obvious (at least in my humble opinion), and when it is that obvious, it rarely works out as expected.
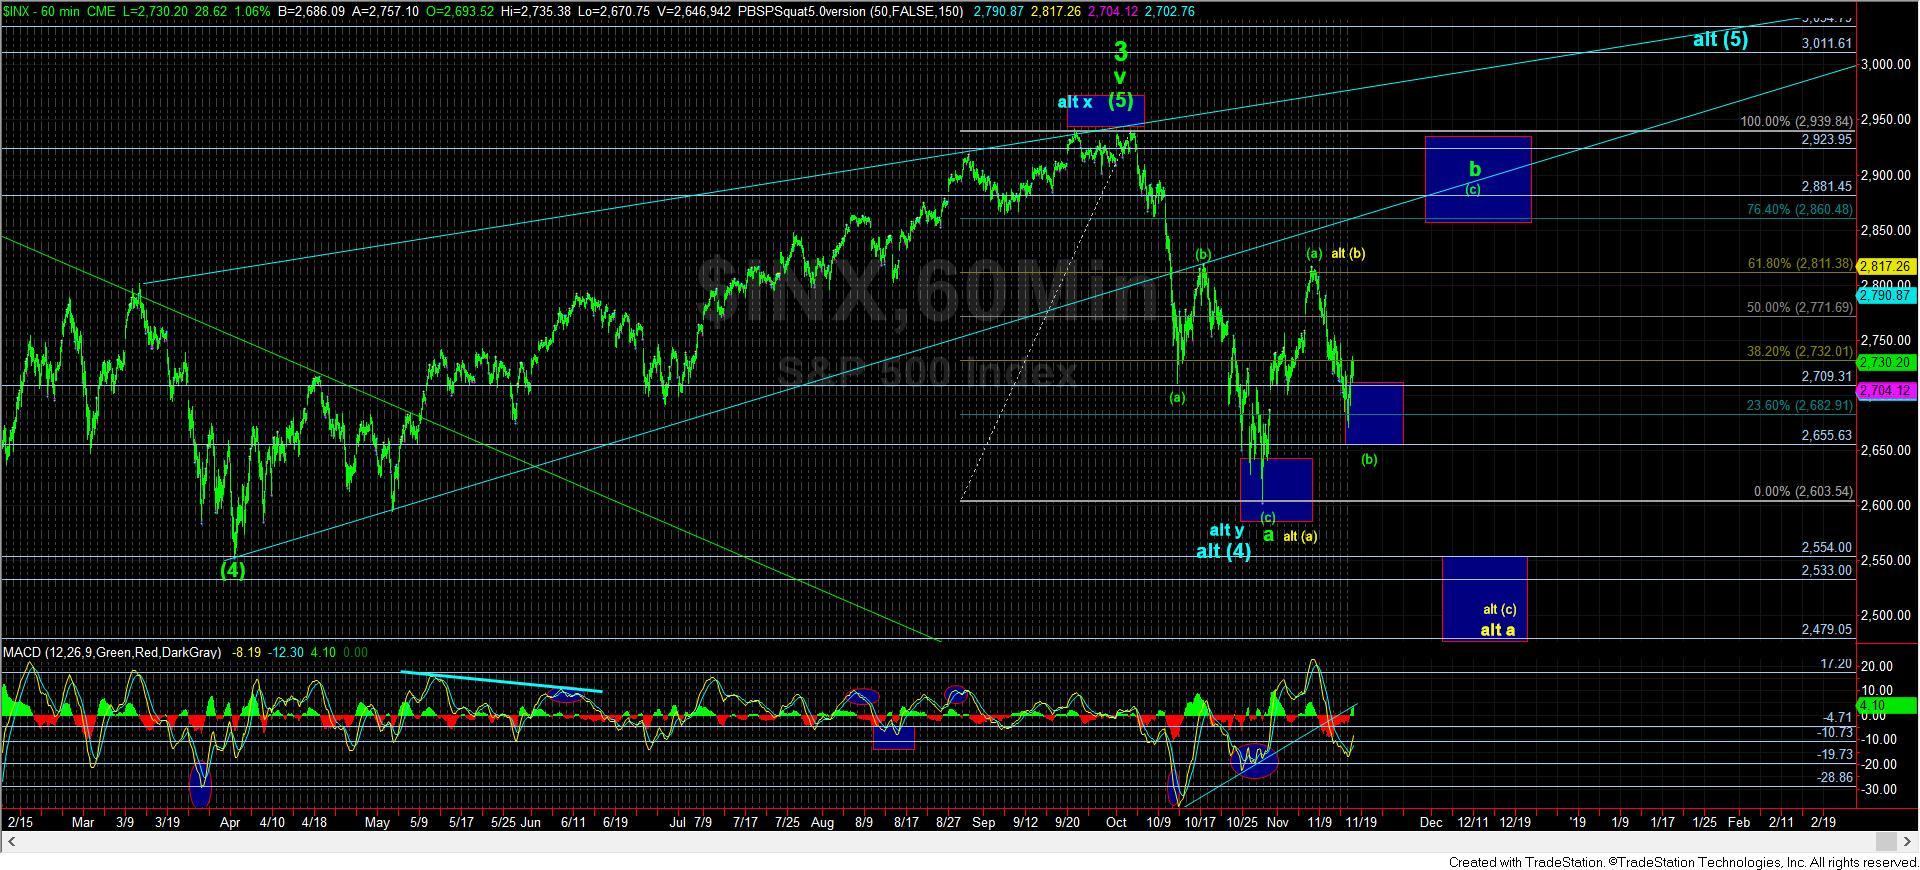
For anyone reading my analysis for the last month or so, you would know that I view the market as being treacherous. Moreover, I also view that the probabilities suggest we have begun wave 4, with an ideal target down in the 2100/2200SPX region. But, it will not be a direct move to that target.
You see, Elliott Wave analysis provides us with relatively accurate theoretical tools to identify a target for a 4th wave. And, I have outlined many times why I believe the 2100/2200SPX region presents us with the most probabilistic target. Yet, how we get down to that target is always the most difficult part of 4th wave action.
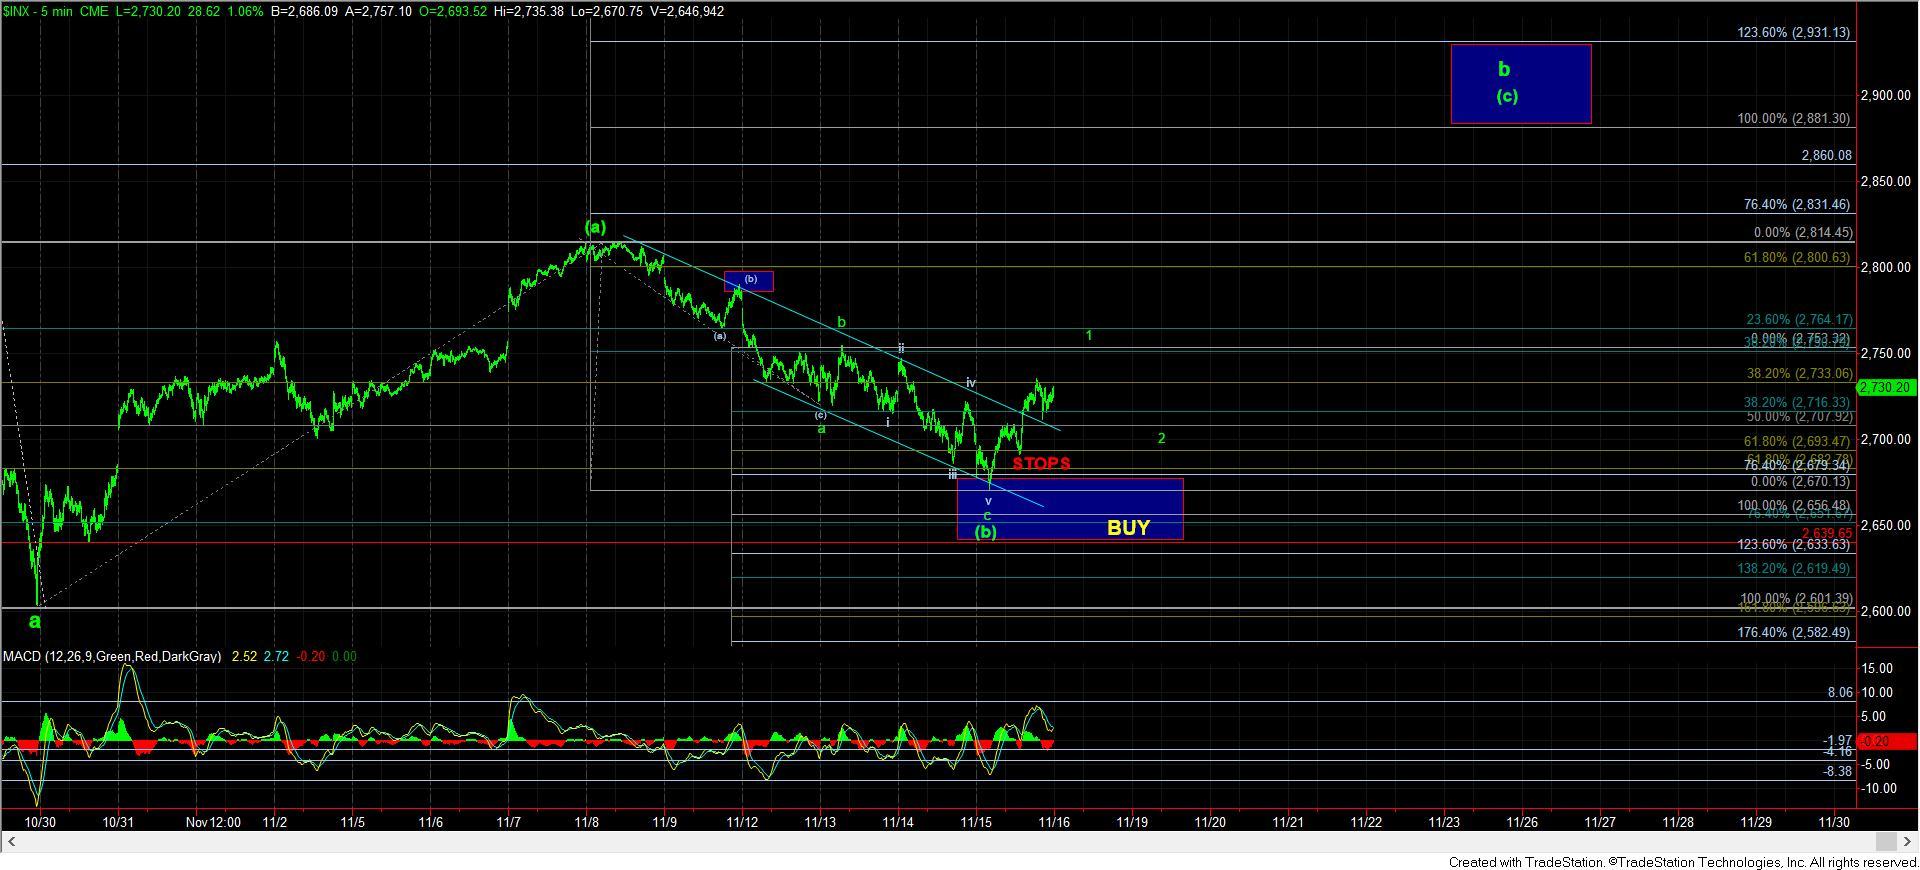
My primary expectation has been that this pullback is a (b) wave, within the b-wave rally off the 2603SPX low struck the other week. However, we are now on the edge of that potential.
With the bottom we struck this morning, the market has enough waves in place to consider the a-b-c structure within the (b) wave as completed, which I posted in an alert as we were striking the lows today. However, what we also need to see is a 5 wave rally off that low to suggest that the (c) wave rally has begun. Thus far, we have not gotten the initial 5 waves up off the lows. And, even if we do, it will likely only be as a leading diagonal – which still needs a move up towards the 2750SPX region to complete wave 1 of (c).
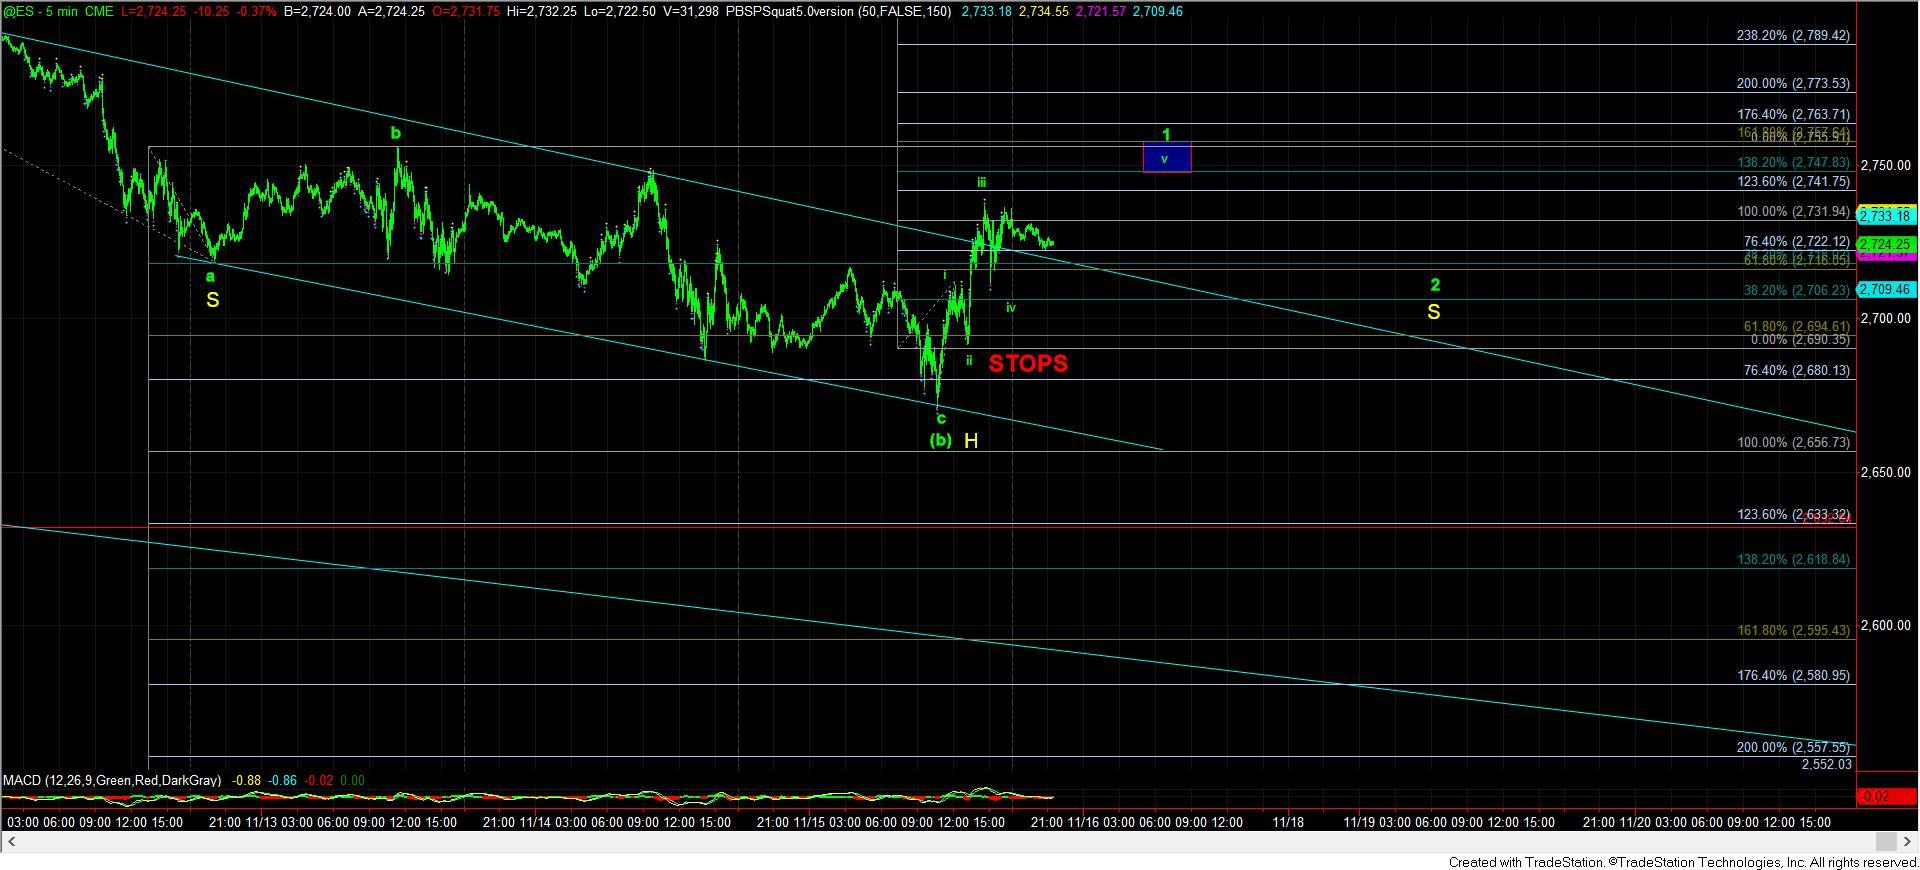
From the more cautious side of considerations about the market, due to how high the market rallied today, it makes it less likely that the 2655SPX support will hold if we break down from the highs struck today. Most specifically, I have suggested those that are trading long use the 2690ES level as their primary support for a (c) wave rally. You see, if the market is unable to complete a 5th wave in this leading diagonal, as outlined on the 5-minute ES chart, and breaks down below the 2690ES level, it will most likely test the 2655SPX region of support. Moreover, I think the chances of 2655SPX holding on another drop is getting less likely, and a break of the 2655 region can point us down at least 100 points lower in the yellow alternative count on the 60-minute chart.
For this reason, I want to repeat that I think one can use the 2690ES region as the support for which they set stops on their long positions. A break of that region will likely take us down at least another 35 points, and potentially much more. While you can always get back into the market should 2655SPX hold, you must constantly remember that capital preservation should be your primary concern if you are attempting to trade in a 4th wave structure. Too many traders give up a significant amount of profit earned during from the 3rd wave while trying to trade the “chop” inherent in a 4th wave. Do not be one of them.
So, ideally I would like to see a gap up tomorrow towards the 2750ES region. But, should the night monkeys take us down overnight, we still have a shot at the 2750 region tomorrow as long as we do not break below the 2705-10ES region. A drop down to there can still be part of the wave iv in the leading diagonal. But, tomorrow should either provide us with that higher move towards 2750, or else we run the risk of a bigger break down, as outlined above.