Is The Pain For Longs Over?
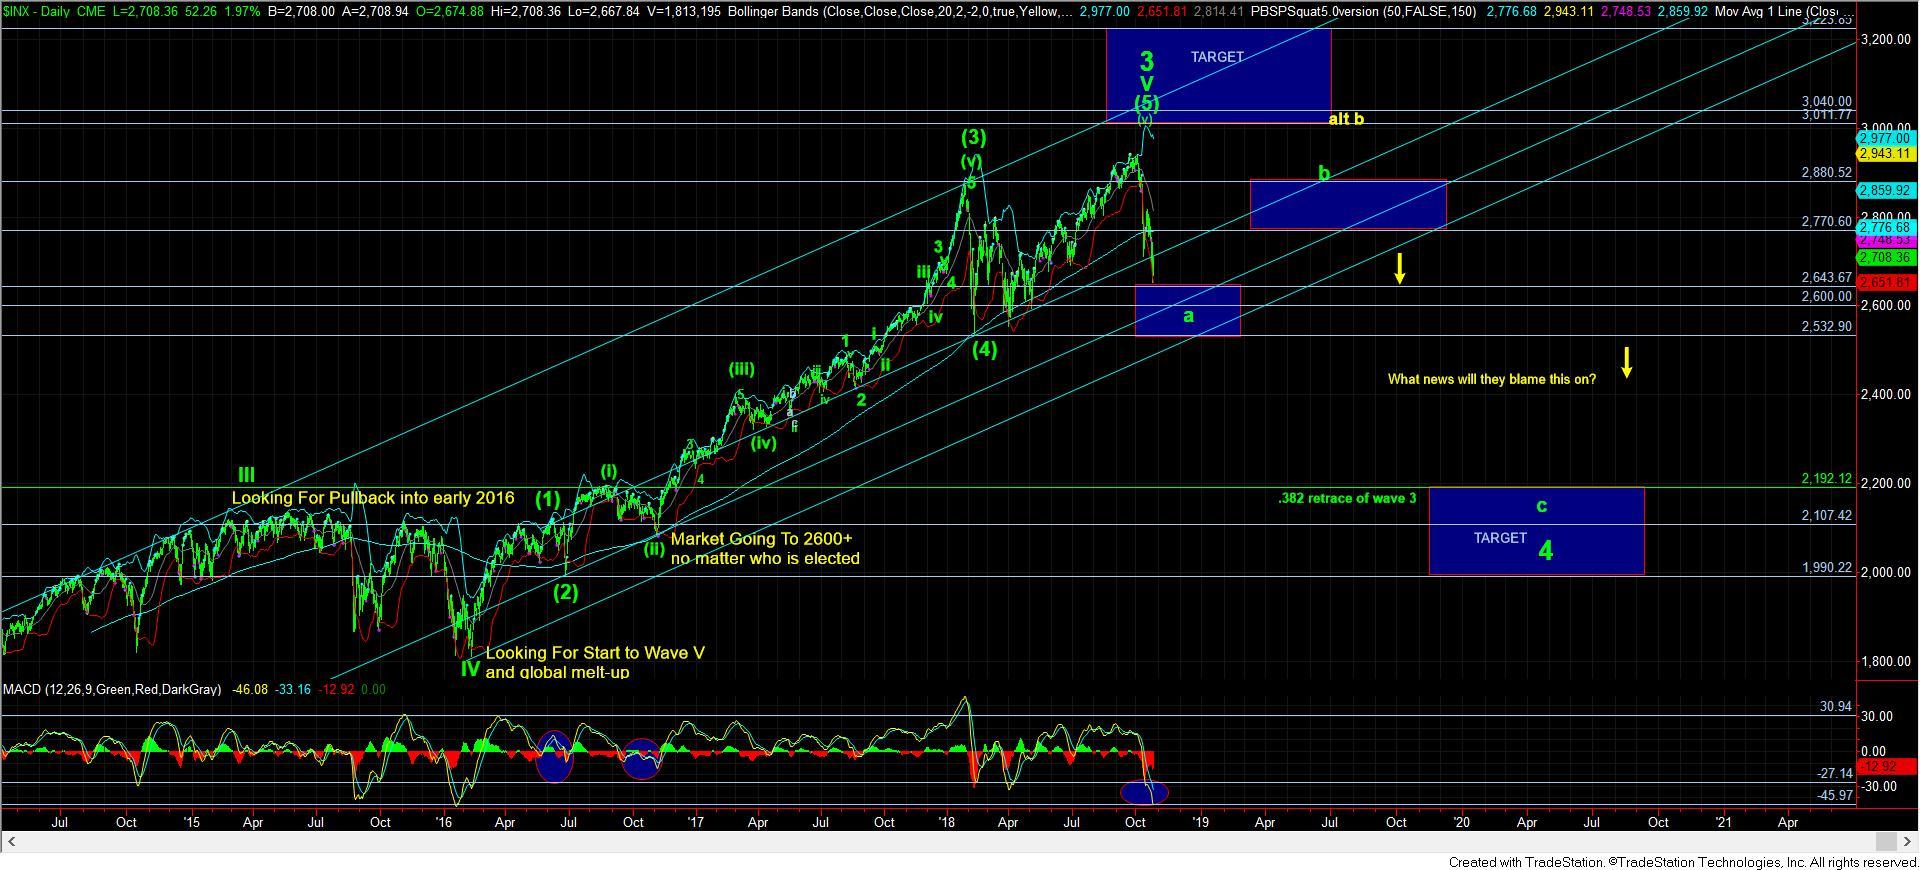
Well, to be honest, that is quite a loaded question I asked in the title, especially since I expect that we can head down to the 2200SPX region for wave 4.
But, in the short term, the question is if we are ready to begin a b-wave rally back up to 2800, and even potentially beyond?
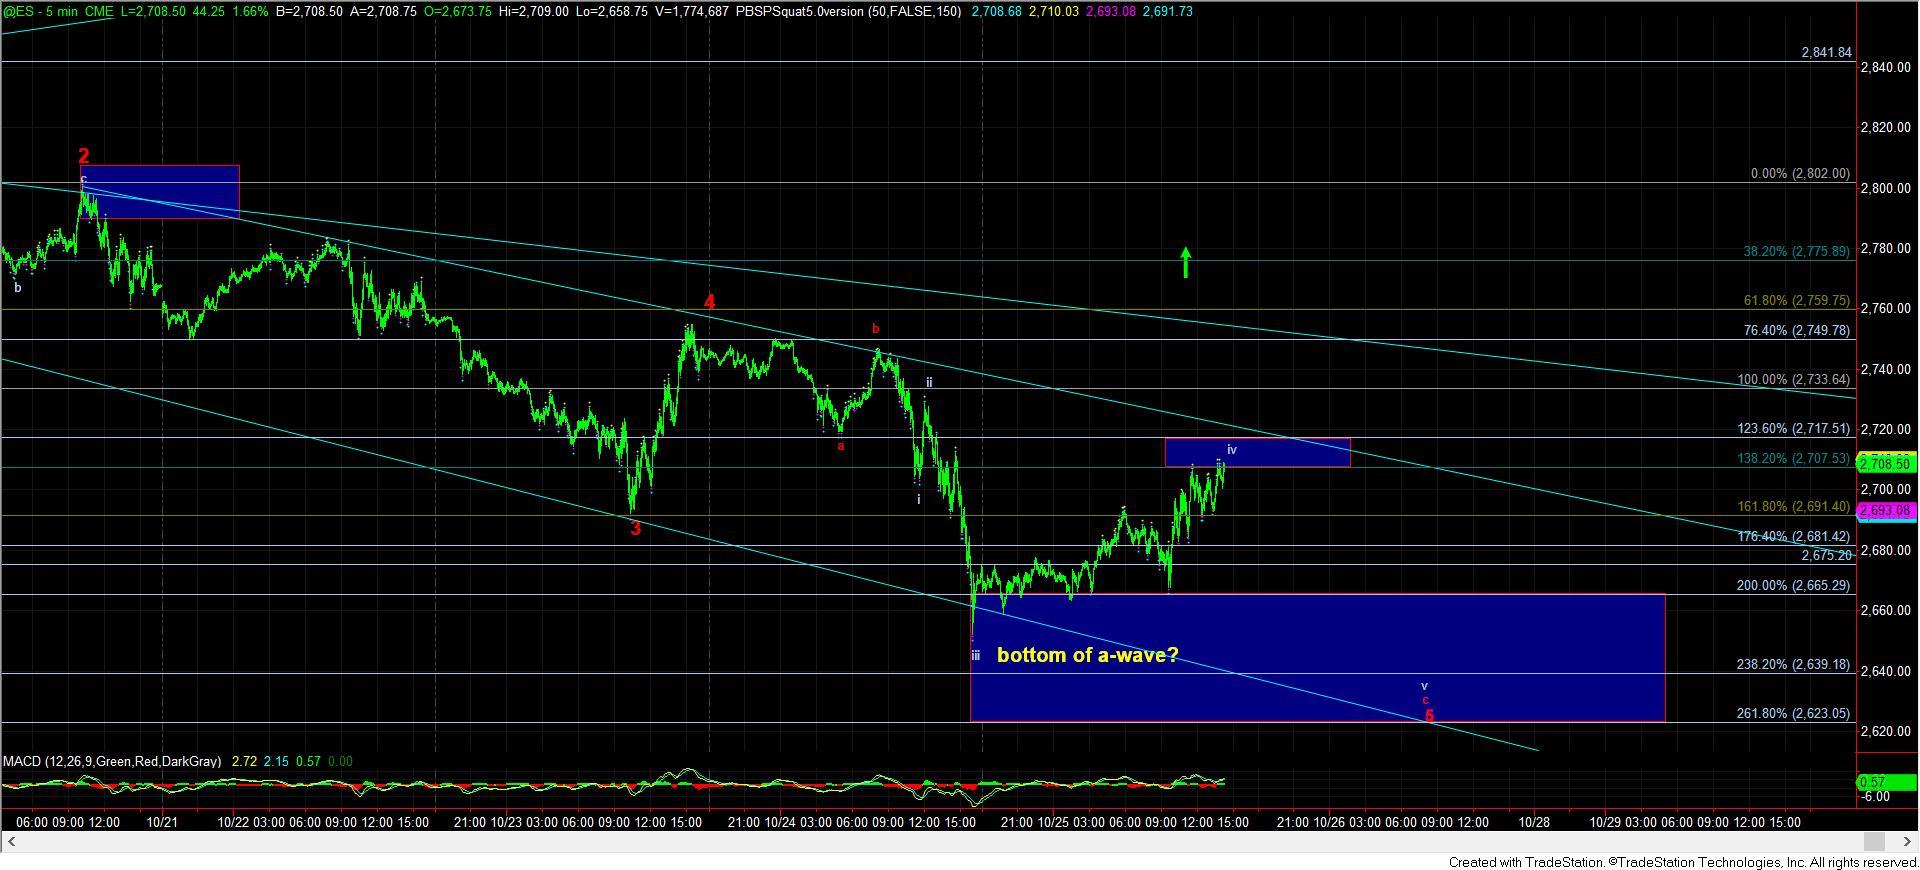
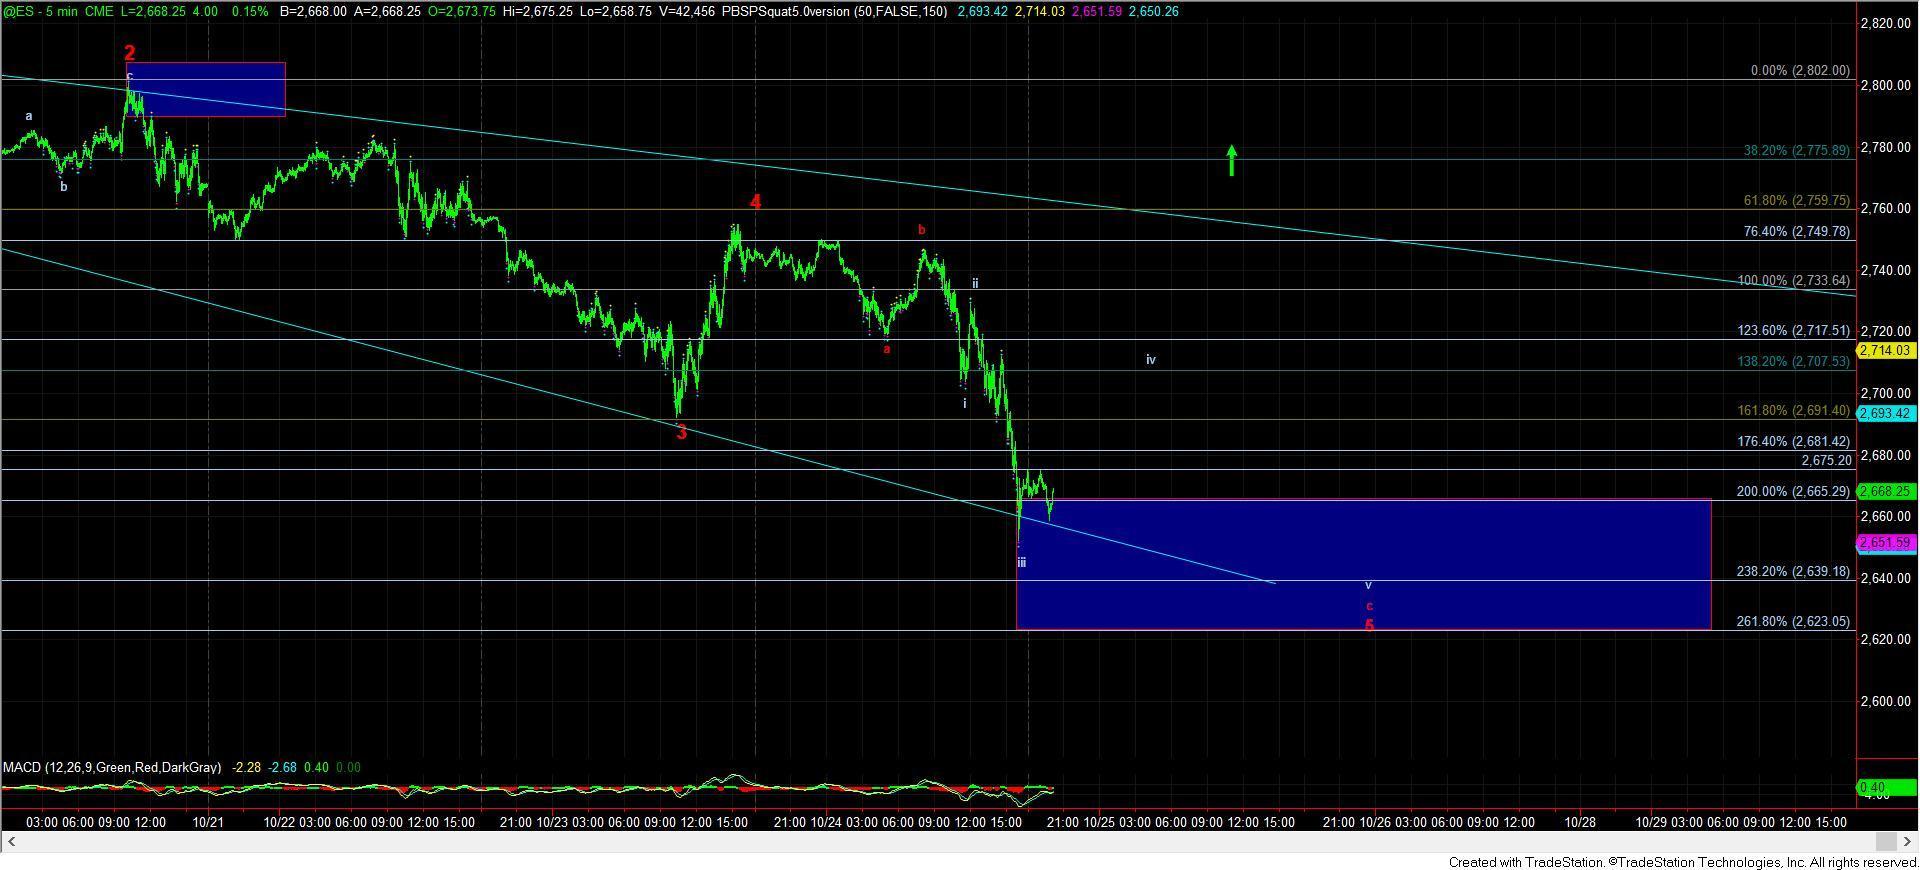
Overall, the market has done quite well in respecting the resistance levels we have been laying out throughout this decline, and continuing the decline from those resistance targets. For example, yesterday in the late afternoon, I posted the chart below showing a wave iv retrace from the 2652ES bottom region to the 2707-2714ES region, in what I expected would be a wave iv rally. Today, the market struck a high so far of 2709ES. So, again, the micro structures have been following through quite well, even though we are dealing with a complex structure.
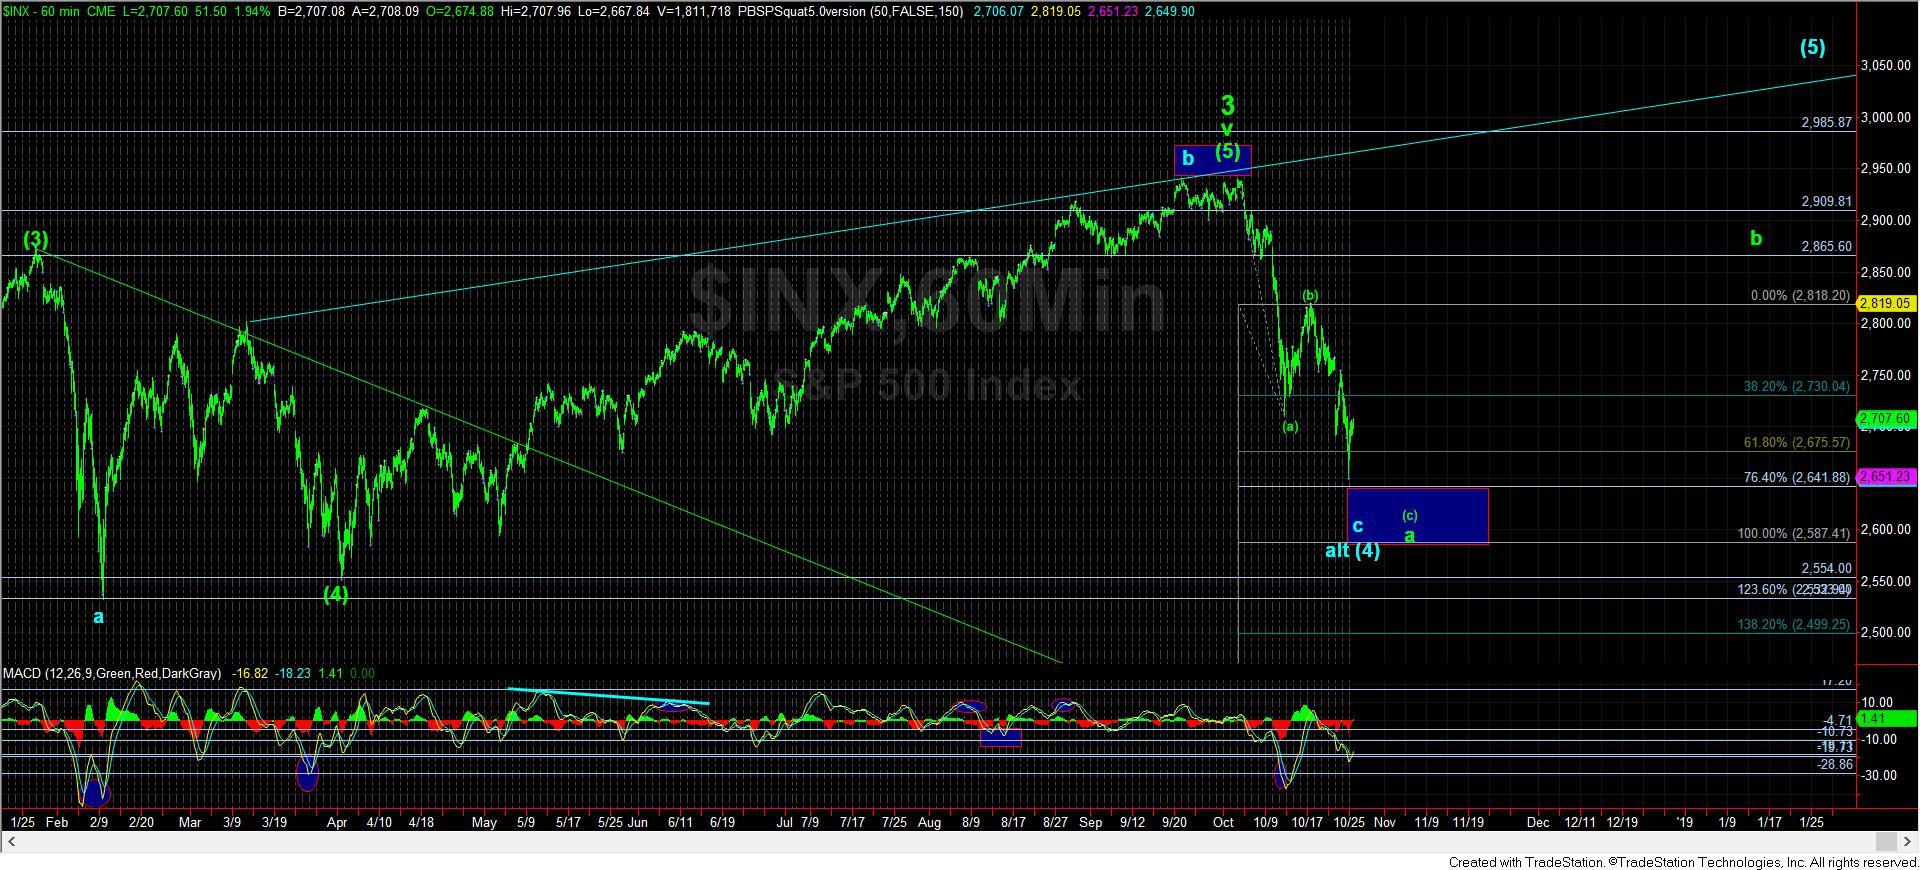
However, as Garrett has appropriately noted, we really have enough waves in place to consider the a-wave bottom as being in place. While I am looking for a more perfected 5 waves down in this ending diagonal for the (c) wave to strike at least the 2640SPX region, sometimes we don’t get that perfect structure, especially when dealing with larger degree corrective structures.
So, as long as we hold the resistance noted on my 5-minute ES chart, we can still drop again to complete a more protracted ending diagonal for the (c) wave of the a-wave. However, if we take out this resistance region, then it would suggest that we are likely in a b-wave rally.
Again, I want to remind you that the b-wave should take a significant amount of time, and may even take us back up as high as the 3011 region, as outlined in the weekend analysis:
Moreover, when the larger degree impulsive structure of the market comes short of its bullish target, we often see the b-wave of the ensuing correction provide us with an expanded corrective structure, wherein it stretches to a higher high to strike the target missed by the impulsive bullish move. So, I have added an alternative b-wave target in yellow on my daily chart.
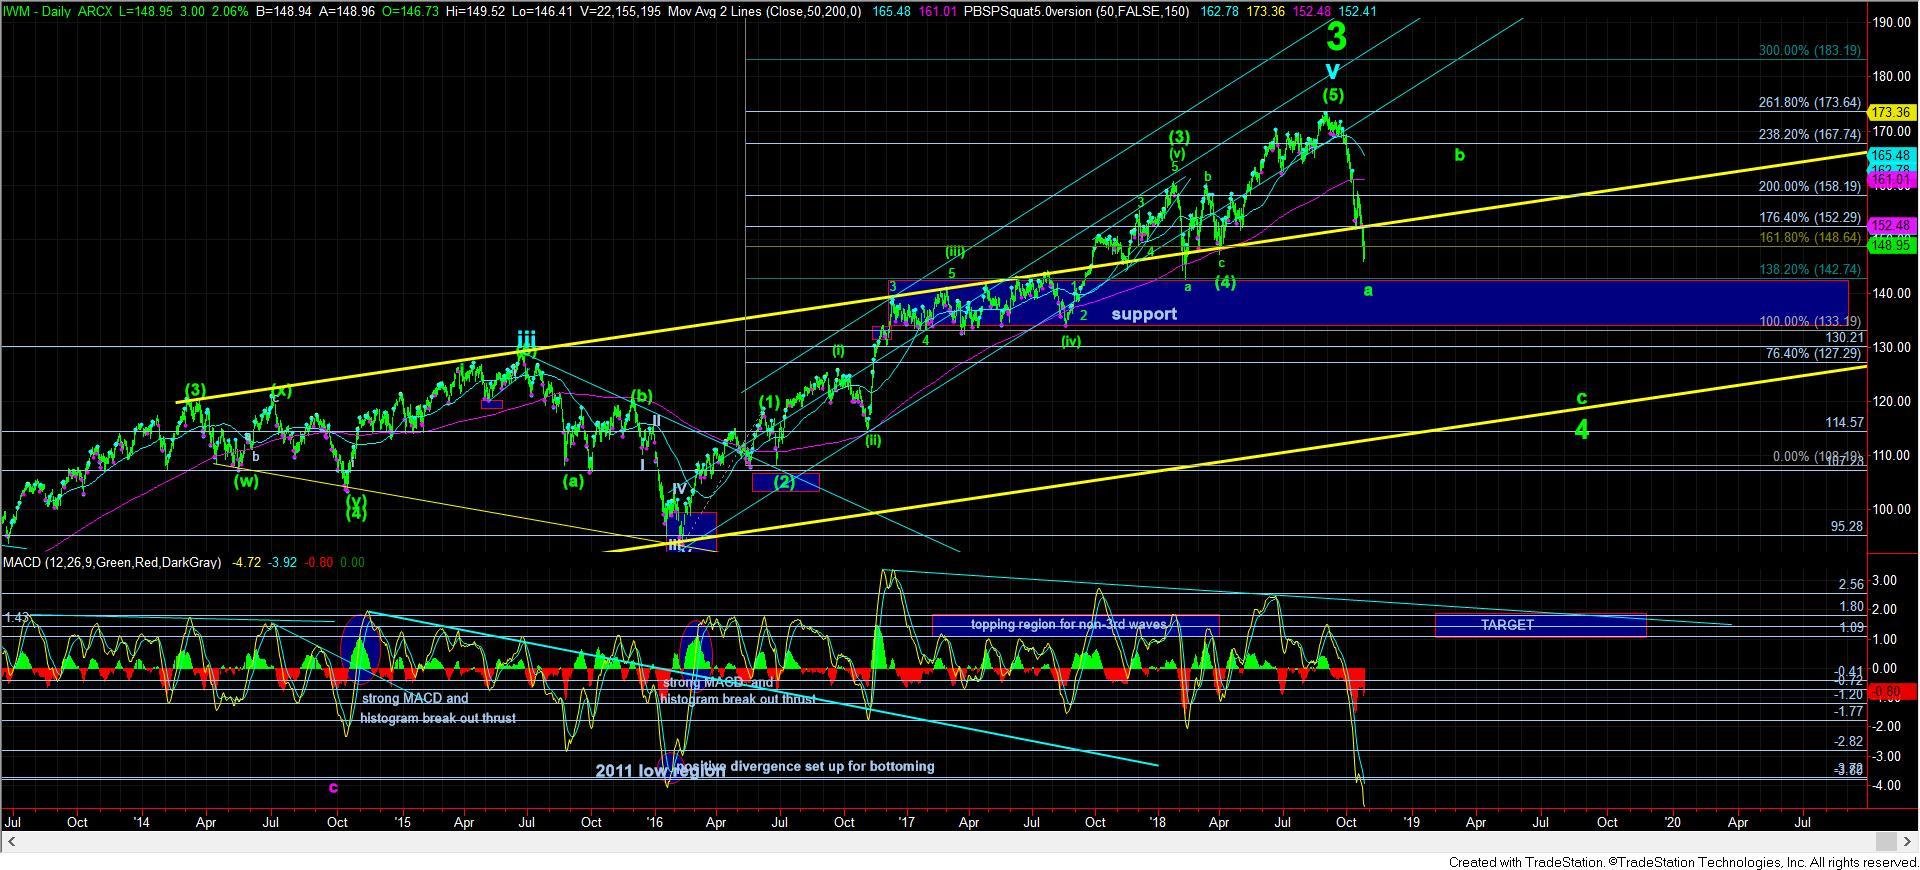
Additionally, I am including an IWM chart as well. As you can see from this daily IWM chart, we are now more oversold than we were in 2016 and 2011. That is usually the hallmark of an a-wave. Therefore, I am going to expect enough time and enough of a rally to bring that MACD back up to the target region noted at the bottom of the chart so that we can set up a positively divergent bottom when we complete the c-wave down. Again, that will take some time and likely provide us with a sizeable rally in the b-wave. And, that is why I think the SPX may even see a b-wave high in the 3011 region. While I cannot say it is a high probability at this time, I would say it is not an unreasonable target.
As many will certainly be pointing to a rally around the 2880SPX region to be a heads and shoulders pattern, and getting everyone bearish again, I think blowing past that and making new all-time highs in the SPX will get many bullish again which is the sentiment we need to sustain a c-wave down to the 2200 region as outlined.
So, for now, we are looking for confirmation of the completion of the a-wave of 4. And, while there are other alternatives we are tracking, should anything change, I will certainly alert you.