Is The Market Lulling You To Sleep?
With all the overlapping action whipsawing market participants from bullish to bearish and back again day by day, the market has certainly not made it easy over the last several weeks. But, this is exactly what corrective action does. And, understanding that we are dealing with corrective action allows us to take a step back and understand that it is not a time to be aggressive while the market completes it corrective structure.
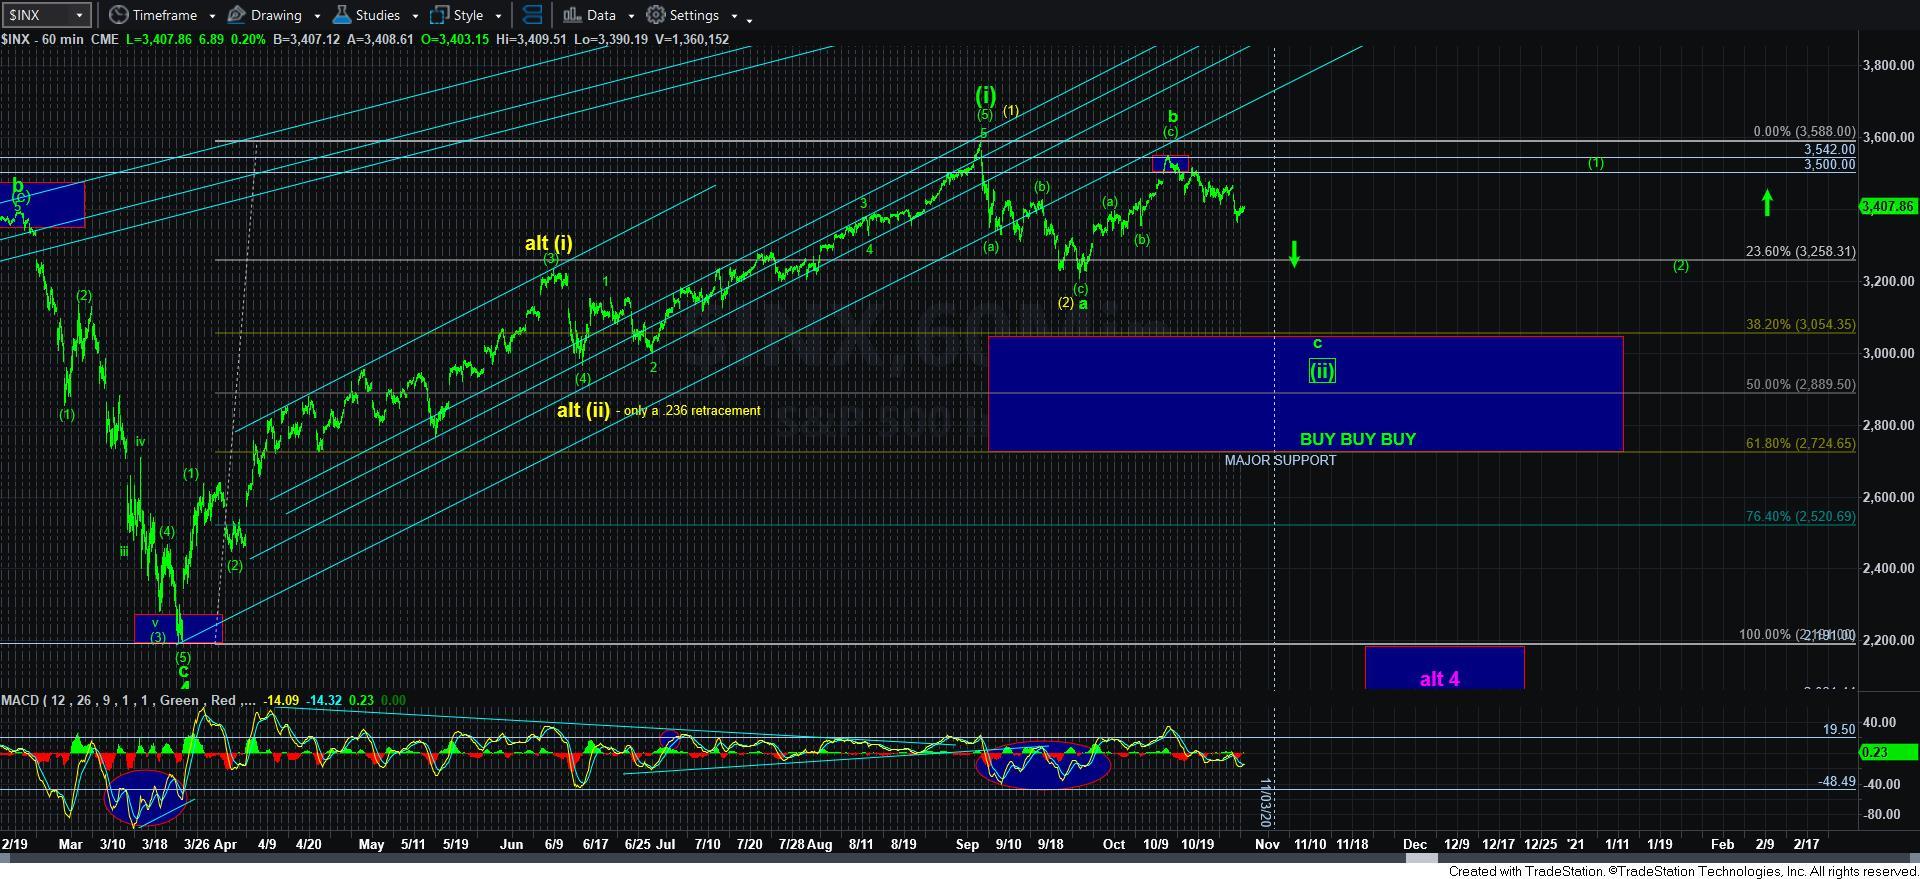
So, I would like to take a minute and explain something about diagonals. The diagonal typifies the whipsaw with which we are dealing over the last week or two. You see, after the nice run back up towards the 3550SPX region, many market participants began to be gripped by FOMO (fear of missing out), while we have been warning our members not to get too overly bullish just yet.
Since we topped in the 3550SPX region, the market has stair-stepped down in a very overlapping and whipsaw manner. I have been tracking this as a leading diagonal for wave 1 of the c-wave I am expecting to take us lower in the coming weeks. But, what the diagonal does is lull you to sleep. It makes you believe that this “pullback” is corrective in nature, and possibly setting us up to next rally over the 3550SPX region in the very near term.
But, I want to warn you not to be fooled by this action. While the leading diagonal does display the properties and structure of a corrective pullback, it is actually quite evil in its intent. Consider that the drop has been very corrective looking, and, after a diagonal down completes, we often see a strong rally that retraces a significant part of the initial diagonal structure to the downside. So, it makes you believe that it is a corrective pullback, and then charges higher quite strongly, making you believe even further than we are certainly heading higher. This is why a leading diagonal is so dangerous, and often lulls you into a false sense of security, right before it turns the other way in dramatic fashion.
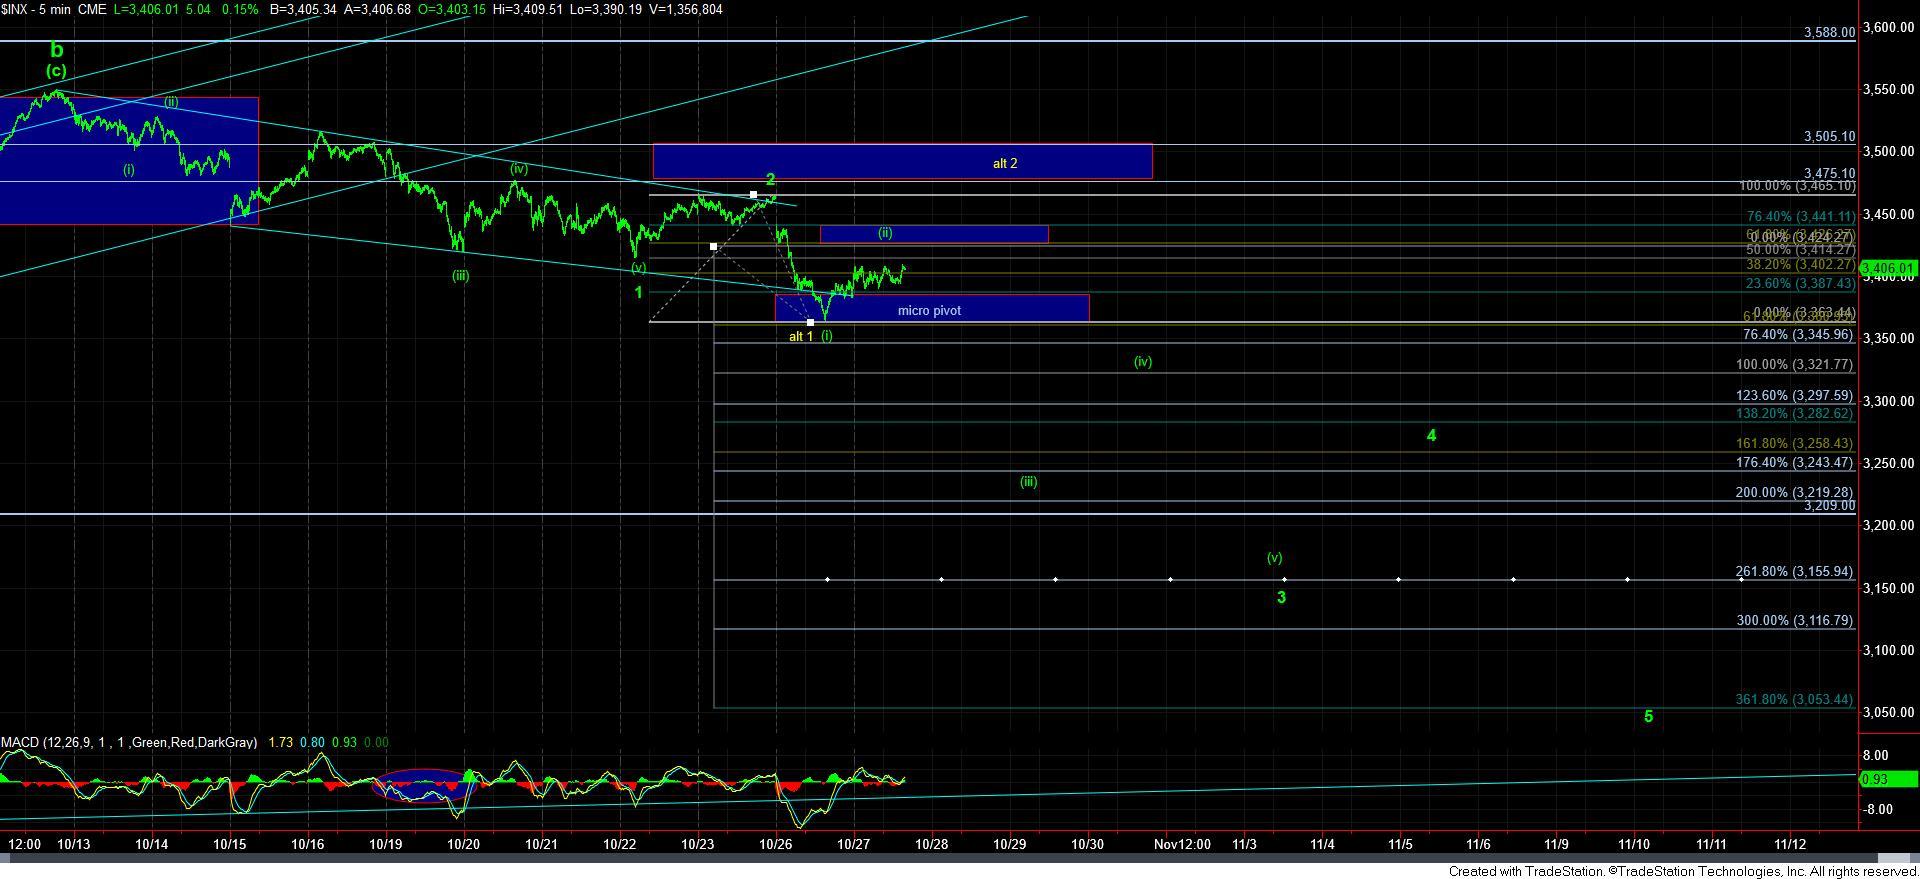
So, if I am correct in my assessment, we had a leading diagonal which has already completed wave 1 down in the c-wave of wave [ii] we are tracking. Now, I have to admit that the corrective retrace that I am now counting as a wave 2 was quite disappointing relative to the deep retracements we ordinarily see after a diagonal completes. But, thus far, I have no reason to question that wave count, since it fits quite well into the larger degree structure.
Assuming that the bottom we struck yesterday was the wave [i] of wave 3 of the c-wave down, the rally which began yesterday and is taking us through the day today seems to best be counted as a wave [ii] in wave 3.
Therefore, if this set up is correct, then the market is still lulling us into a potential false sense of security which will make us believe that we are certainly heading much higher very soon. But, I want to caution you that if this set up triggers over the coming day or two, we could very well see a 2-3% down day once we break down below yesterday’s low. And, I am quite certain it will take most market participants by surprise since the “pullback” off the 3550SPX high we struck the other week “looks” corrective, or as some call it, a “bull-flag.”
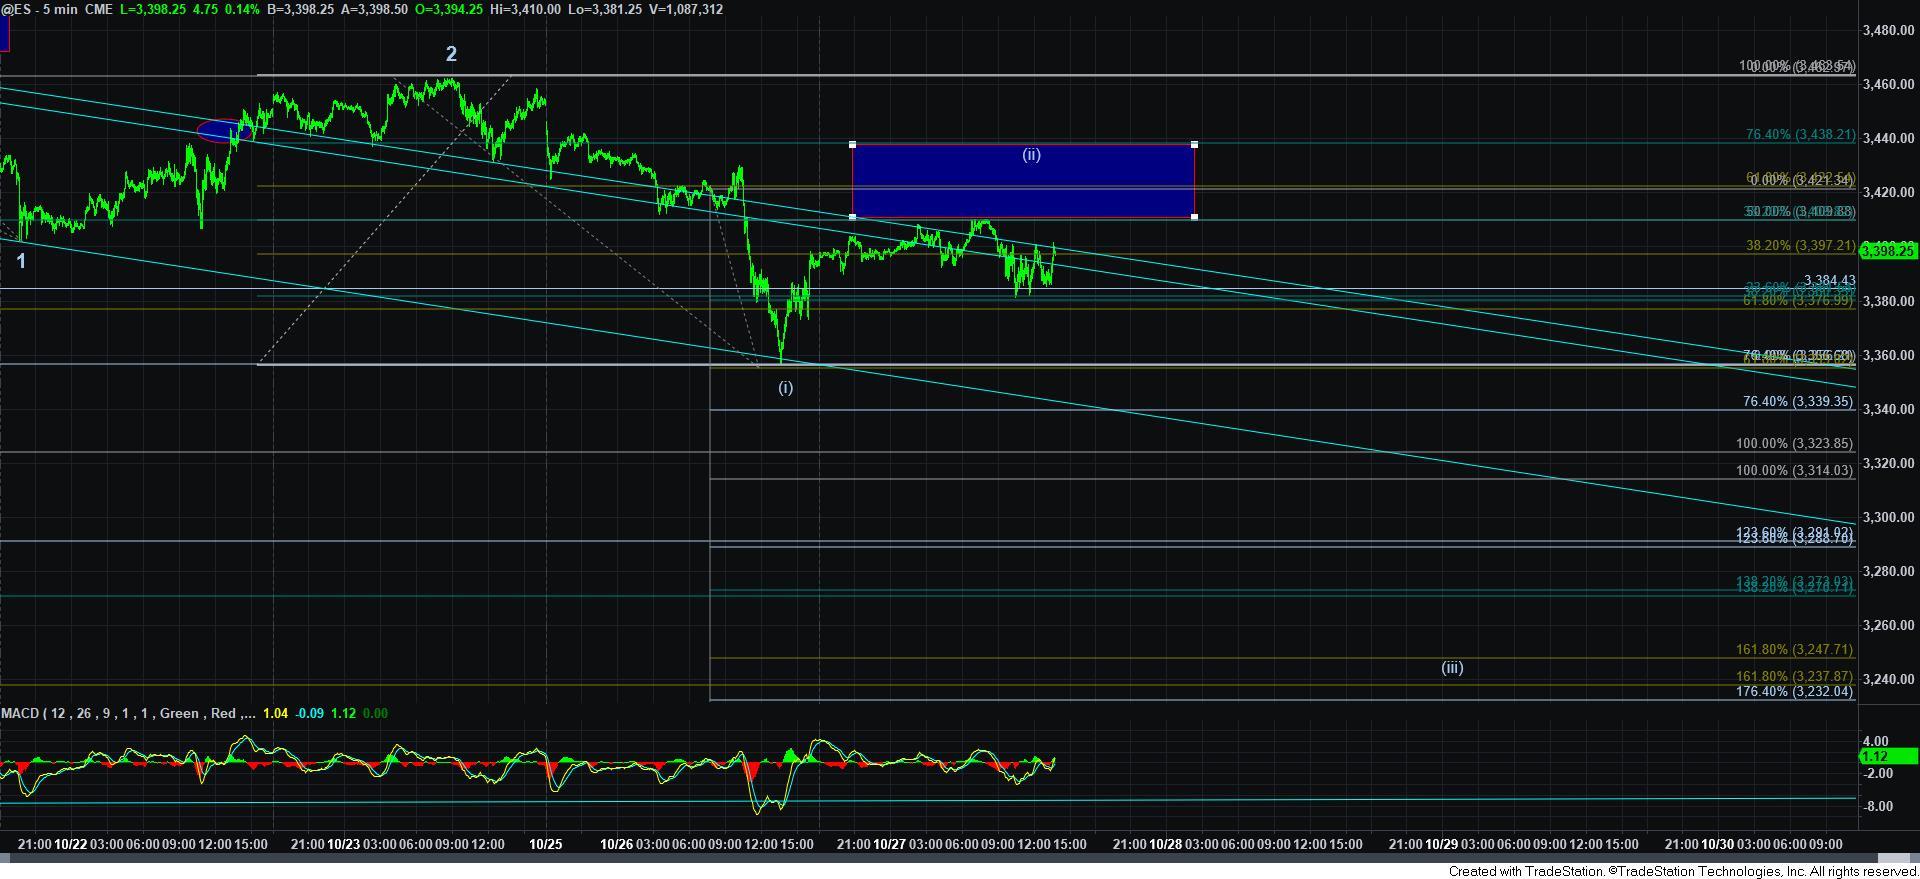
Therefore, as long as the market remains below immediate resistance, I want you to stay on high alert, because the next break down below yesterday’s low opens a trap door for market price, and signals we are likely going to be testing the 3220-3250SPX region in quick fashion for wave [iii] of 3 in this c-wave.
The applicable resistance box on the SPX for wave [ii] of 3 is as high as the 3441SPX region, as you can see from the attached 5-minute SPX chart. However, since the ES has a slightly different structure, I am going to suggest the main resistance level right now is the 3438ES region. That is the .764 retracement of the decline we completed yesterday in wave [i] of 3, and where we would have an a=c path if today’s action was a b-wave pullback in wave [ii]. But, I want to be clear that I would not necessarily expect or trade for that potential at this time, because once we have a set up for a heart of a 3rd wave to take hold, it is not something I would consider counter-trading.
Alternatively, if the market is able to move beyond the 3438ES level, then I would move towards the alternative count I have presented in yellow, wherein we are actually within a wave 2 retracement of a bigger leading diagonal to the downside.
Now, I know many still want to retain a near term bullish bias based upon the structure, and other factors. Personally, I have no problem with that because the bigger picture is quite bullish as we look towards 2021. But, I would personally be hard-pressed to trade the long side in the near term when the market is showing us a potential set up for a 3rd wave down in a c-wave we have been expecting for some time. Remember, there is likely still PLENTY of room to the upside in this market over the coming two years. But, I think it is time to respect that the market may be suggesting to us that we can see a bigger pullback before that next major bullish phase begins in earnest.