Is That It?
Can that be all the pullback we get? Well, that depends on which charts you are looking at.
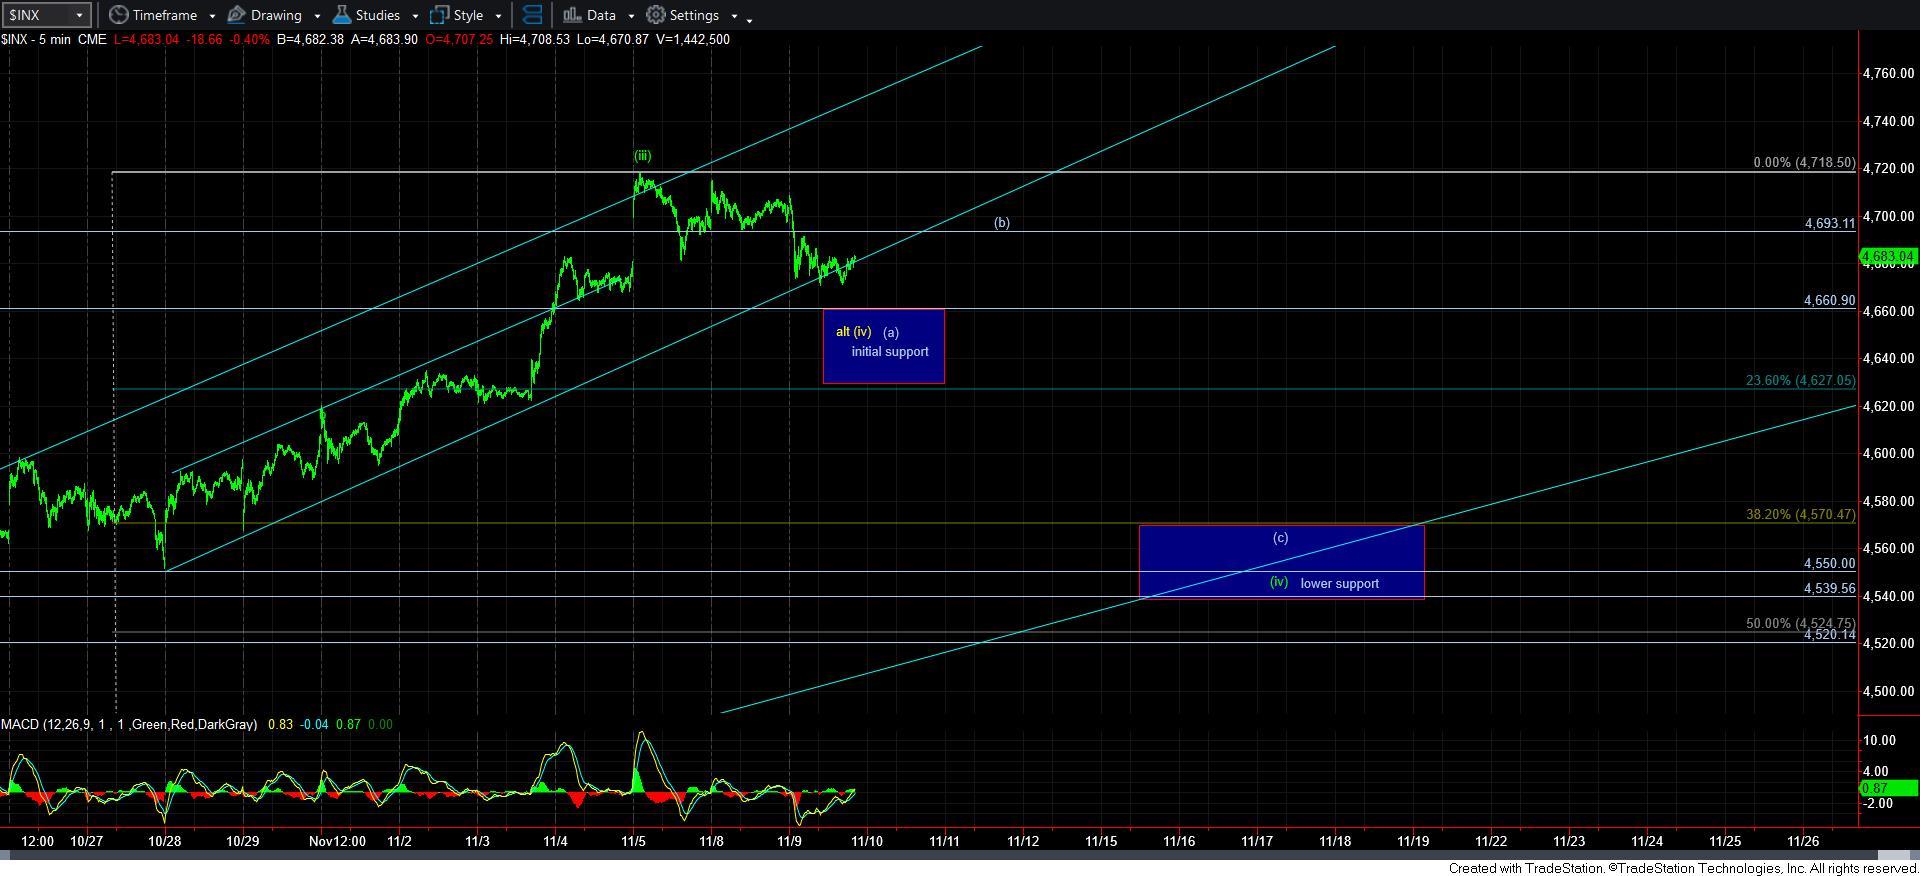
First, let’s consider what a standard 4th wave looks like. It is a 3-wave structure, which we count as a-b-c. Moreover, traditionally, it pulls back to the .382 retracement of the prior 3rd wave, and in lesser often circumstances, it only reaches the .236 retracement of the prior wave 3.
If you look at the 5-minute SPX chart, you will see that the .236 retracement is in the 4630SPX region. And, we have not even come close to that level yet. Lower, we have the .382 retracement in the 4570SPX region, which would really be an ideal target for this pullback.
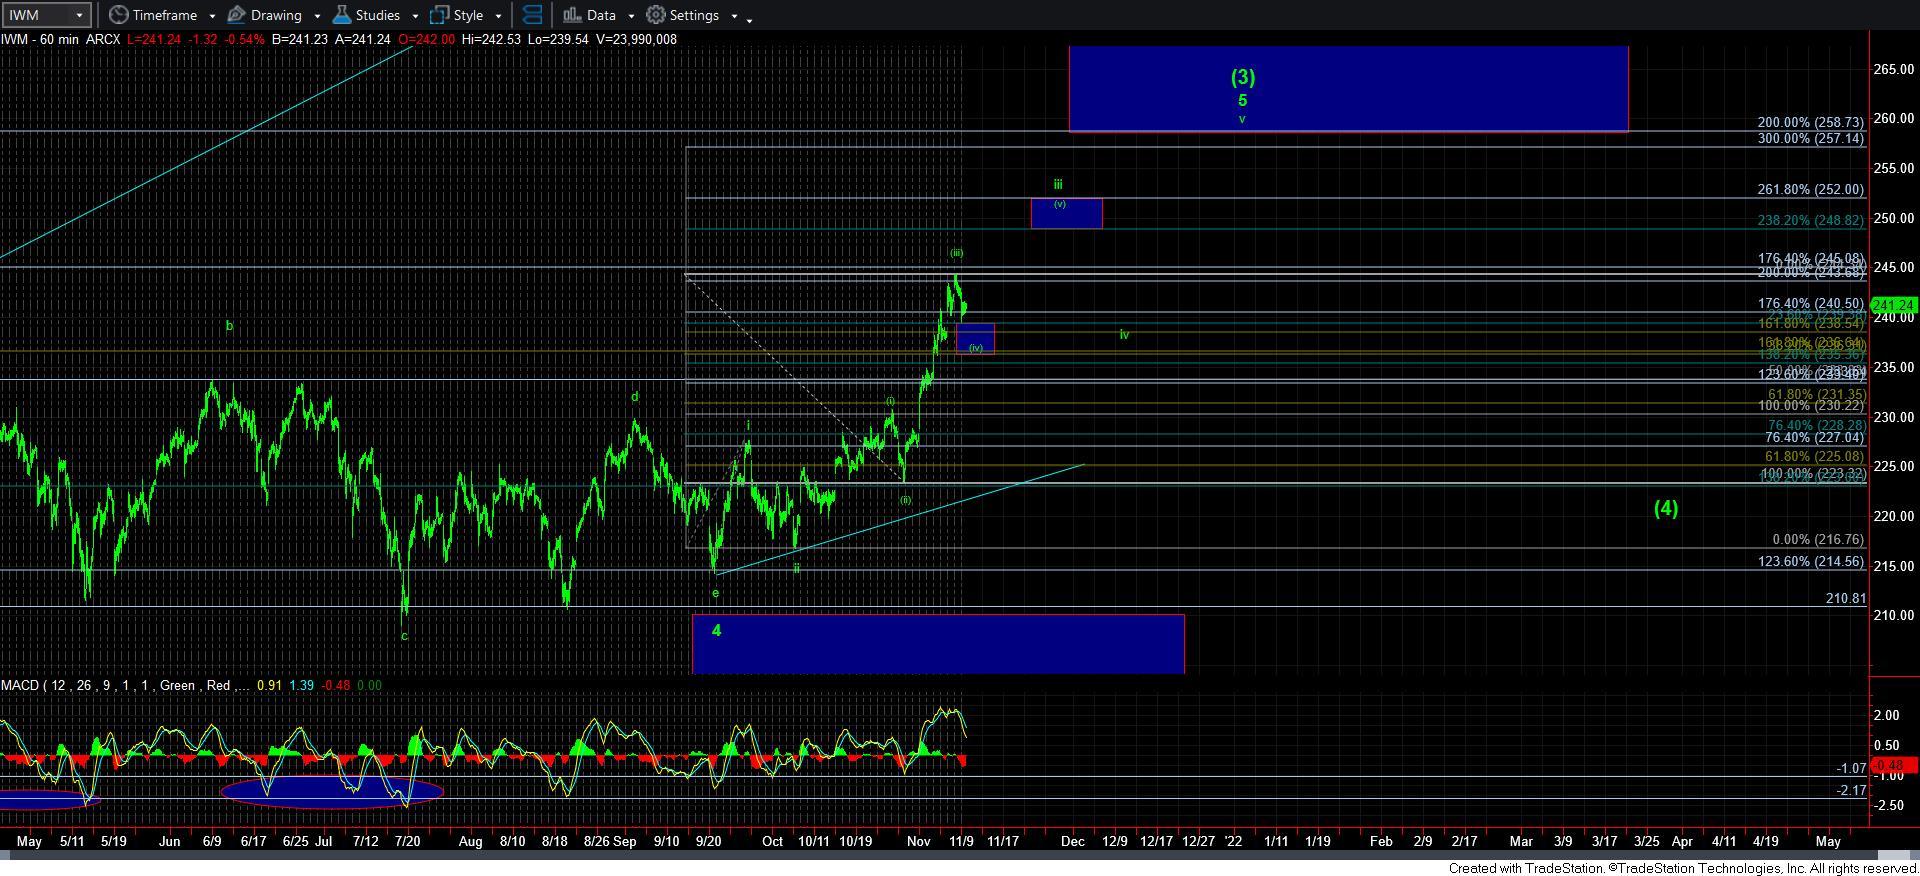
However, if we take a look at the IWM, we struck the .236 retracement of wave [iii] at today’s low.
So, how we do know if we are done with downside? Well, if we are going to see a 5-wave structure rally off a low in both the SPX and IWM, then it suggests that wave [iv] is done, and wave [v] has begun. Anything less than a clear 5-wave structure will keep us in this corrective action, as that would be a [b] wave rally within wave [iv].
Ultimately, this market is still likely going higher in the coming weeks. And, ideally, I still think we can see this wave [iv] pullback, in addition to wave iv once we complete wave iii. But, I wrote something this morning as an alert and I want to repost it this evening:
“I want to take a minute to outline what I am thinking about the next 4 months in the market. I will likely repeat this many times in the coming months.
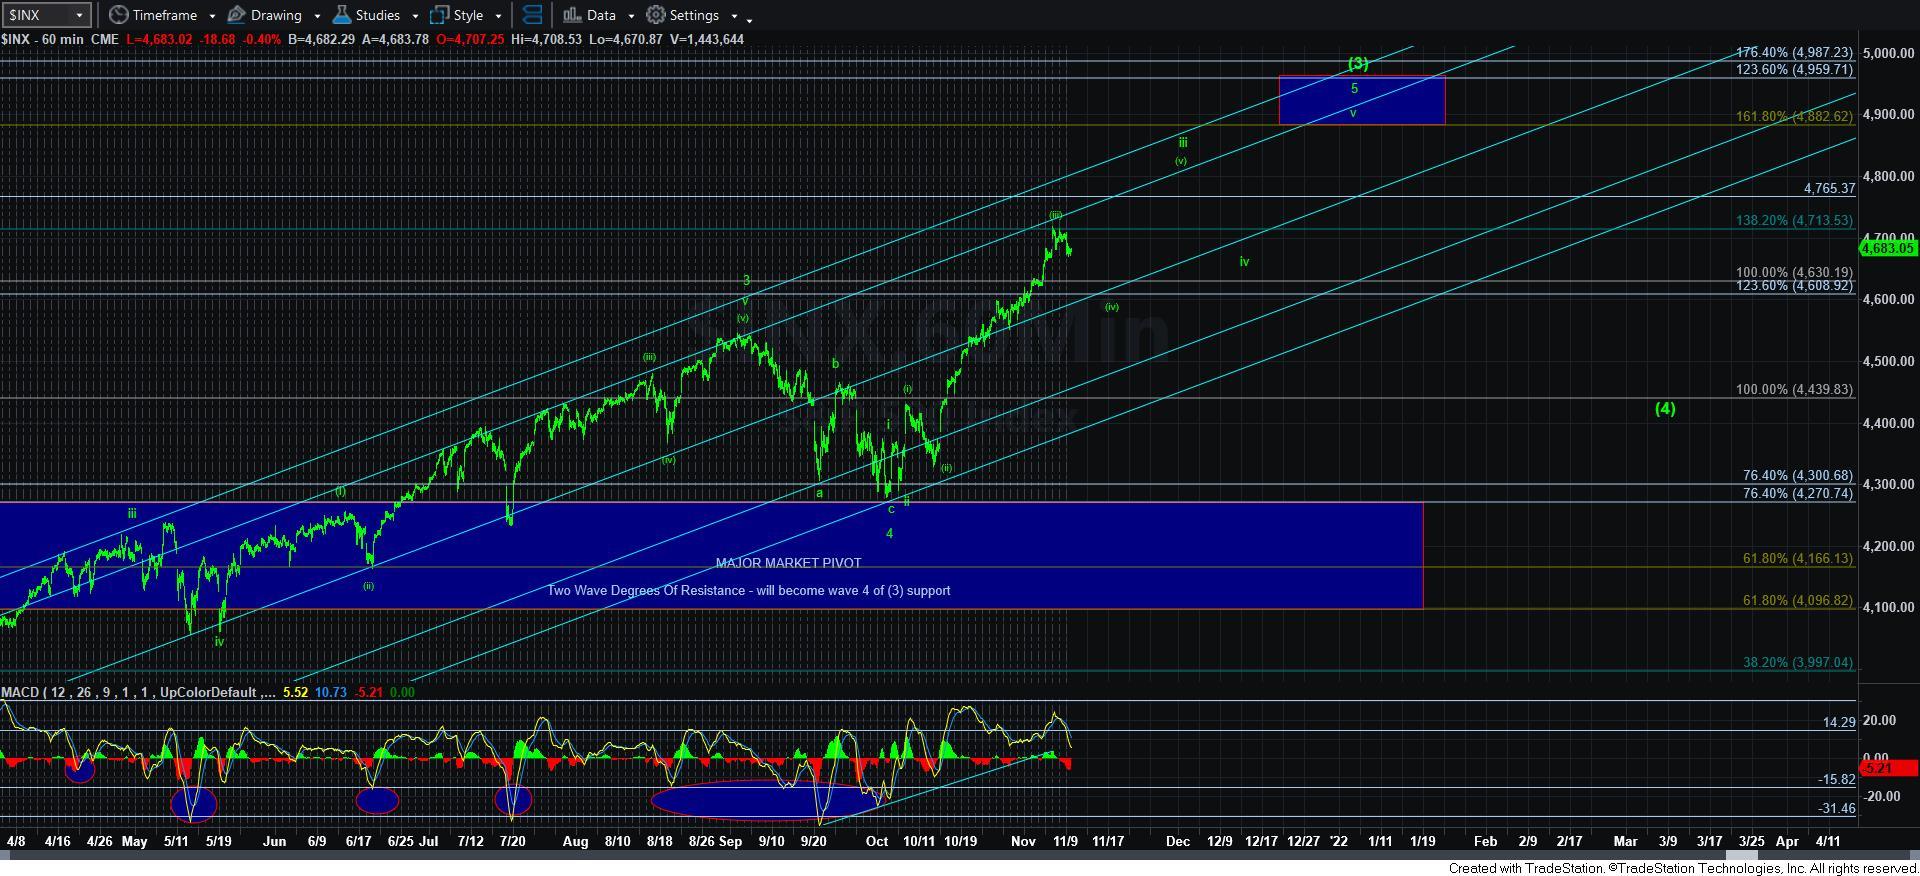
While the market has provided us with a massive extension, I am currently counting this as wave (iii) within wave iii of 5 of (3), as you can see from the chart. The problem with this is that it is entirely possible I am one degree off, and we are really in wave iii already. The straight up move does not lend to clarity on the micro structure.
But, the bigger degree structure suggests that the market can extend towards the 4900SPX region. The 4882 region is the 1.618 of waves (1) and (2), which is the typical target for wave (3), whereas the 4959SPX region represents the 1.236 extension of waves [i] and [ii] (one degree higher than waves (1) and (2)), and is a typical target for wave [3] of [iii] in the larger degree structure. So, both these points suggest that market should stretch to 4882+ in the coming weeks and months.
However, the point I am making is going to be the same point I made at 4270SPX when I started buying positions again. I noted that while there was still potential to go deeper into our support region, the upside potential far outweighs the downside potential. as we head to conclude wave iii, I will likely take the same posture on the long side, and begin de-risking in preparation for wave (4). There will be some potential that the top of wave iii may complete all of wave 5 of (3), and that will be my alternative when we get there.
So, I will begin planning accordingly in the coming weeks and wanted to put it out there for everyone to consider.”
Have a good evening.