Is It Pullback Time?
Well, the market spiked our resistance zone today, and was unable to follow through. And, as we see now, we may have the start of the pullback. However, just like yesterday’s drop came right now down to support and still rallied, I still want to see the larger support level to break before I am convinced that the bigger pullback is in progress.
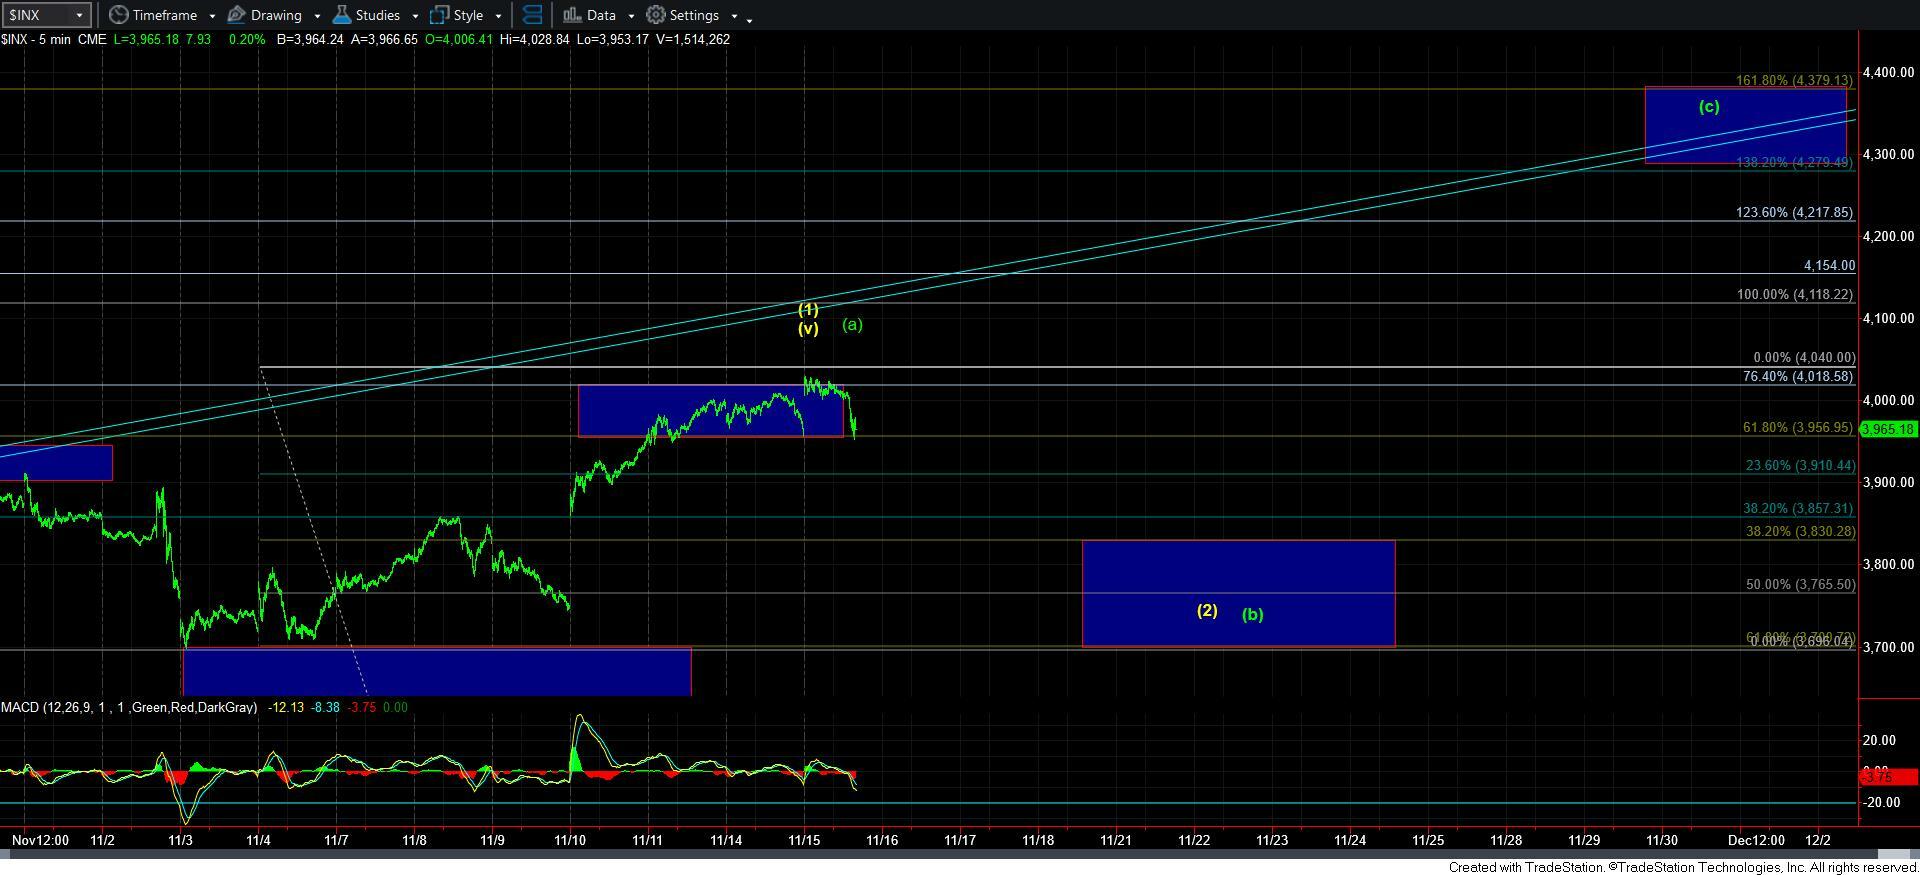
So, that means we still need to break down below 3895SPX to confirm that the pullback to the target box below is likely in progress.
Now, I may be making a mistake by taking it off right now, but you may note that I took off the 1-2 within the green [c] wave count. I will certainly bring it back if the market provides me further indications that I need to do so. But, for now, I have decided to go with the simplicity of the structure shown on the charts at this time.
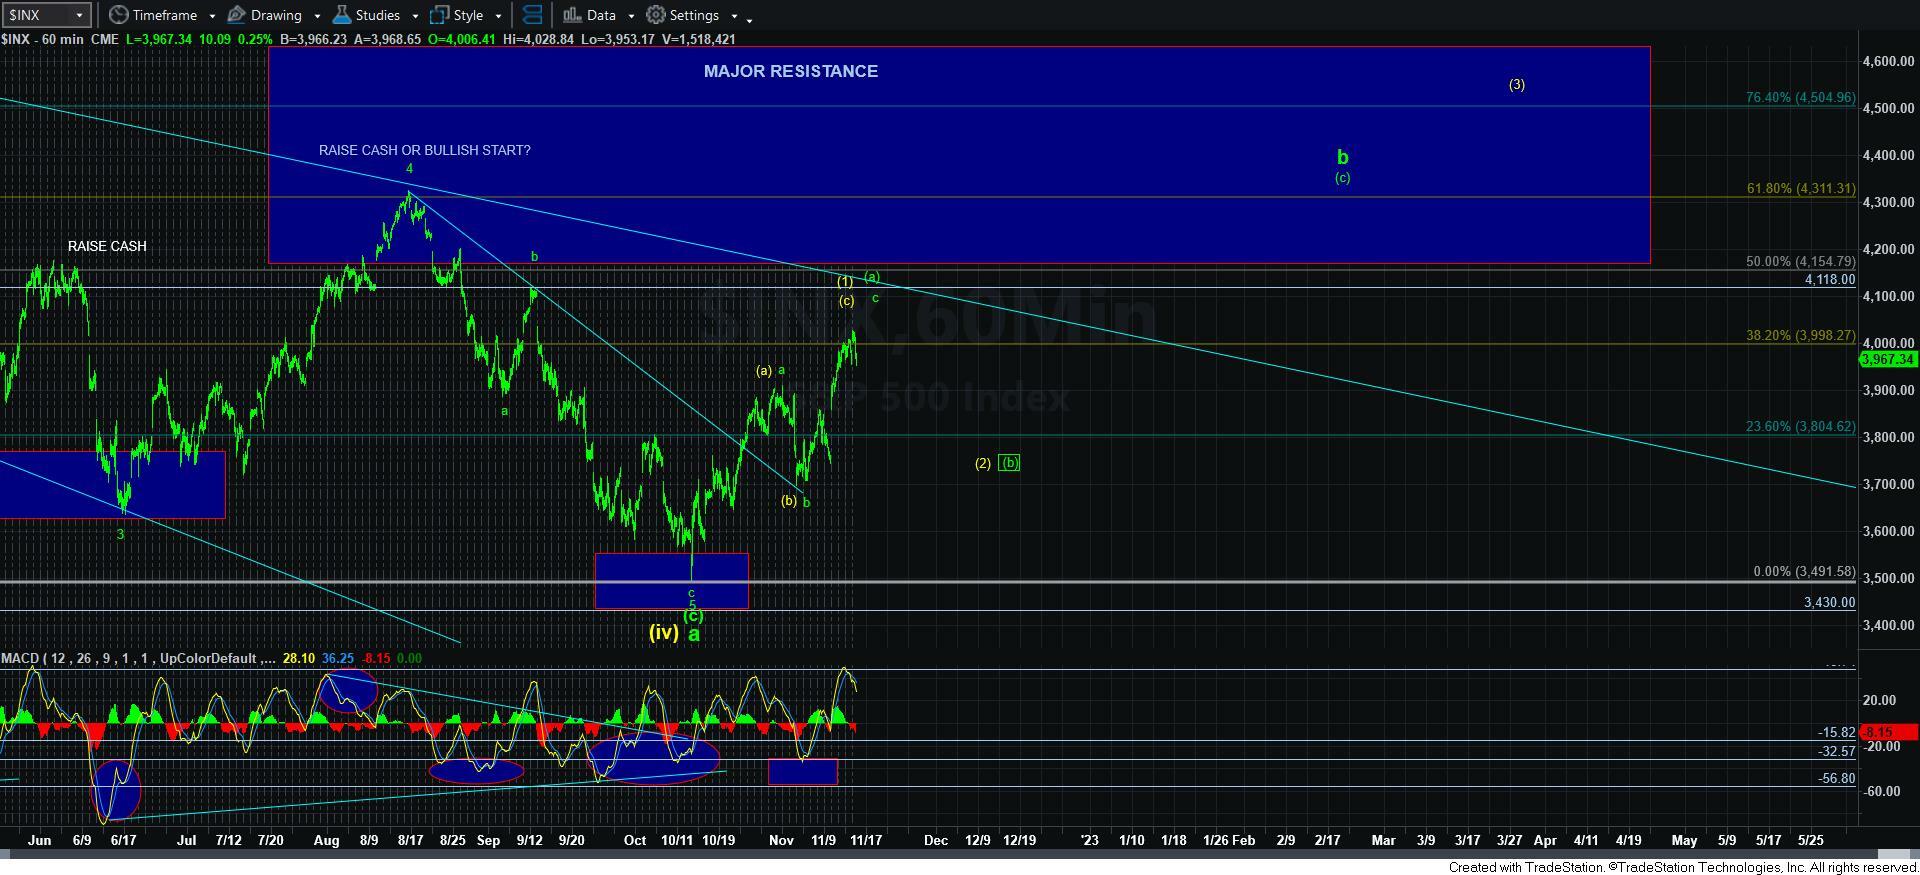
As it stands right now, I can still view the yellow count as a leading diagonal, assuming we see a corrective pullback soon, without going higher. But, should we rally higher to the 4118-4154SPX region before breaking down below 3895SPX, then I am going to have to assume the yellow count is an ending diagonal structure, with this rally simply being the wave [1] of that structure. And, I show how that potential would look on the 60-minute SPX chart, with wave [3] potentially taking us well north of 4300, and potentially up into the 4500-4600SPX region. BUT, please recognize that this is an ALTERNATIVE count for now, as I still believe that risk management should be your primary focus for now.
In the bigger picture, I still view the 3700-3800SPX region as our support. And, as long as that holds on the next pullback, I expect we rally towards the 4300SPX region over the coming weeks/months. So, I am going to patiently await a break of 3895 to make determinations as to where we may look for a long trade towards 4300.