Investors Need To Remain Nimble, Open-Minded and Cautious
Back in January, as the market was dropping to the lower 1800’s, I was posting thoughts that most on the public forums seemed to view as quite outrageous. I was suggesting at the time that markets around the world were setting up for a global melt-up. For those that have followed markets around the world since that time, including many of the commodities and emerging markets, our expectations seem to be supported by price action, despite much public disbelief. But, I would not expect anything less, as the public is most often wrong at market turning points.
However, even though we still believe the year 2017 can turn out much more bullish than many believe at this point in time, it still does not preclude one more market swoon before that melt-up begins in earnest. So, while I am still quite bullish looking into next year, with upside targets potentially exceeding 2500SPX, I still remain quite cautious in the near term until we see the break out signal I have been outlining for weeks.
One of the reasons I have maintained a healthy degree of caution is due to the warnings presented by the proprietary indicators developed by Mr. Bill Albert – the Scary Guy Put/Call Ratio and the Razzmatazz Wave, which are now exclusively posted within our Trading Room at Elliottwavetrader.net. These indicators track options trading activity, and rise (and turn bullish on the market) when options traders (following the "herd") put their money into bearish bets. The indicators fall (and turn bearish) when these same traders make bullish bets on the market. Mr. Albert has found a very unique way to calculate these market sentiment indicators using open interest represented within the options market. In fact, they have provided advance warning to almost all market turns during the years I have closely followed his outstanding work, including the declines following the May and November highs of 2015. Currently, his indicators are flashing a strong warning signal for bulls.
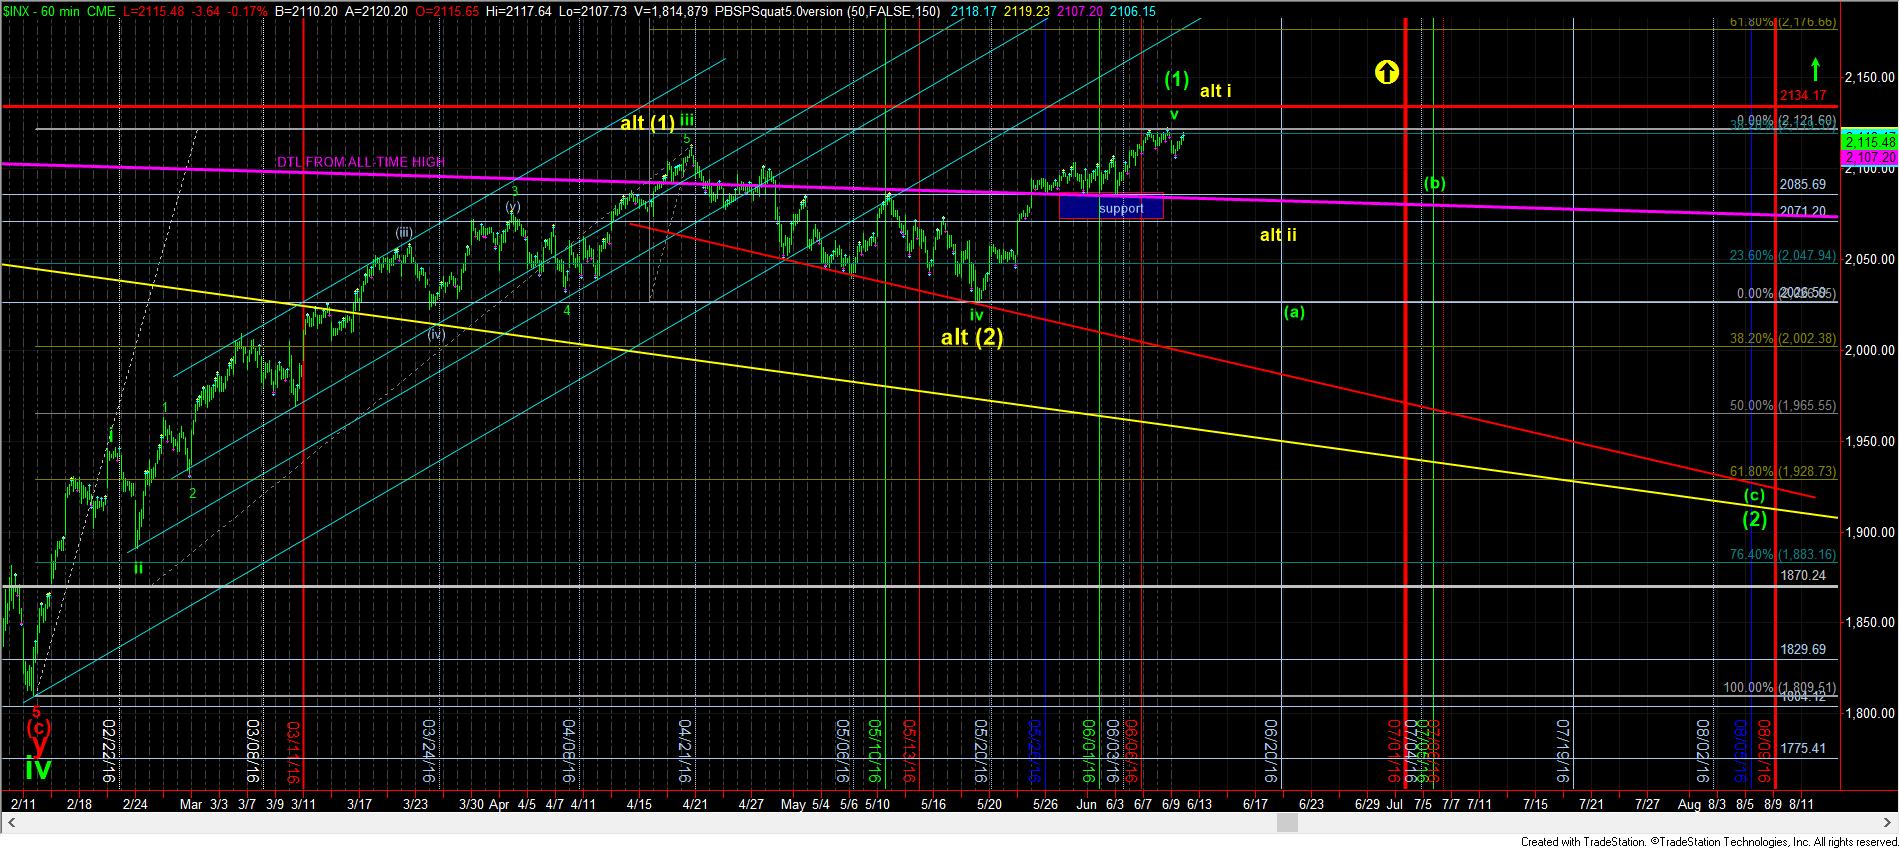
Based upon the action seen over the last week, I am still expecting a pullback to be seen in the market going into the summer. Ideally, that pullback should represent an a-b-c wave (2) structure and take us most of the summer to complete, as presented in the green count in the attached 60 minute chart. However, as I noted last weekend, I am still going to maintain a healthy respect for the more immediate bullish count represented in yellow until we are able to break below the 2026SPX level.
So, while the bears may yet have their day in the near term, I suggest you maintain an open mind about the potential rally that may be setting up for much higher levels going into 2017. In fact, I would highly suggest that you set aside all your fundamental perspectives as to why the market “cannot” rally any higher, as most of the market seems to be in that camp. And, since the market does not follow through with what most expect, I can assure you that the global melt up I have suggested is setting up since late January is much more possible than you are likely expecting.