Interesting Developments Today - Market Analysis for May 2nd, 2019
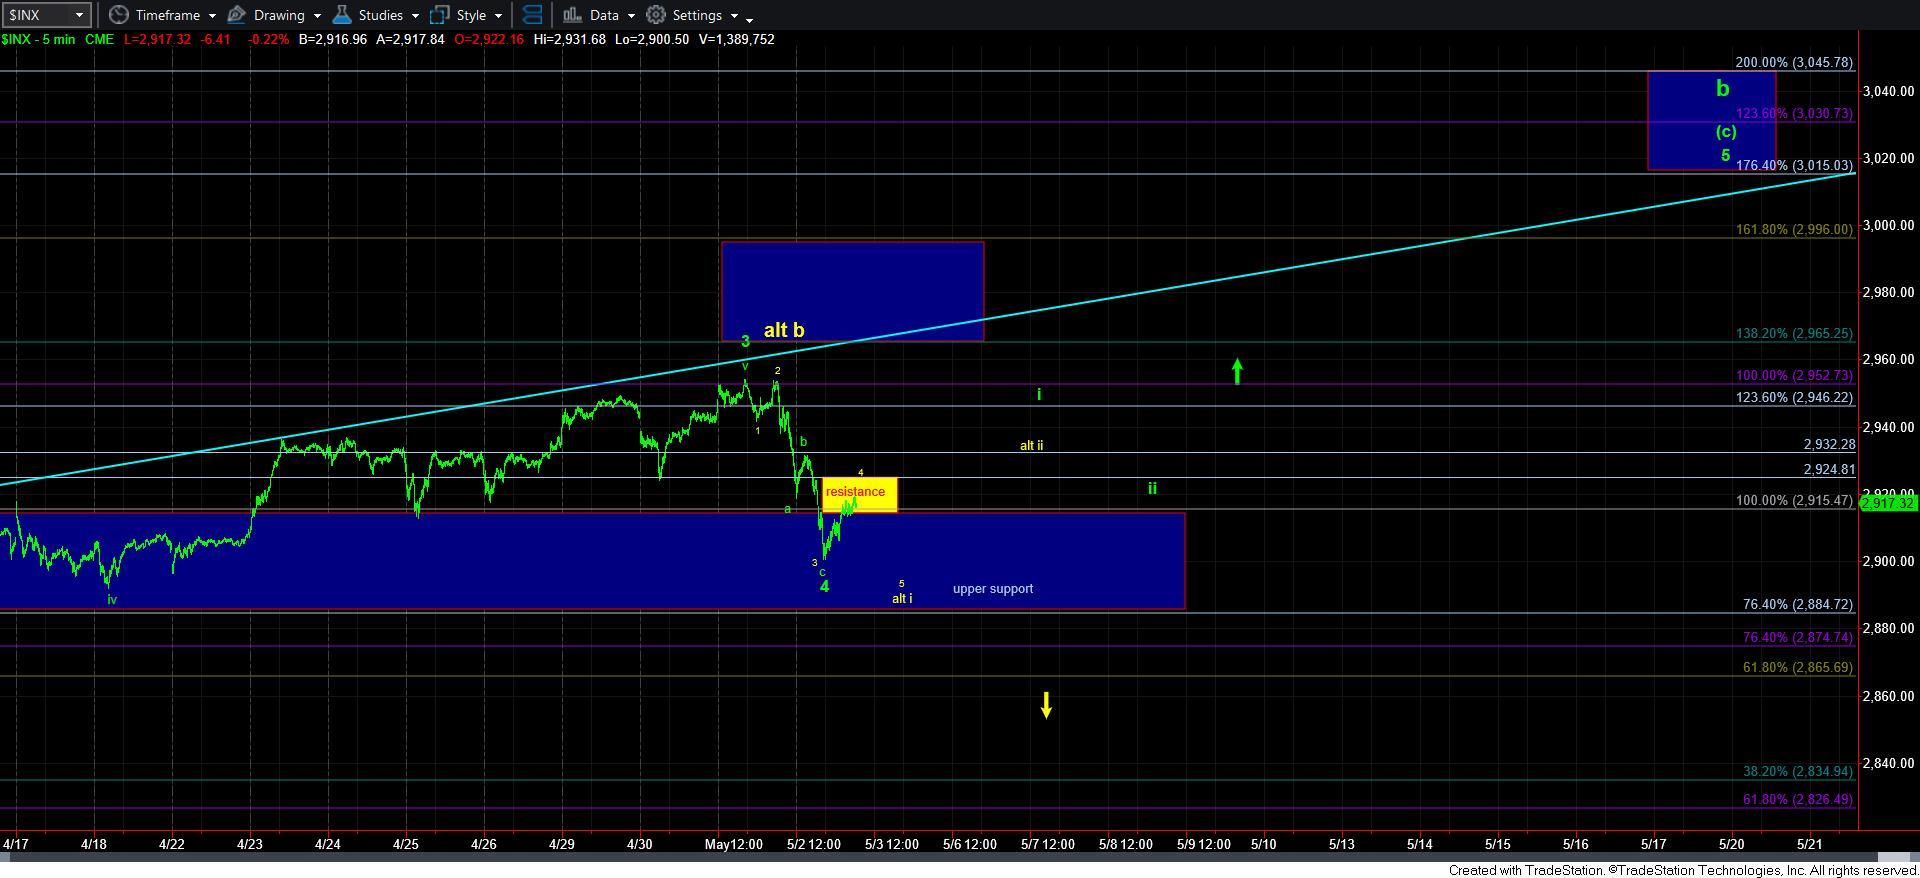
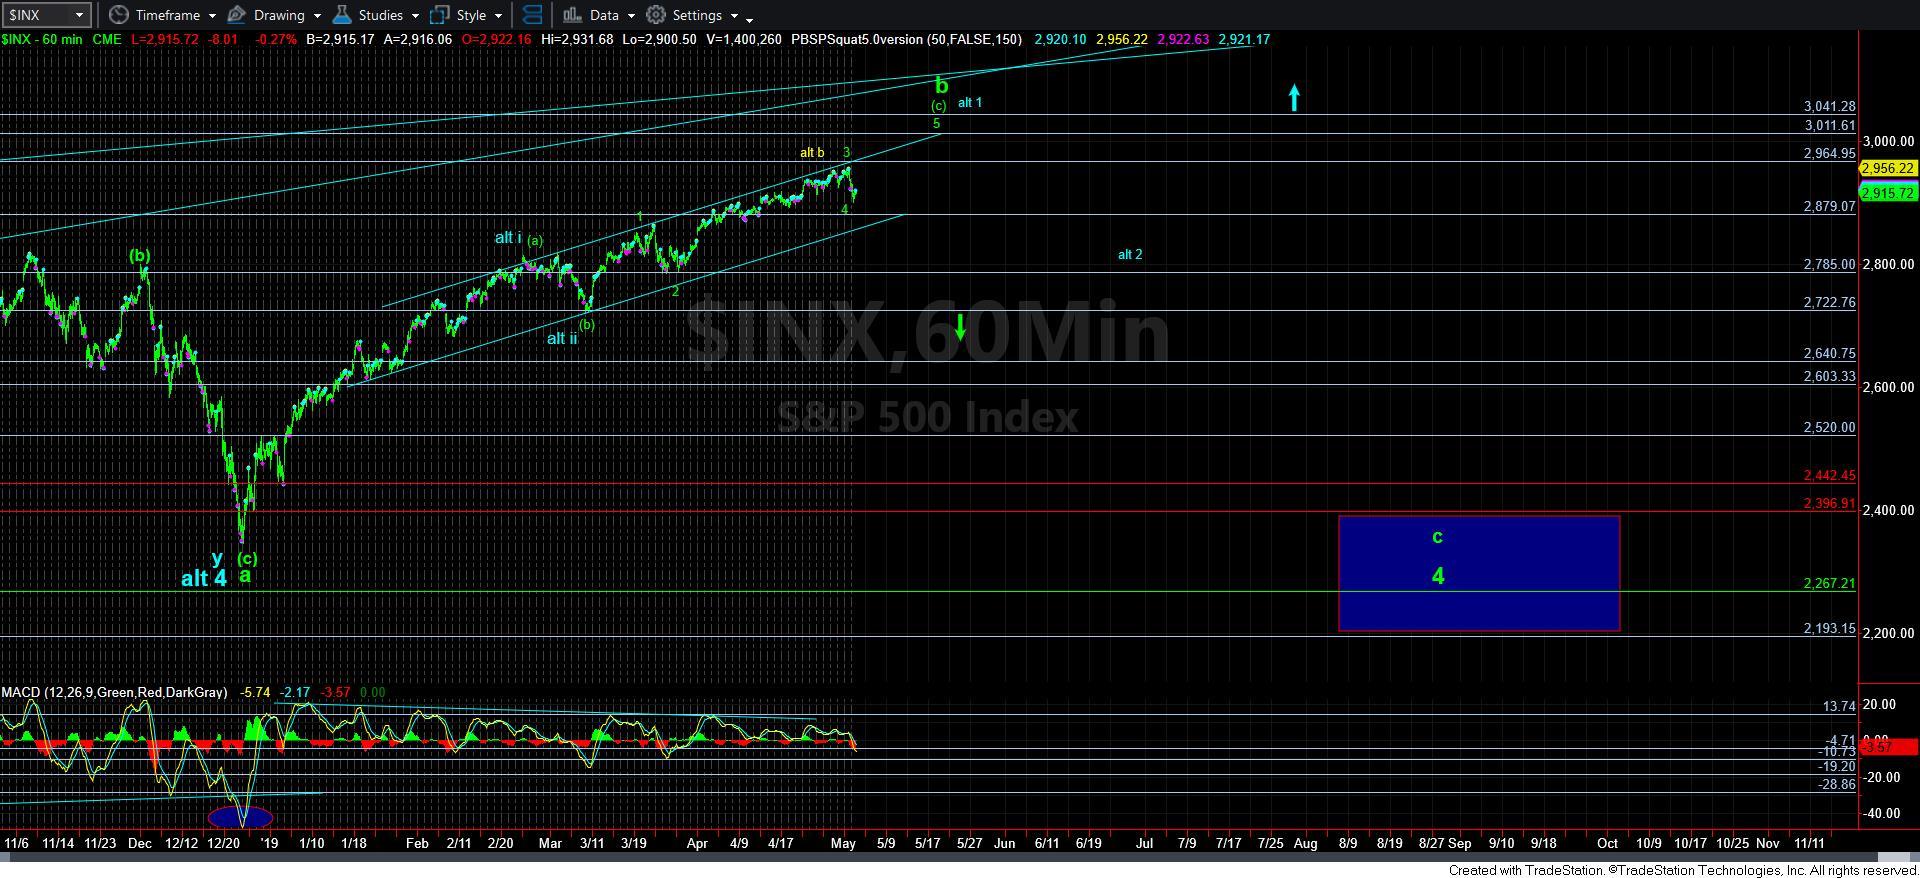
With the follow through down today below 2912, the market has made it more likely that wave 3 is done, and that we may have completed an a-b-c pullback at today’s low. (And, the only reason I add the word “likely” is that I am still not 100% confident that wave 3 has completed due to not reaching at least the 1.382 extension).
Take note that I have added a resistance box on my 5-minute chart, with resistance as high as 2925SPX. In order to prove that the market has bottomed in wave 4, we need to see a strong move through that resistance which will point us back up towards the highs to complete wave i of 5, as shown in green. That will then provide us with a wave ii pullback, also shown in green, and that will set us up to rally to the upper box for wave 5.
However, if the market is unable to move through this resistance, and we roll over to see a lower low, then that would present us with a potential 5-wave structure off the recent highs. That would be a warning to the long side of the market that the b-wave may have already topped, and the trend may have changed to the downside for the c-wave. I will need a 5-wave structure at one larger degree to be much more confident of that potential, but should we see 5 waves completed from here, I would not want to be playing the long side until that pattern invalidates.
So, at this point in time, the market still has potential to take us up to the 3011-45SPX region over the coming weeks. However, if we roll over to make a lower low, that potential gets significantly reduced.
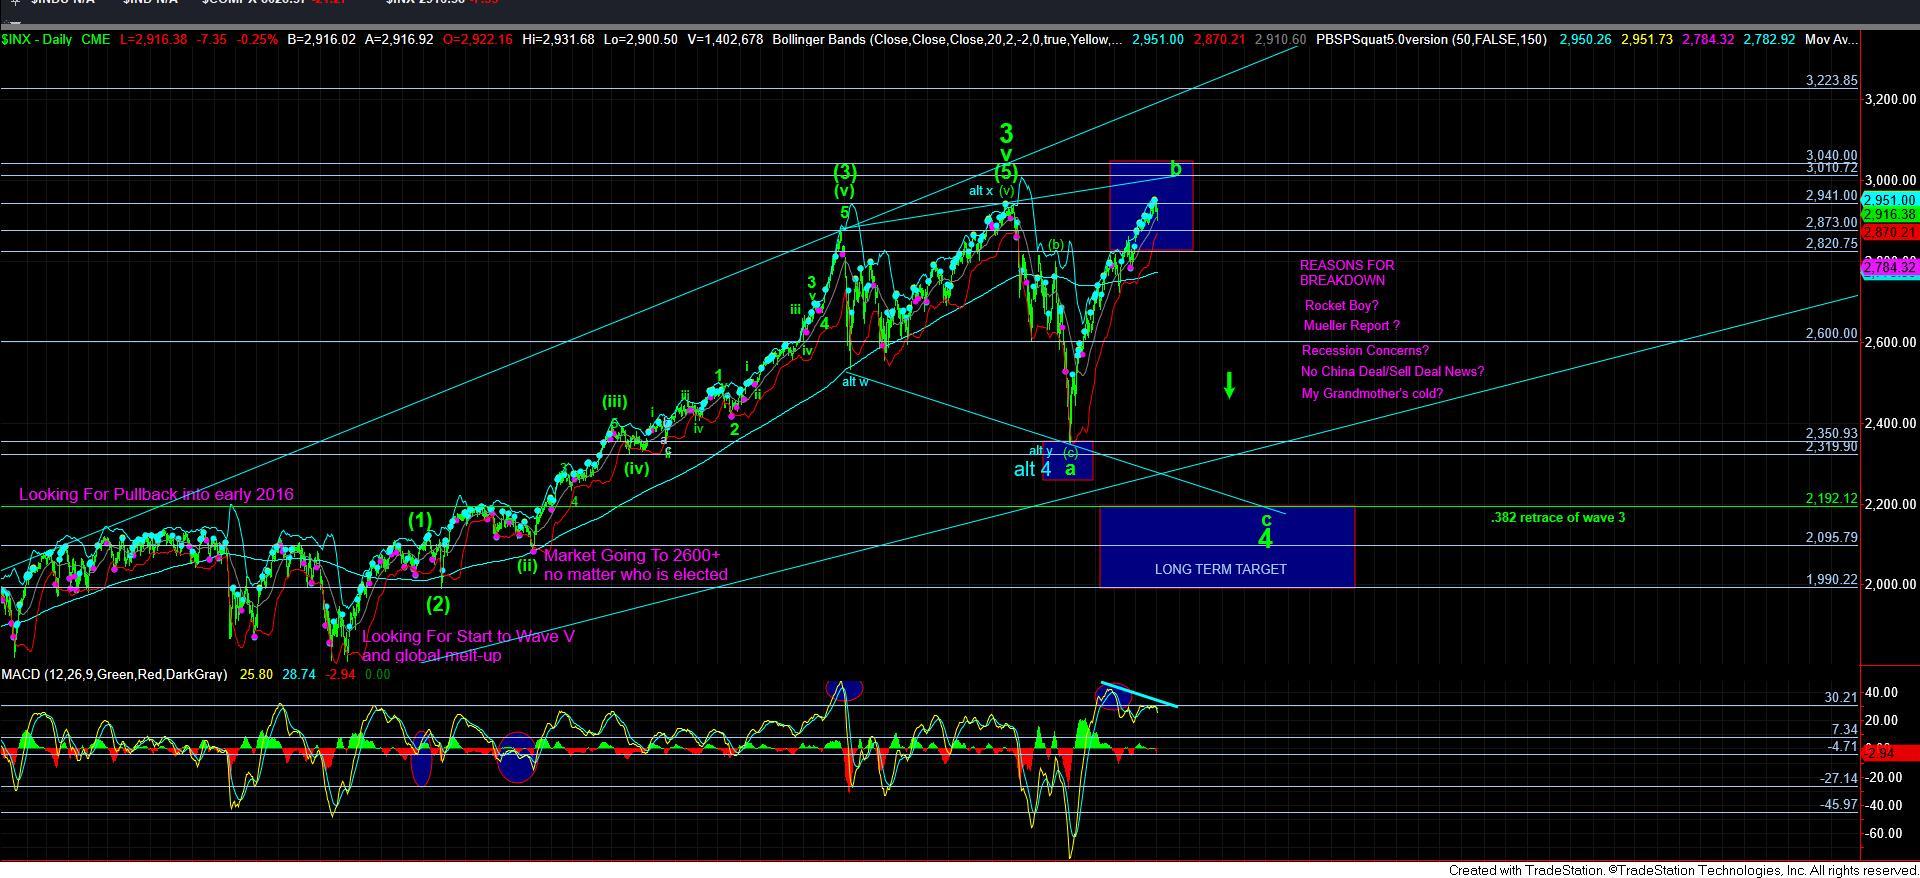
The last point I want to make is I want you to take note of the MACD on the daily chart. It has been diverging and has now started to roll over. Should we see a sustained break of the 2880SPX region, it would likely suggest the top is in place, and a larger degree decline has begun.