Initial Support Is Broken
With the drop in the market today, we have seen a break down below the initial signal levles of 3130SPX and 160.50IWM. This is a warning to the bullish side of the market, and has us looking for confirmation that the top has indeed been struck with follow through bellow 3070SPX and 157IWM.
If you have read my analysis carefully over the last several weeks, you know that today’s drop only provided us an initial indication that the rally off the October low has completed. The 3070SPX and 157IWM levels are what we really need to break to confirm that this rally has run its course, and that a larger degree correction has finally begun.
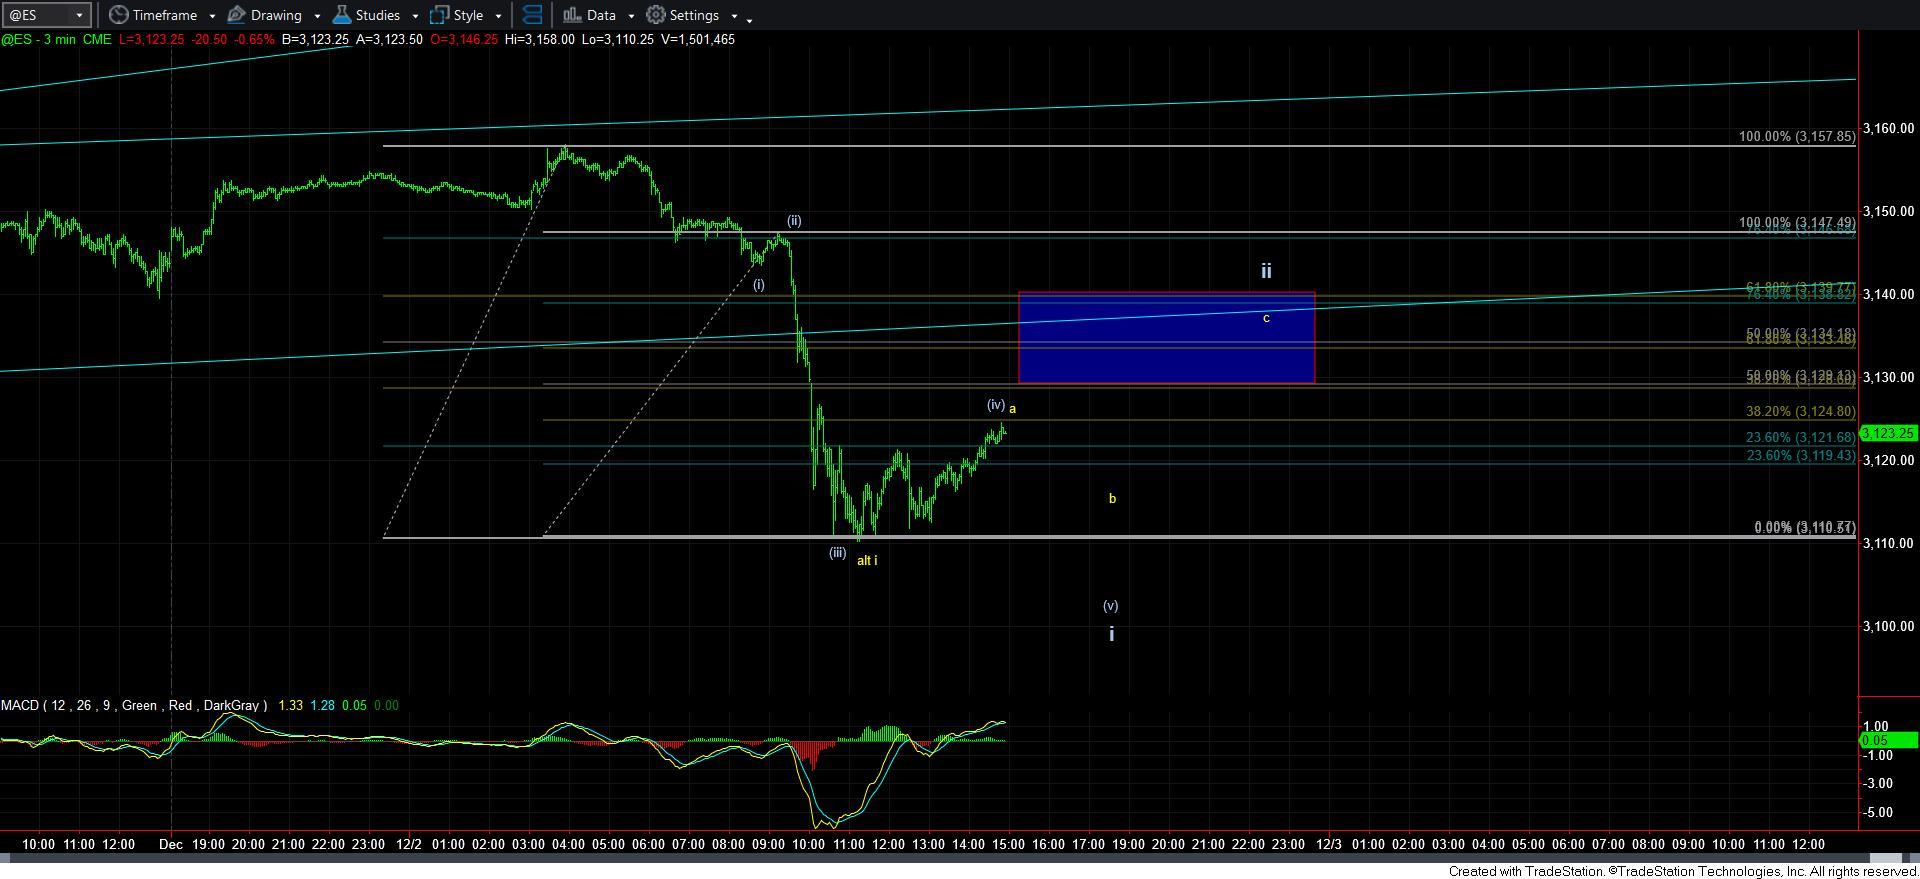
But, until we actually get confirmation that the top has been struck, I cannot help but consider the potential for a higher high in what would be a bigger ending diagonal for this 5th wave, as I show on the attached 5-minute SPX chart. For now, this is simply an alternative, especially as long as we remain below 3140ES.
Assuming we have struck our top, the question as to what type of correction we are tracking will ultimately be decided by how the market breaks down below 3070SPX and 157IWM.
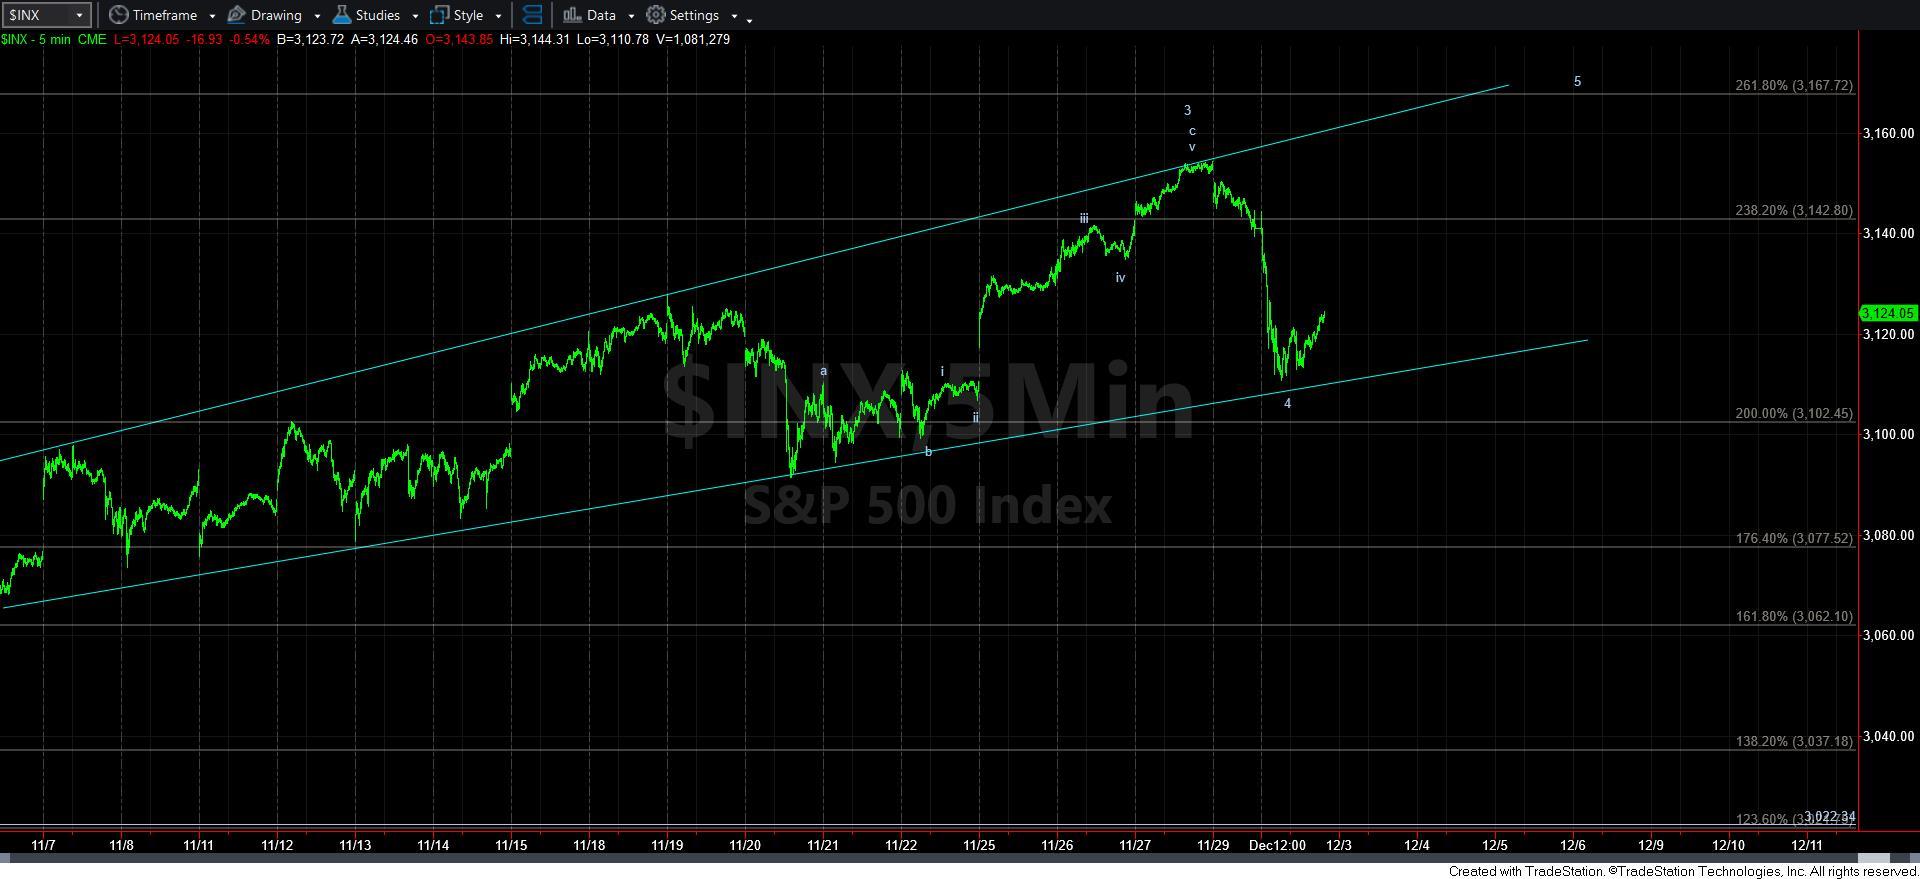
Again, if you have been reading my analysis carefully, you would know that my primary expectation is that we will see an impulsive 5-wave c-wave decline off these highs. And, thus far, the market has done nothing to dispel me of that potential.
Ideally, today provided us with waves [i]-[iv] of an initial decline off the market highs. That means the ideal structure would look best with a lower low providing us with a clean 5-wave structure off the recent highs. I have outlined this on the attached 5-minute ES chart.
While I can come up with a 5-wave decline wave structure into the low structure today, I would not say it would be quite as nice if we got a lower low as presented.
In the bigger perspective, whether this turns out to be a 5-wave decline or an initial 3-wave decline, as long as the market remains below the 3140ES resistance noted on the 5-minute ES chart, I am expecting us to break down below 3070SPX over the coming week.
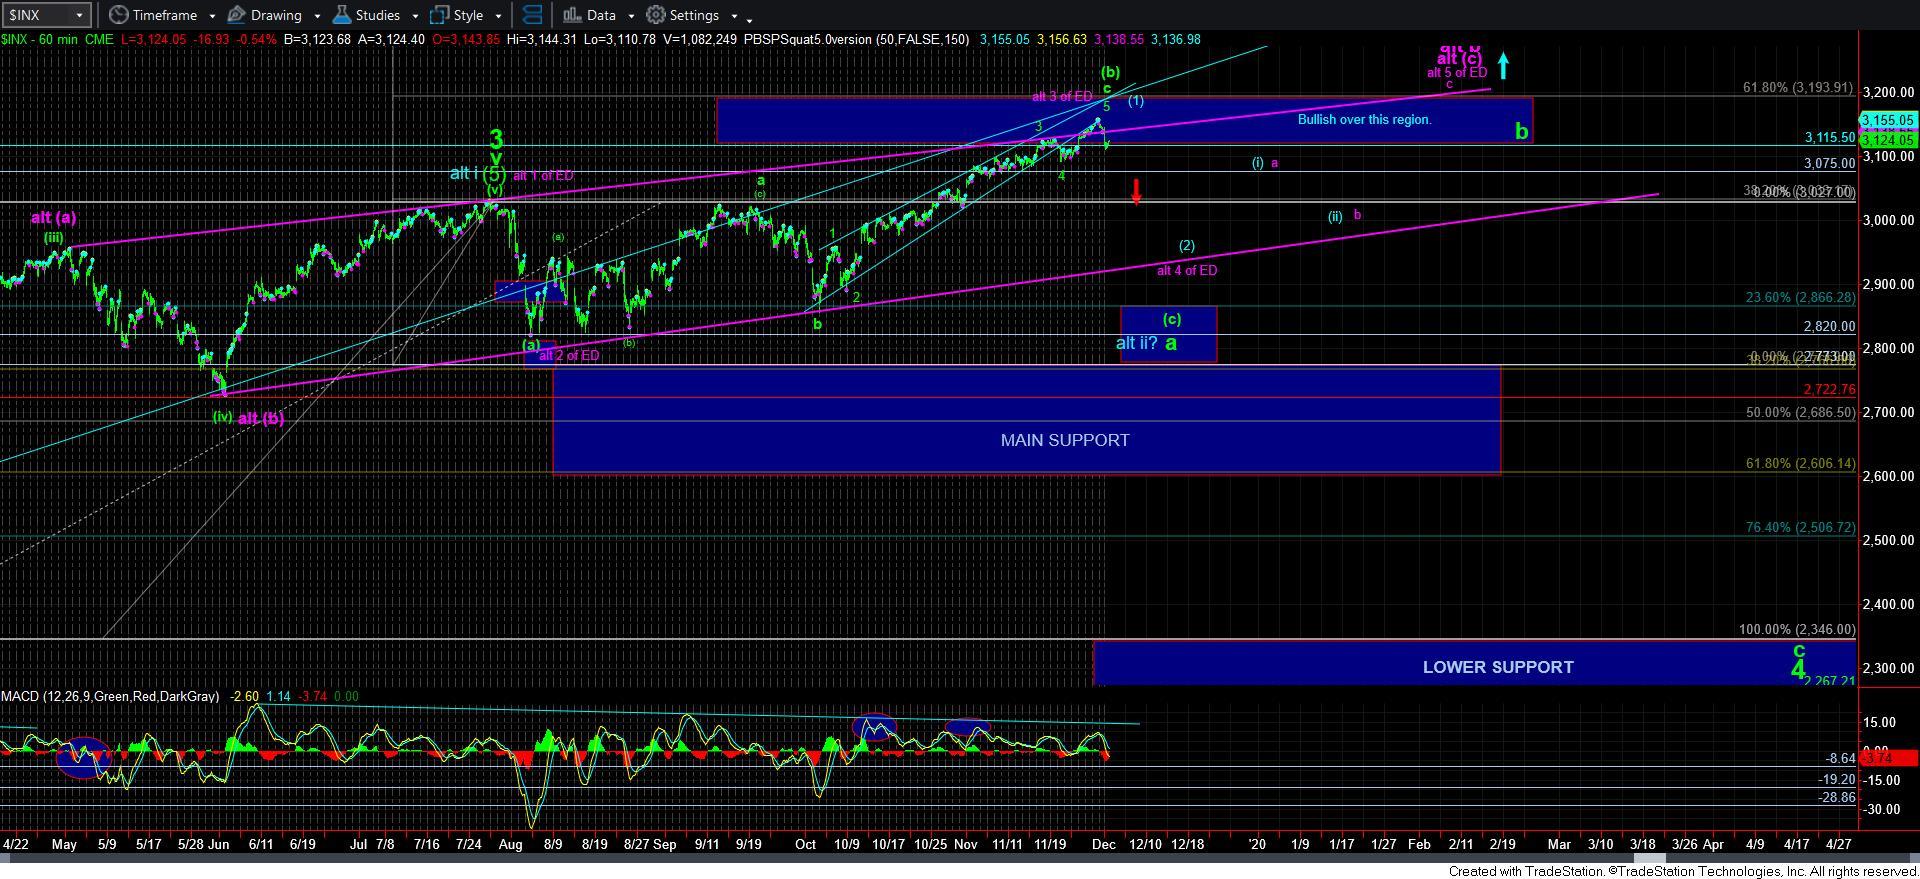
Alternatively, should the market be able to exceed that resistance, please take note of the attached 3-minute SPX chart, which would highlight an ending diagonal which has not yet completed. That is why these diagonals are so treacherous and so dangerous. And, when they do complete, the reversal is quite strong and often targets the region from which they began – in our case, the 3070-80 region.
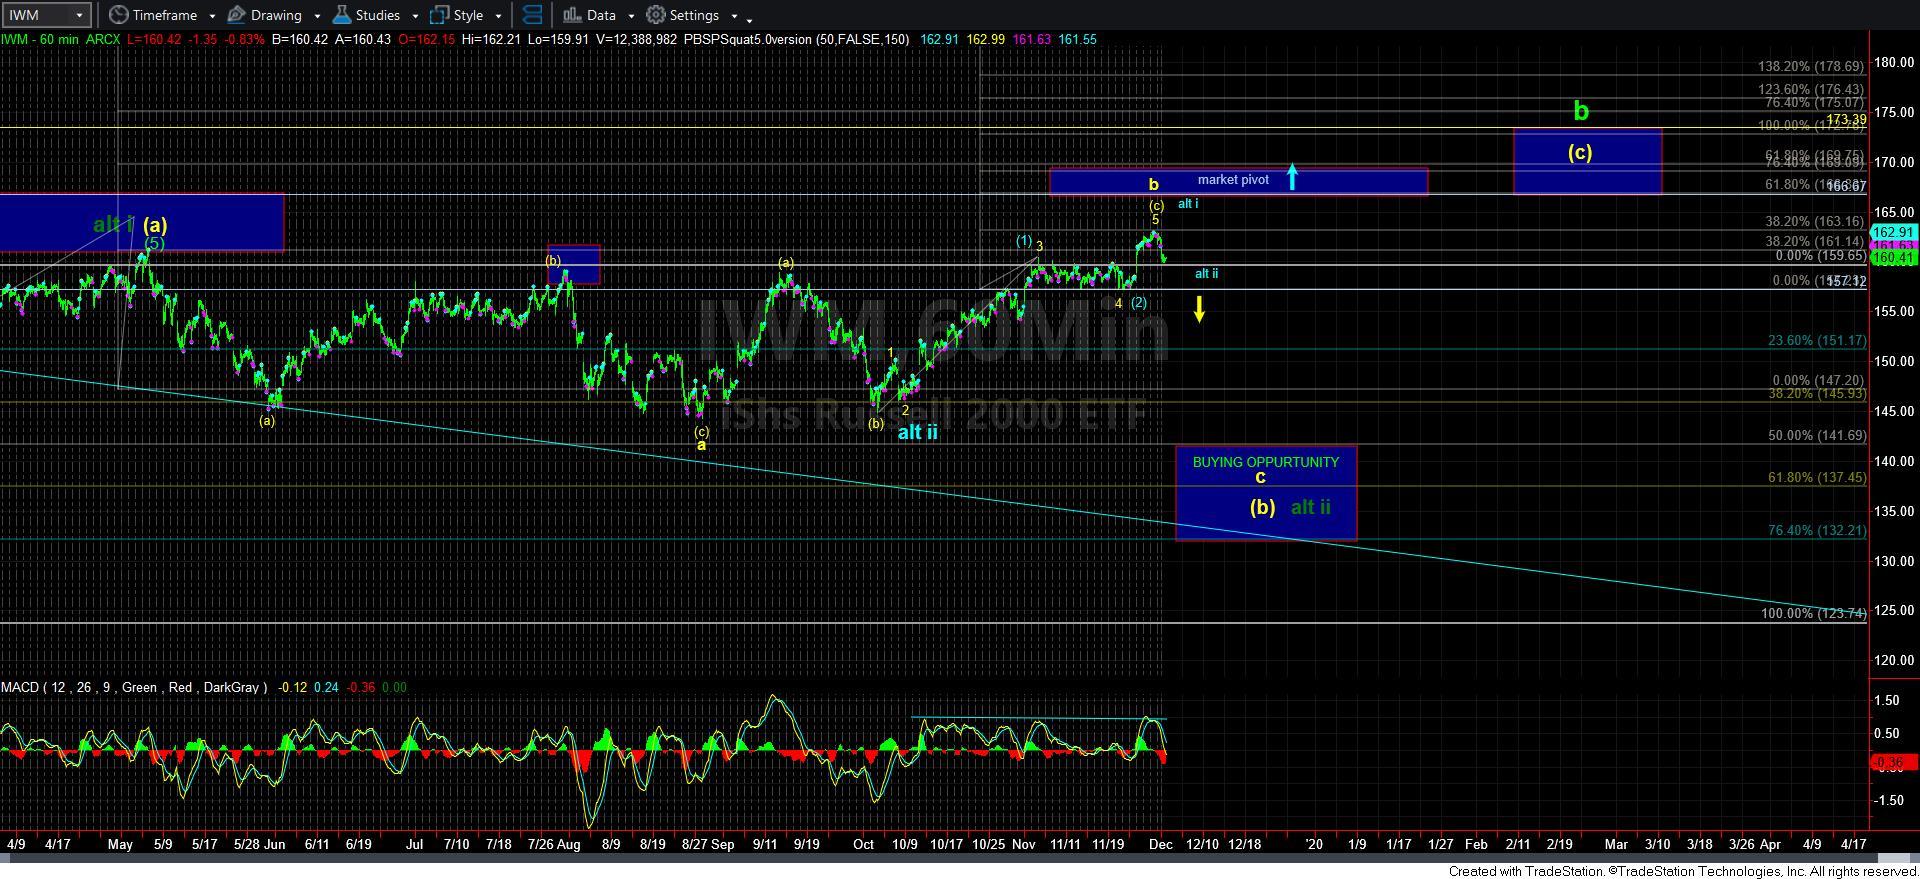
So, in summary, until the market resolves the current region at which it is trading as I write this update, I cannot be confident if this decline will take the shape of a 3-wave structure or a 5-wave structure. Thus far, it has left the potential for a 5-wave structure open. Moreover, it will not be until we break the 3070SPX region that we will have a much better idea as to how this decline is taking shape, and where the next major buying opportunity will be. But, for now, nothing has yet invalidated the green count outlined on my 60-minute SPX chart, or the yellow count outlined on my 60-minute IWM chart. If we cannot complete 5-waves down off an all-time high, then that would be an initial warning that this will not likely be the appropriate count, and I will likely move to the blue or purple counts.