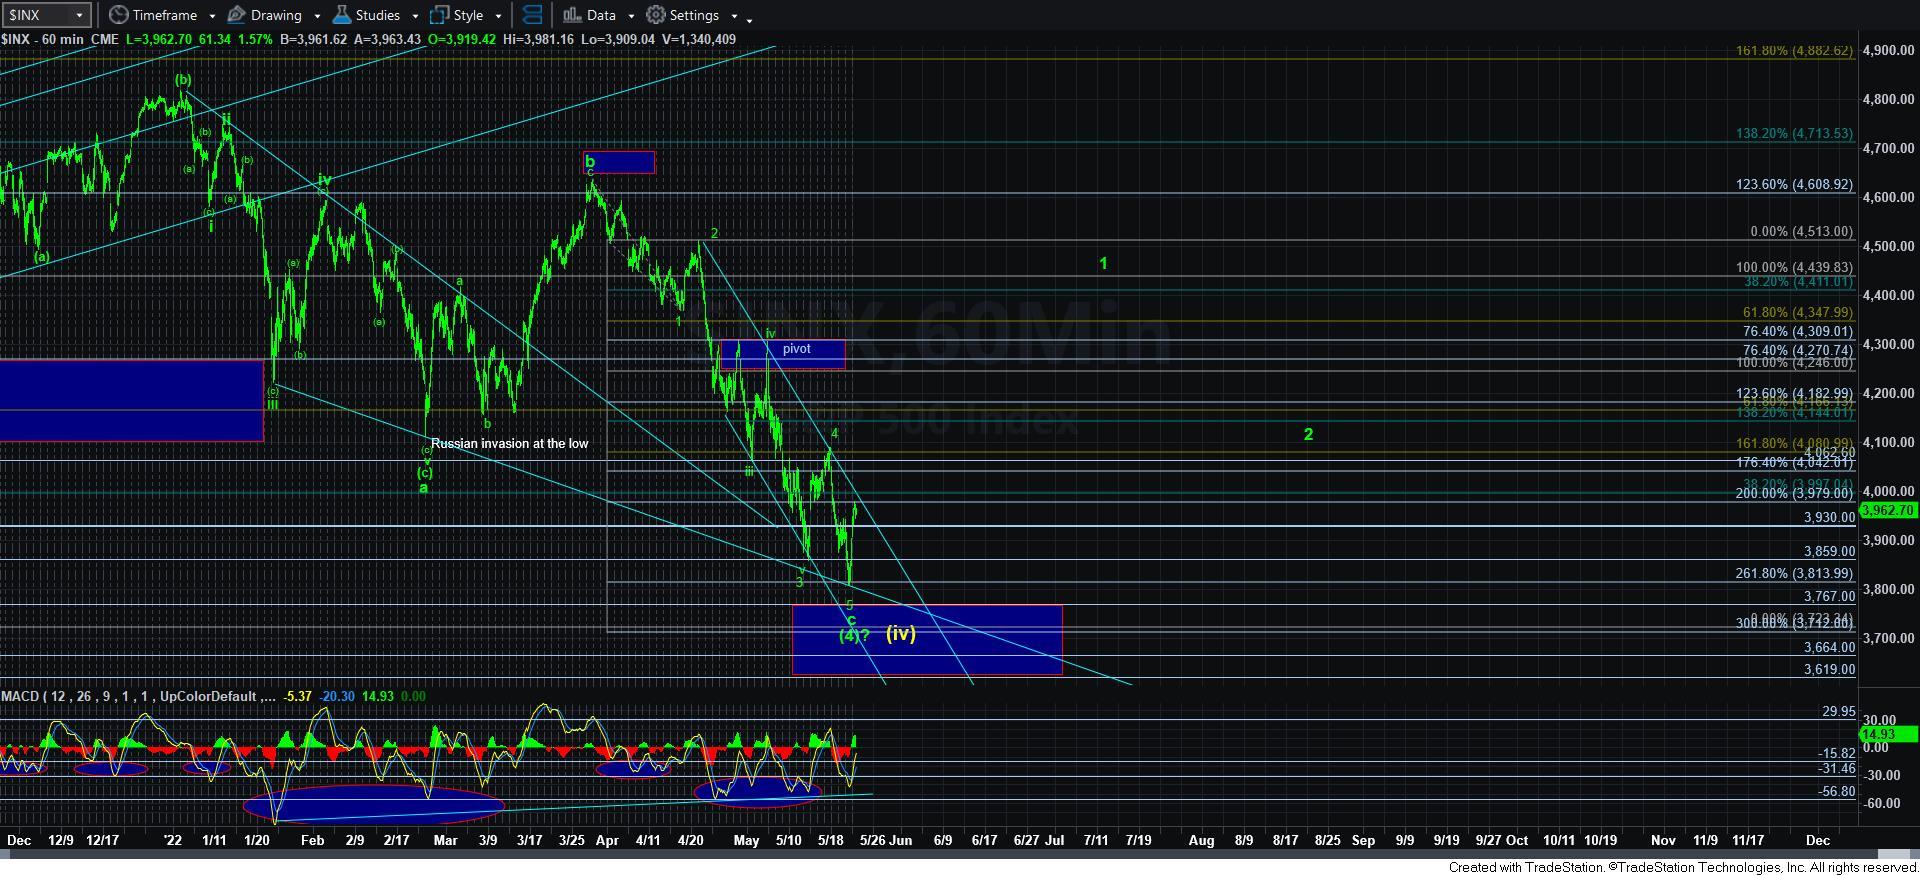
Initial Signs Of A Bottom
With the market being extremely stretched to the downside, we have been patiently awaiting an initial 5-wave rally, followed by a corrective 3-wave pullback, followed by a rally over the high of the initial 5-wave move off the low.
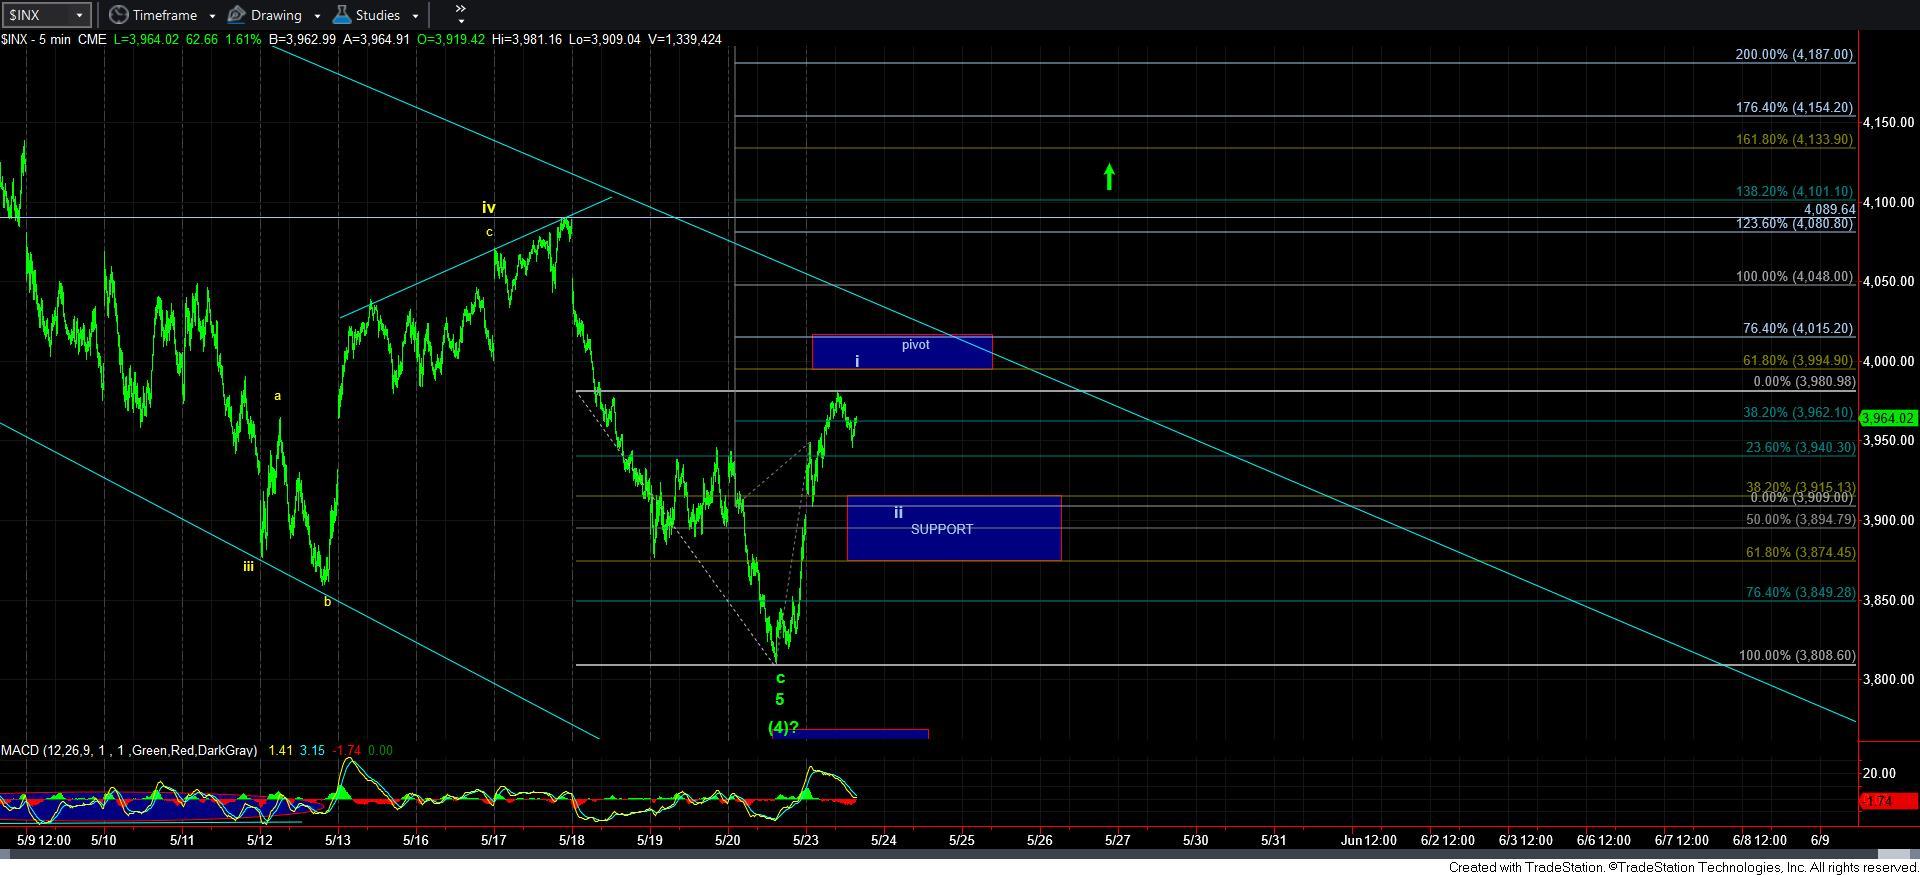
And, where the market left us on Friday, it did not provide us even an initial 5-wave rally off the lows. But, as we stand this afternoon, the 1-2 downside set up I was alluding to in the weekend update has now been invalidated, and we have the minimal waves in place to consider the initial 5-wave structure off the low struck on Friday now in place.
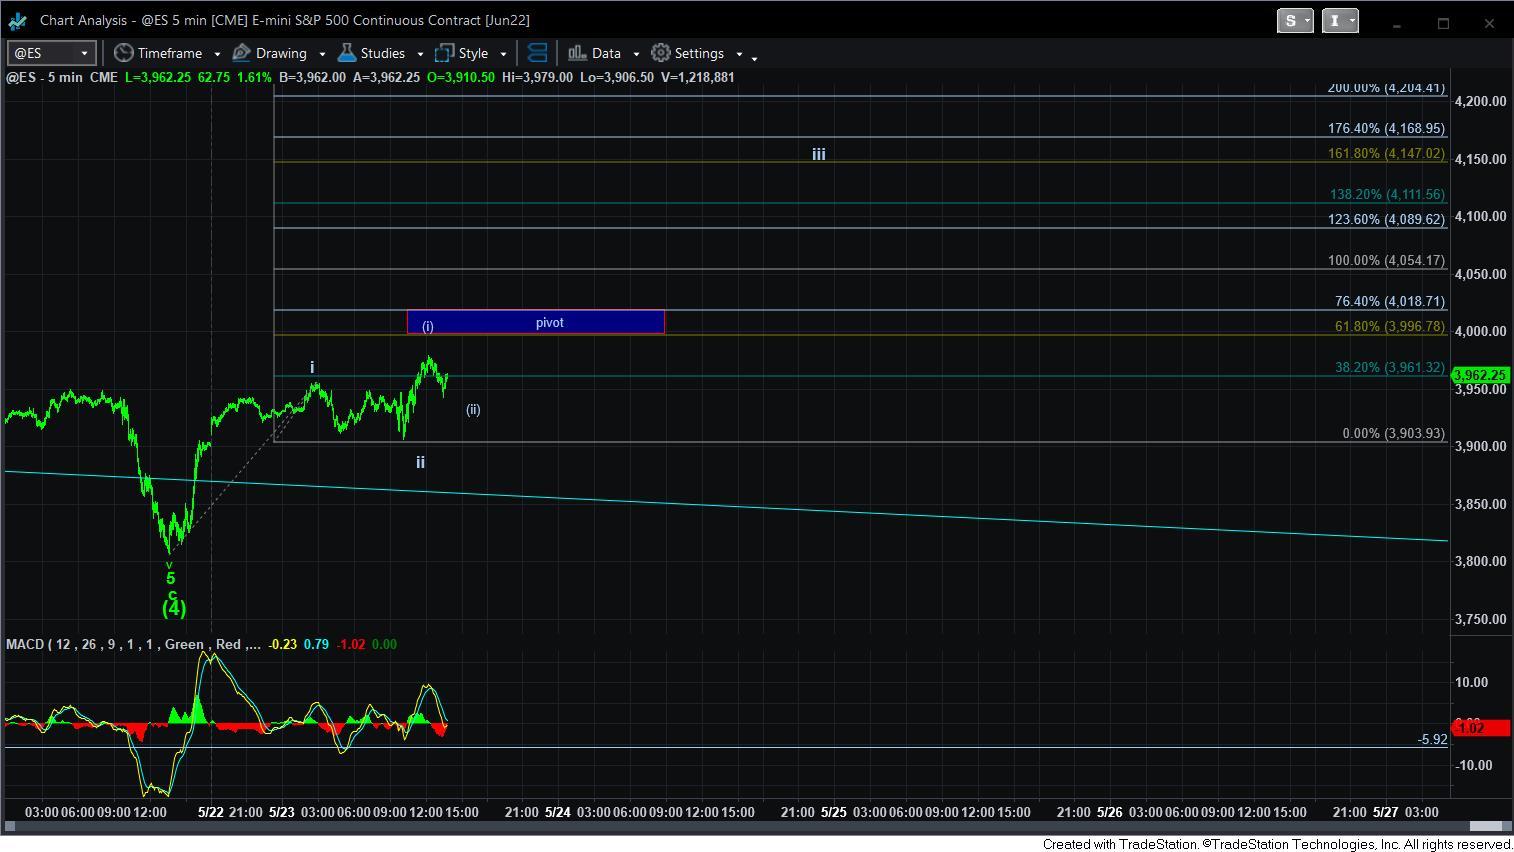
But, I do want to bring to your attention the potential that we even have a i-ii, [i][ii] in place, as I am outlining on the attached 5-minute ES futures chart. You see, the SPX does not have the additional wave structure which was seen on Sunday night into Monday morning. So, in the ES, there is potential for a more aggressively bullish count being in place already, whereas the SPX looks as though it still needs more of a wave ii.
So, I have added pivots to the chart, as well as a support on the SPX chart between 3875-3915SPX. So, to put this very simply, as long as we now hold over support, and then break out through the pivot, we have the potential to continue higher towards the 4150+ region to complete a larger degree 5-wave structure off the low. Should that occur, then we have a high probability signal that the market has completed its prior 4th wave, and that a 5-wave to new all-time highs has likely begun.
In simple terms, the bulls have an opportunity to step up and take the ball back.