Initial Indications of a (c) Wave?
With today's downside action, I can make out a 5 wave downside structure in the ES on the smaller scale. However, that would assume that the high struck in the futures was a truncated top to the (b) wave. So, clearly, it weakens such an expectation.
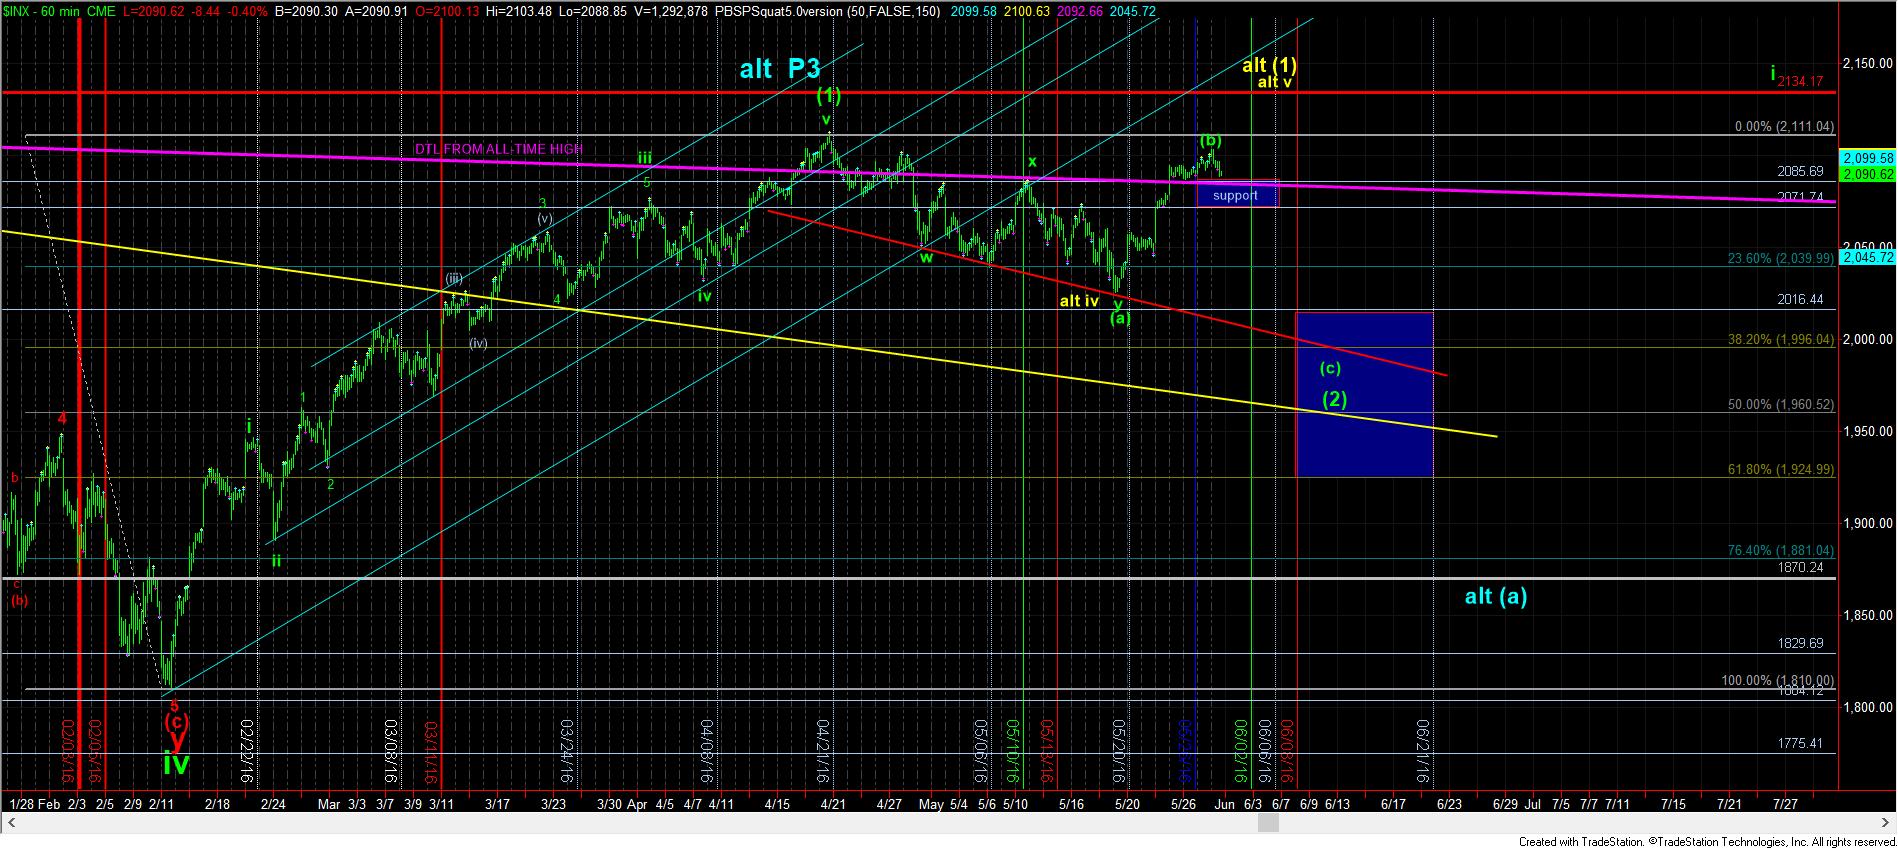
However, as I have noted several times before, we need to see support levels begin to break to begin to have more confidence in the (c) wave down. 2085SPX is the upper level of support, as noted on the 60 minute chart. We need to begin to break down below such support, with follow through below 2070SPX to provide strong indications that the (c) wave down is in progress.
Due to how high the market has come in the potential (b) wave, the (c) wave target should be at least the 2016SPX region, where (a)=(c). Of course, we can see stronger extensions to the downside below that, and, to be honest, I would probably prefer larger extensions to at least the 1996SPX region, with the 1960SPX region being where the .500 retrace of wave (1) resides, the top of the channel from which we broke out (yellow), and where the (c) wave would be equal to 1.618 times the size of the (a) wave.
However, if the market were to hold this upper support region, and provide another impulsive rally to higher highs, I would probably move into the yellow count being the primary at that point. So, we are now at an inflection point.