Initial Cracks In The Armor Or Set Up For Melt Up?
Today’s drop broke the levels the ES should have IDEALLY held if it was going to move higher for a 5th wave to complete the rally off the low made on the 2nd of the month. But, what the market has now done is provided us with more definitive upside resistance due to this pullback.
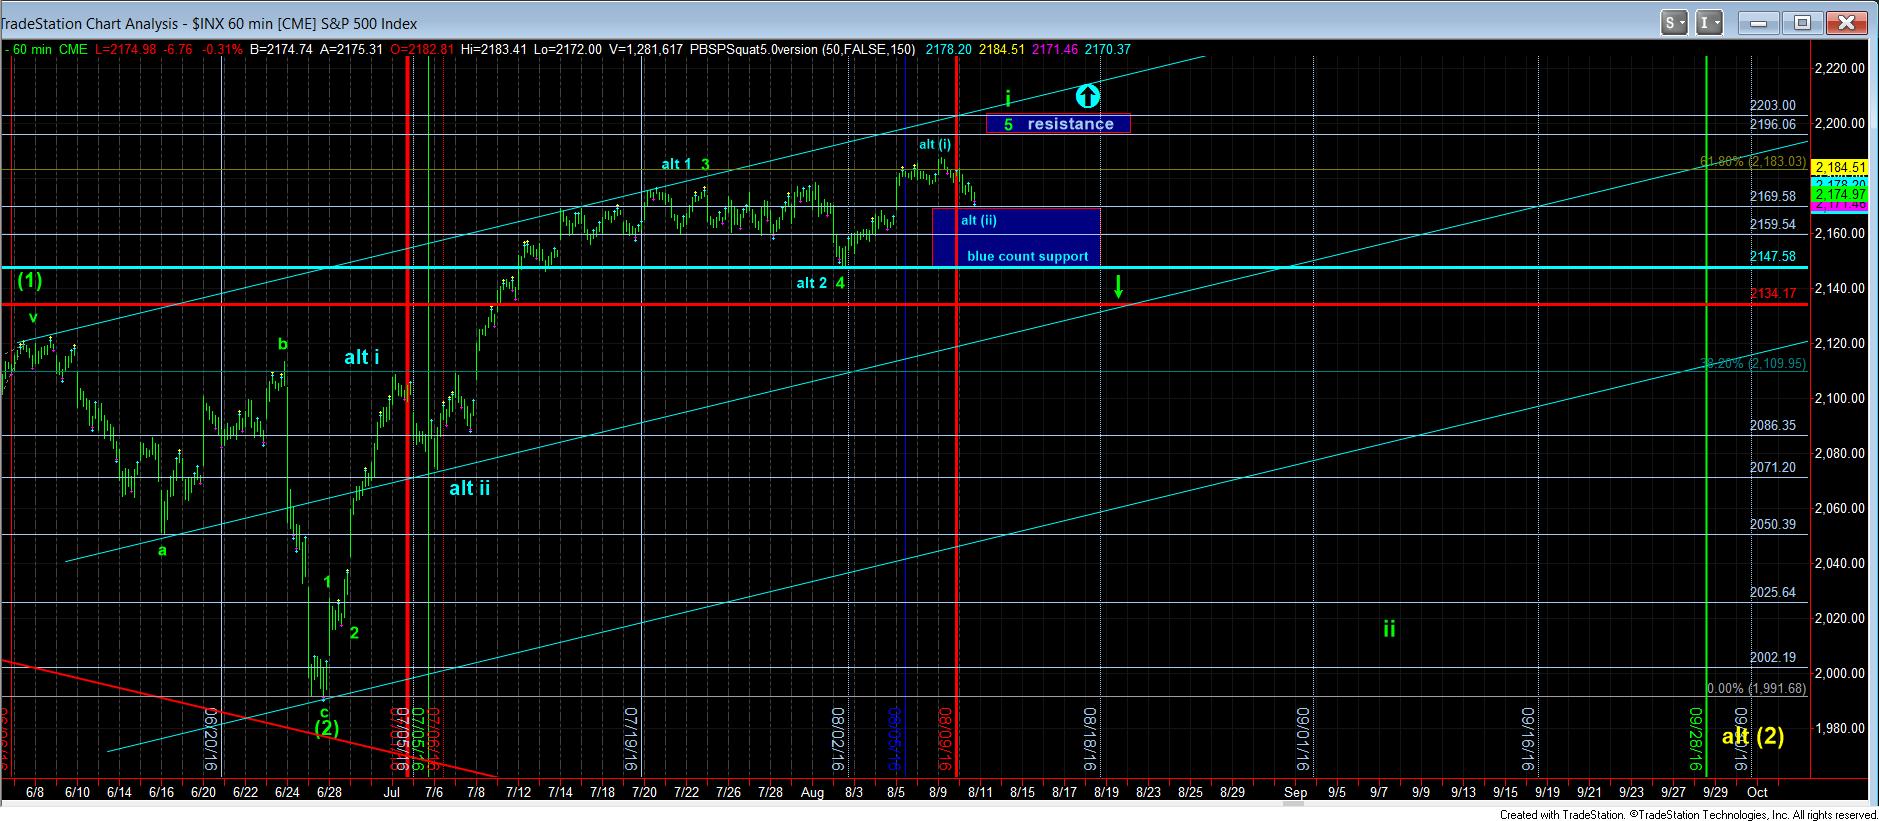
While we certainly can count enough waves to consider the rally complete at the recent high, I am unwilling to see any big downside moves until the support for the blue count is taken out at 2147, and I have reiterated this many times. So, until we see a break-down of 2147, I cannot expect a big pullback, despite my desire to see one in this region before we continue towards 2500SPX.
As far as upside resistance on our chart, I am able to narrow that resistance down to the 2196-2202SPX region. You see, if we do get another rally to higher highs, a 5th wave often measures .618 the size of waves 1-3. So, if this is indeed a 4th wave pullback (despite its abnormal depth), then any higher highs should remain below the .618 extension of waves 1-3, which is 2196. However, if this pullback is really blue wave (ii), then we should be moving through 2196 within the next few trading days, with a move through the .764 extension at 2203 strongly confirming that we are melting up in the heart of wave (3) towards the 2350 region.
So, today’s pullback was quite helpful in setting our upside parameters with much more concrete levels.