Initial Bond Target Struck
There are times I look at a chart, see what the waves are telling me, and think to myself “this can’t be.” That is what happened to me when I reviewed the TLT chart back in the late summer into early fall of 2018, as the Fed was on its strong path of continually raising rates.
And, when I started noting that I was going to go long TLT when we broke 113, a rush of comments like “you cannot fight the Fed” poured into my posts. Well, I stand here today, after TLT has rallied almost 17% since that time, and claim that the Fed cannot fight the market. In fact, it will not be long until the Fed realizes it is being forced by the market to lower rates.
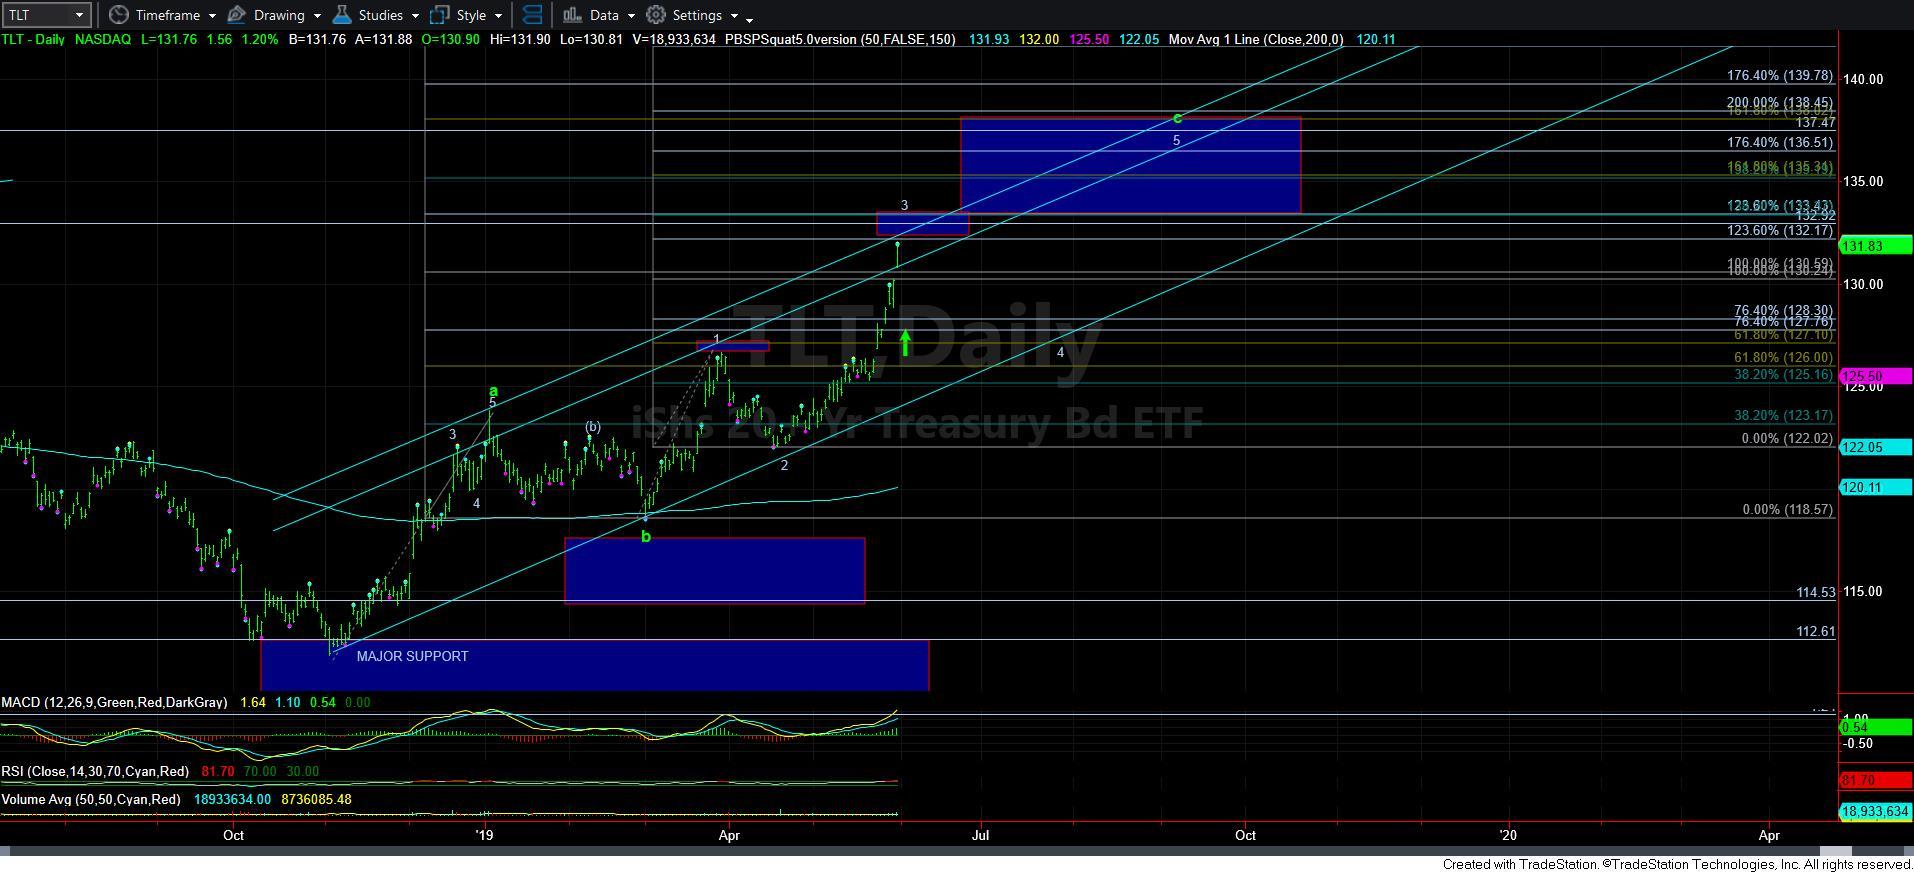
So, as we now have struck our minimum target we set for this chart many months ago, I think we are nearing the completion of wave 3 in an ending diagonal for the c-wave I am tracking – assuming I have the correct wave count.
Now, the structure we are seeing, along with the technical indications, still points me to believing that the 135/36 region is a good primary target, with the potential to extend as much as the 138/139 in the coming months. And, I am still maintaining that as my primary target. But, here is the kicker. Due to the structure of the larger degree in the TLT, I have no confidence that the market can exceed 139. So, as we progress over the coming months, I will likely be exiting the market once we move towards our long term ideal targets.
Lastly, please do not assume this is the same thing as me saying that I am certain that the market will stop at 135/36 or even at 138/39. Rather, it is simply me saying that the meat of the rally I expected is approaching completion, and I am too unsure of anything beyond my primary expectation to risk any significant money for such further potential upside.