Inability To Break 2600 SPX Adds More Complexity
Standards suggest that after a rally in an [a] wave, the market normally provides a pullback in a [b] wave, most often targeting the .618 retracement of the initial [a] wave rally. Again, those are standard expectations.
But, as we know, markets are non-linear, and sometimes the market is stingy with standards. We may be seeing that in our current case.
Before I get into the detail of the micro count and the complexity I am seeing, allow me to begin with what I think remains within our higher probability perspective at this time.
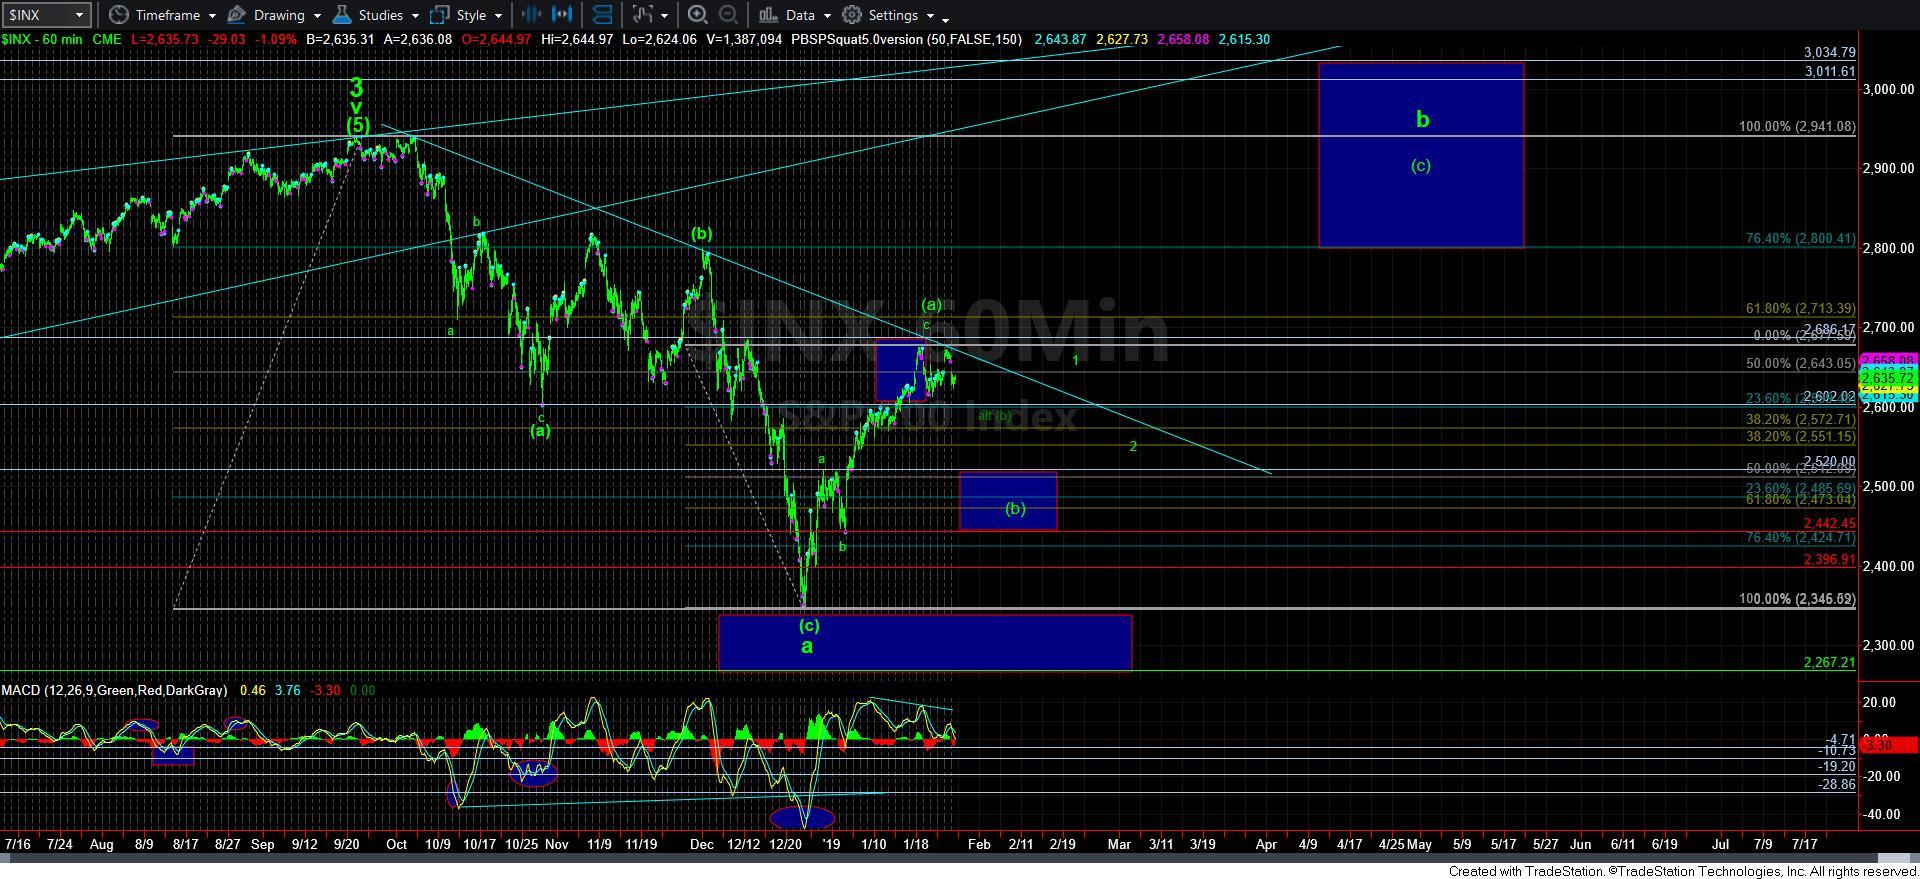
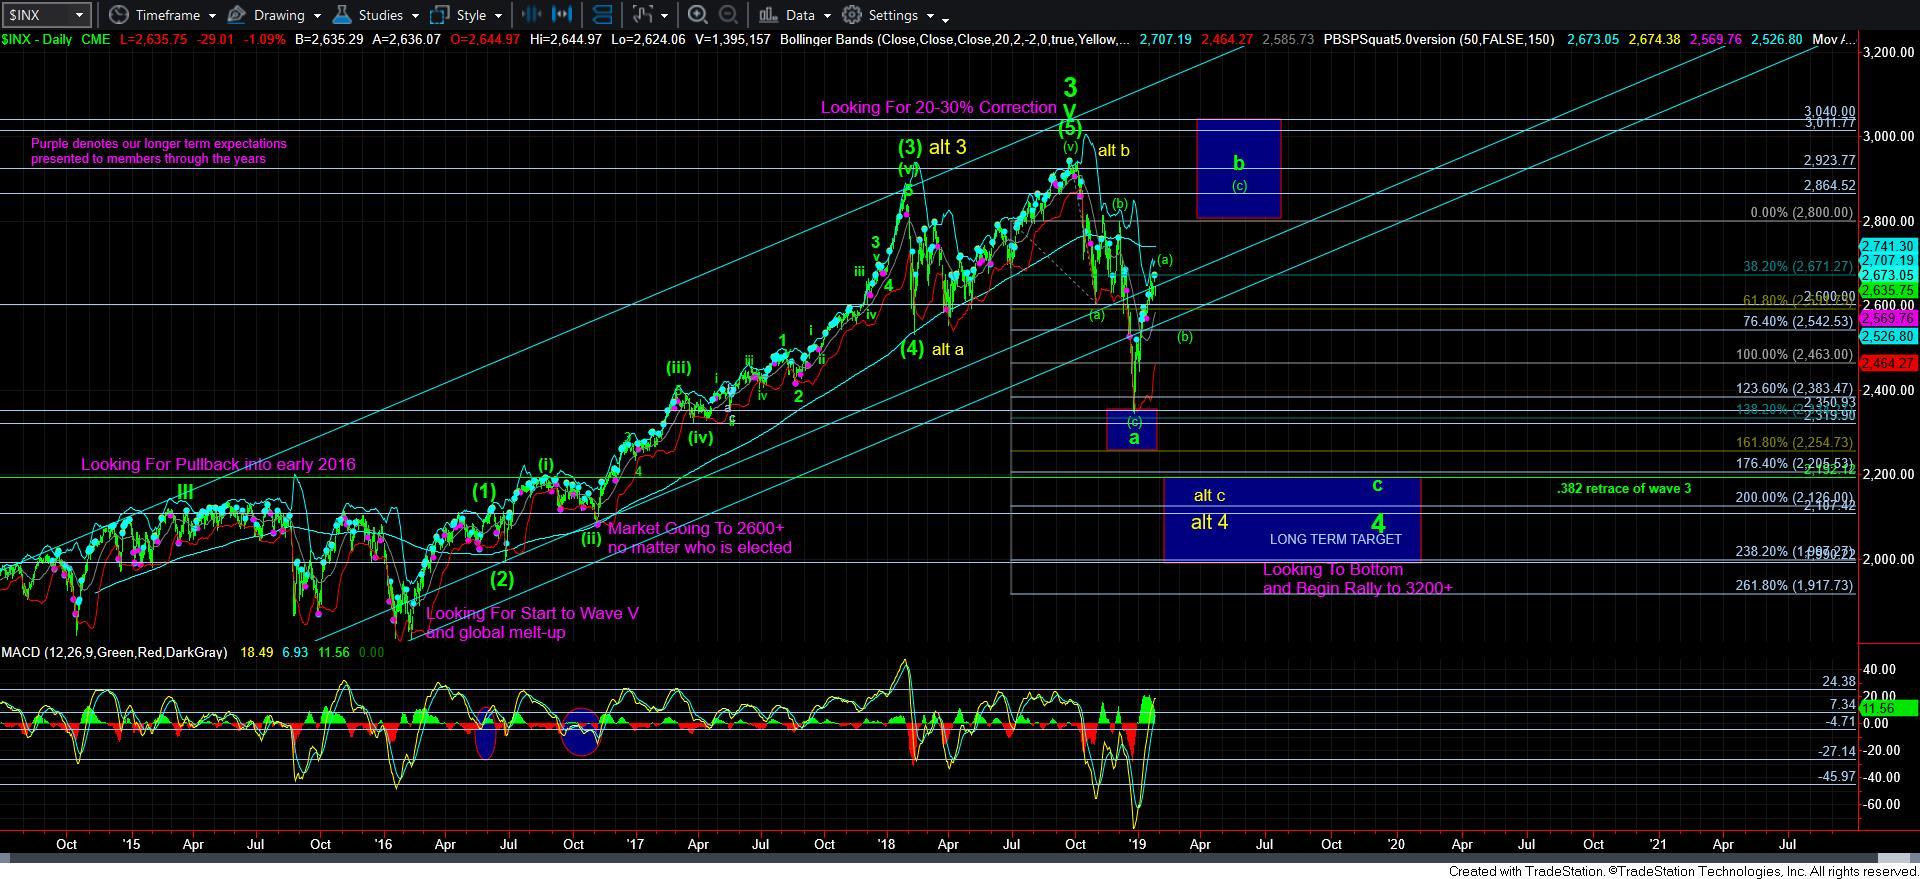
First, I think it is a higher probability that we are still within the larger degree 4th wave. We have not struck the minimal ideal target for a 4th wave of this magnitude. We do not have anything resembling an a-b-c decline off the all-time highs, or even in the alternative presented in yellow on the daily chart. And, we do not have a clear 5-wave structure off the lows suggesting that we may have an unusual bottom in place for wave 4. So, based upon the preponderance of the evidence, it still suggests we are within the throes of a larger degree 4th wave.
Second, I have conferred with our StockWaves analysts, and they do not see any strong evidence that many of the major stocks we track suggest this 4th wave has ended. And, since the stock market is made up of stocks, this, too, supports our perspective that we are still in the throes of a longer term 4th wave.
So, again, we have to go with what we are seeing from a higher probability perspective, and much of what we follow suggests we are still in this larger degree 4th wave.
Third, our ideal target for this degree of 4th wave is in the 2100-2200 region, and I have provided detailed analysis in the past as to why that is my ideal target for this 4th wave. And, I believe that target is still sitting out there and waiting for us.
Fourth, while it is certainly possible the market can top out around 2700 in all of this b-wave, I think the internal structure suggests that we can reach regions of 2800 or even higher. I have also explained this in extraordinary detail in many updates since before we even broke 2600SPX, and I have no reason to change my perspective at this time.
So, to summarize, I think we are in a b-wave rally in a larger degree 4th wave which still has lower downside targets to attain. But, I also believe the b-wave has higher targets to attain as well before we set up for the final decline in this 4th wave.
Now, let’s move into the more micro structure.
As I have also outlined, a b-wave rally takes the path of an [a][b][c] structure. Thus far, we have more than enough in place to consider the [a] was as having completed, and we have struck the top of our ideal target box for this [a] wave rally. However, we still have no real pullback to speak of to suggest that the [b] wave has completed. And, as I have noted, the standard target for this [b] wave would normally be the .618 retracement of the [a] wave, which is in the 2470 region. But, as it stands right now, I have no set up pointing that deep just yet.
Yet, the market has been consolidating over the 2600 region for the last 6 days. Ideally, I would like to see a break down below 2600, with strong follow through below 2580 to provide a strong indication that we are in a standard [b] wave pullback, targeting at least the 2550SPX region.
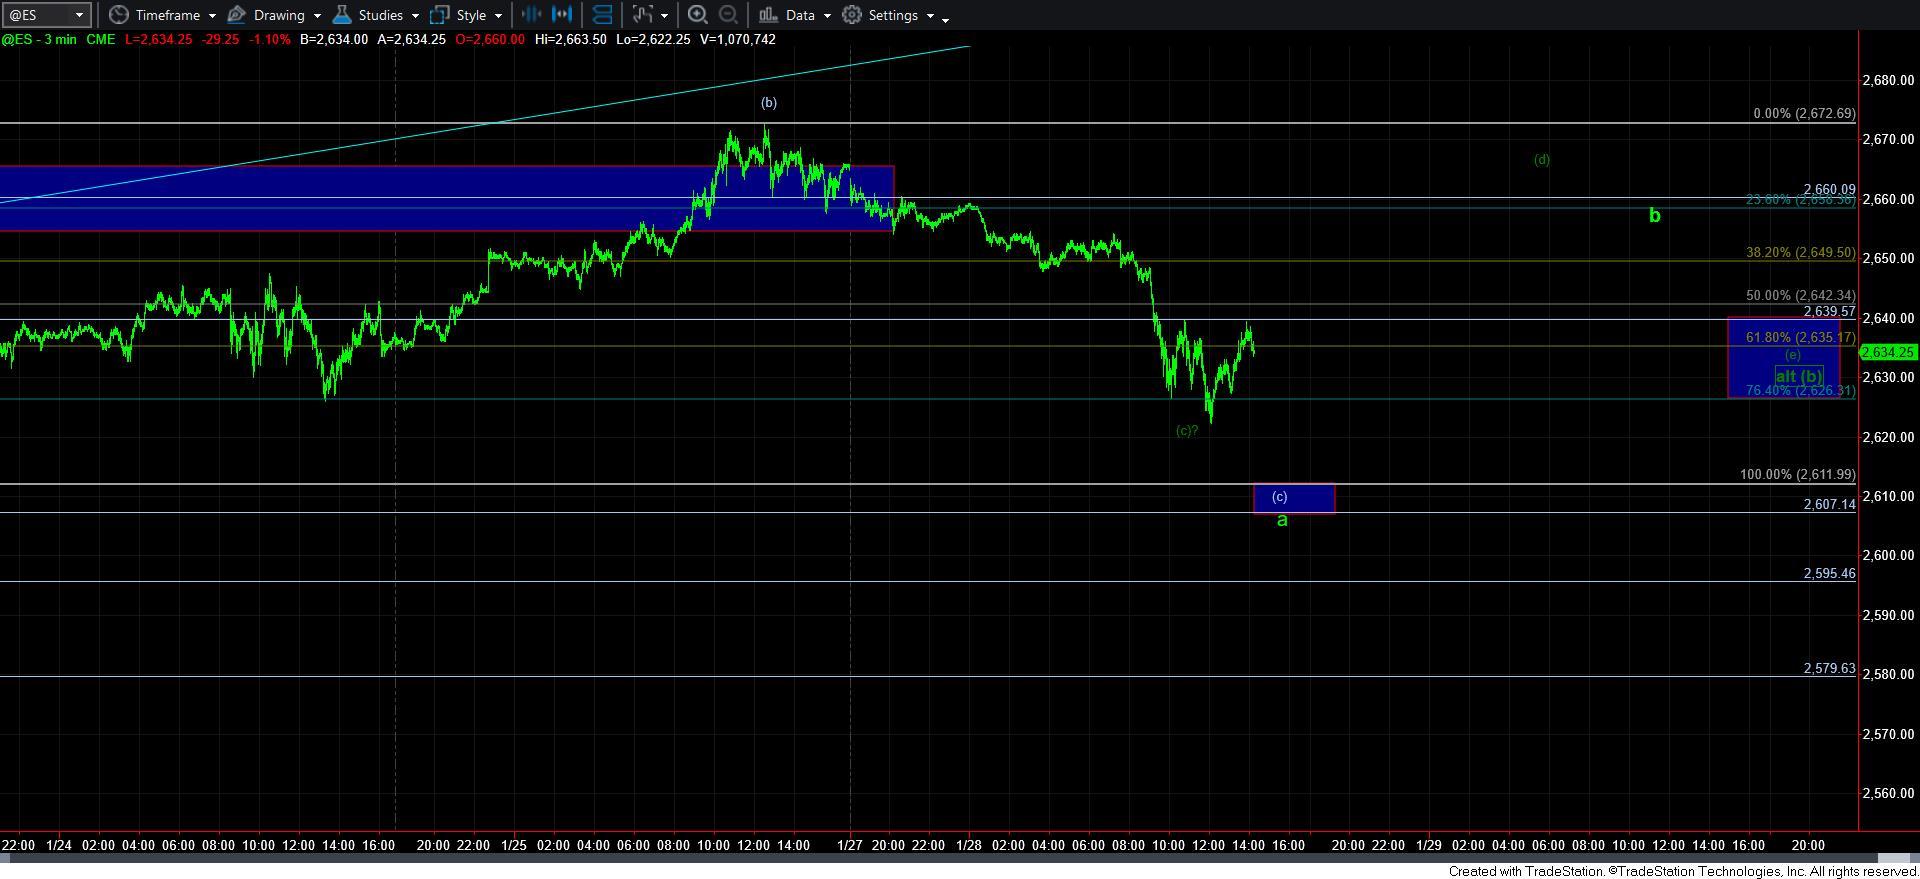
However, as long as we continue to consolidate over 2600SPX it means we are now approaching a period of time which can suggest that a [b] wave may complete as early as this week. While it is clearly on the short end of that potential, if the market continues to consolidate under 2675 region, and over the 2610 region, it can suggest this [b] wave may complete as a high-level consolidation in the form of a triangle. I have shown this potential in dark green on the 3-minute ES chart.
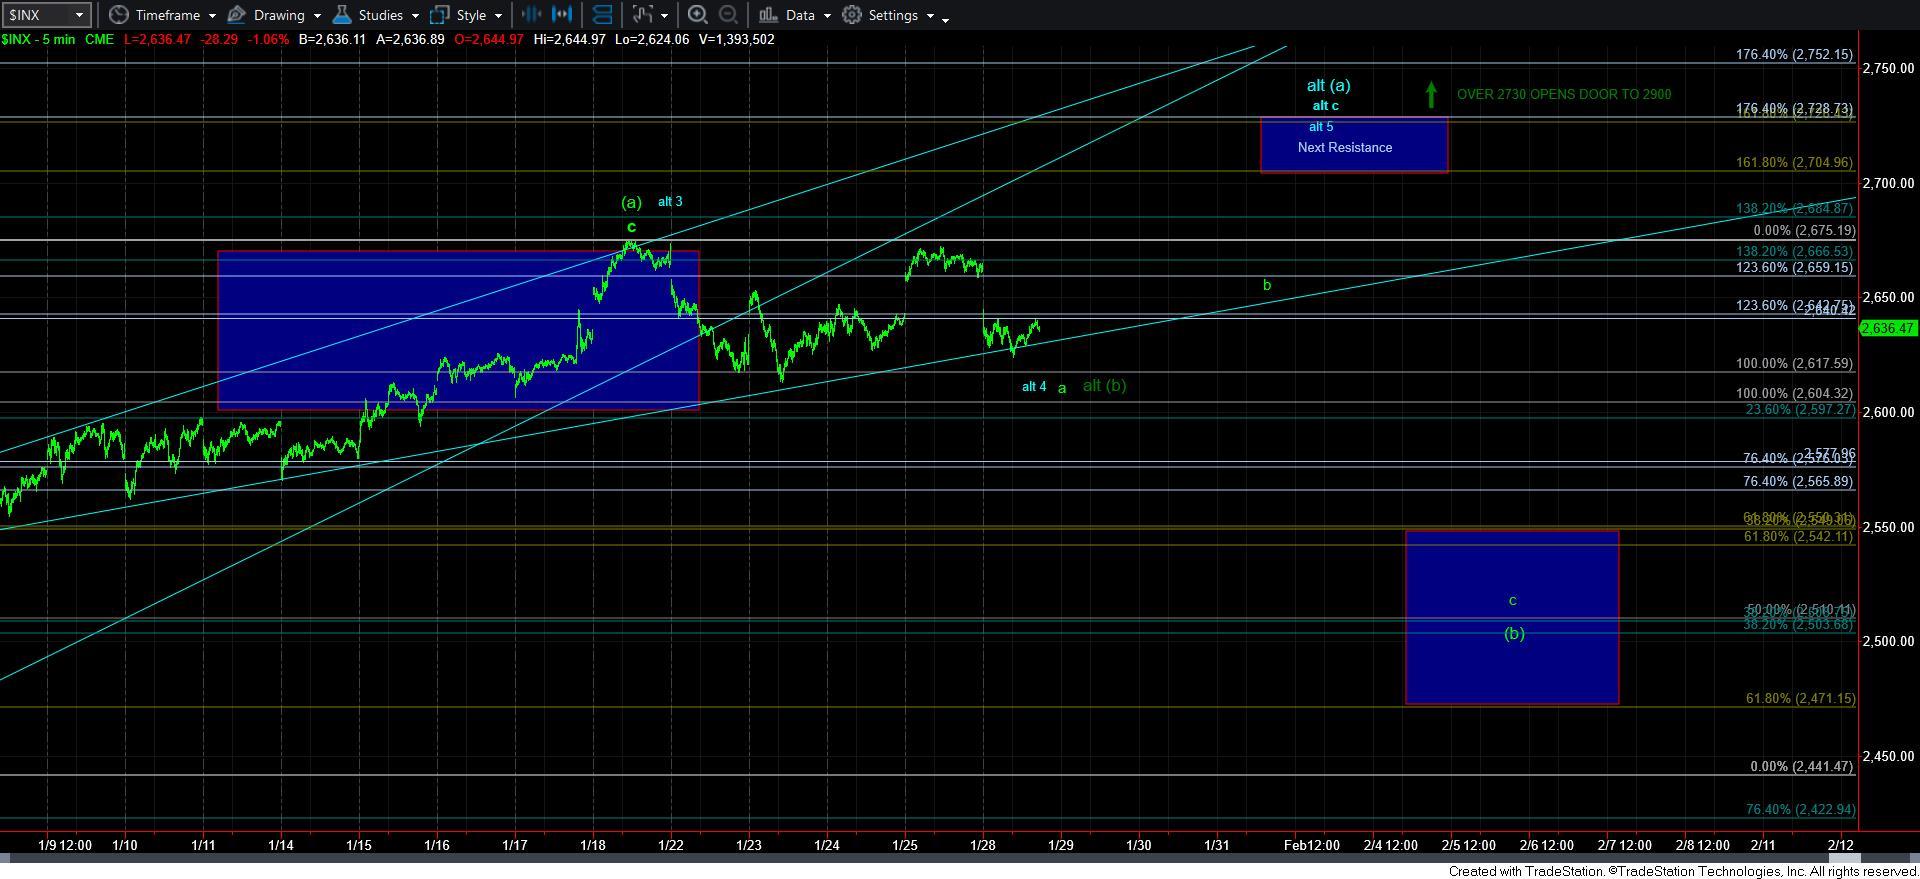
Should the triangle play out, then I do not think the (e) wave of that triangle will break below the 2625 region, which will point us up to our next resistance region in the 2705-2730 region (highlighted on the 5-minute SPX chart). How the market reacts in that region will tell us all we need to know about this b-wave rally. You see, that region can even represent a higher [a] wave target, and can then provide us with a [b] wave pullback. That is why the 2625 region of support will be of utmost importance if this triangle does play out. As long as we hold over that support, we can point as high as the 2900 region for this b-wave, as [a]=[c] points to the 2900 region if we have a [b] wave triangle.
At the end of the day, these are the points I want to highlight.
1 - I don’t think we have completed this larger degree 4th wave, and am still looking down to the 2100-2200 region.
2 - I don’t think we have completed this b-wave rally. And, how soon we rally in the [c] wave of this b-wave rally will depend on whether we can break below 2600 in the coming week or so.
3 – My primary expectation, based upon standards, is that we should see a drop below 2600SPX for a [b] wave pullback within this b-wave rally.
4 - However, if a triangle takes shape up here, then 2625 will likely be the support we have to watch on all pullbacks from hereon. A triangle may suggest that the [b] wave may be completed, and we can head to the 2900 region, with the 2625 region being main support in the coming week.