In The Support Zone
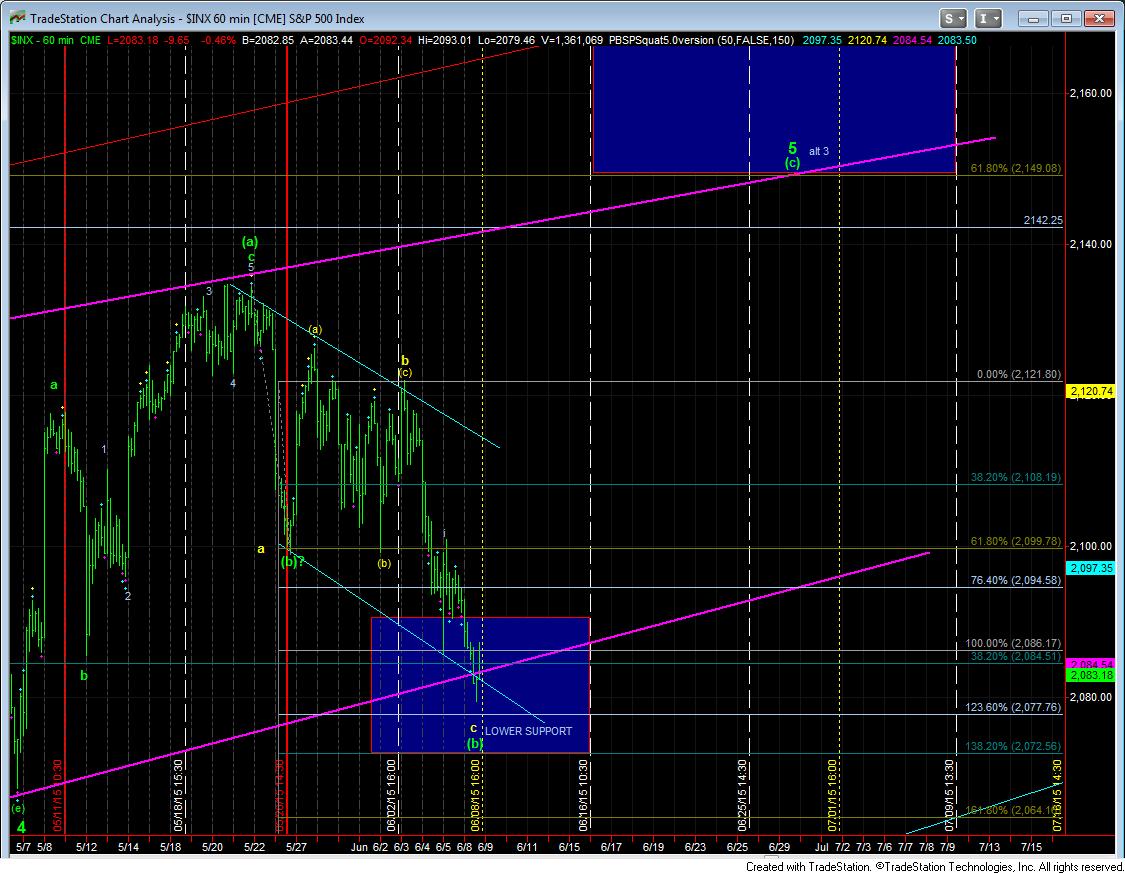
With the break down below Friday’s low, the market gave us a strong indication that it wanted to drop lower to our secondary 2072SPX support level. Currently, there are clearly enough waves in place to consider that all of this (b) wave corrective decline has completed. However, what we still do not have is a signal that the market has turned.
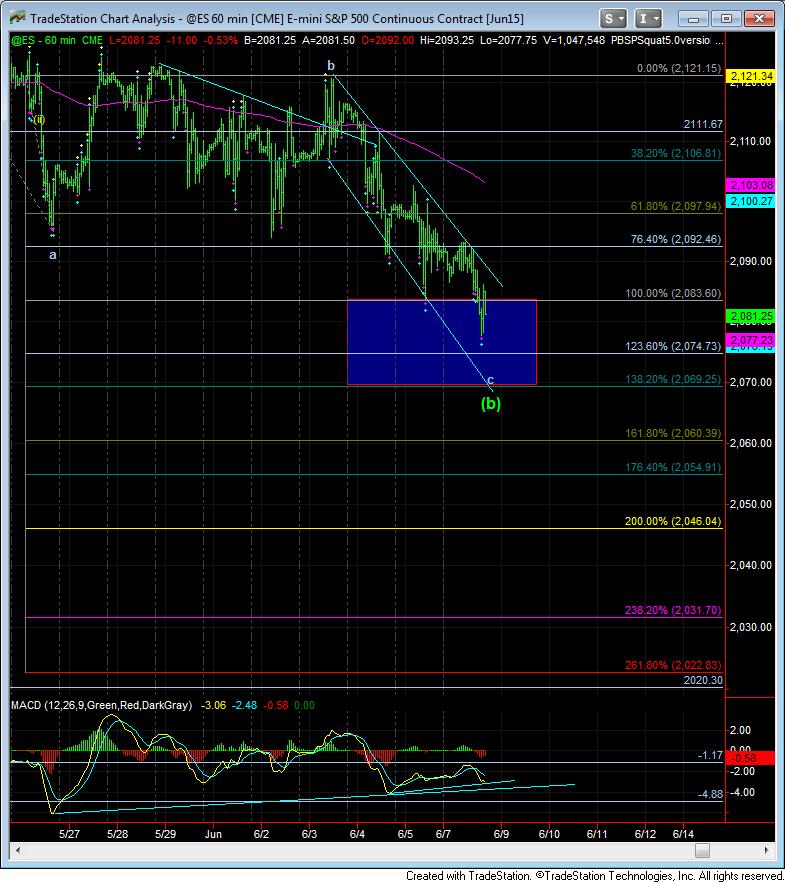
I am attaching the 60 minute ES chart at this time not for the wave count, but for the technical indications and the downtrend channel. When we review the technicals to determine if a pattern is impulsive or corrective, one of the key indications is that a 3rd wave has very strong technical indications, whereas a corrective c-wave is often weaker than the initial a-wave down. As we can see on this 60 minute ES chart, the initial a-wave drop was clearly stronger than the (c) wave drop. If the market had truly been in an impulsive structure down, then the secondary drop would have the stronger technicals. Clearly, that is not the case, and it supports our perspective of this being a corrective pullback.
However, even though it is a corrective pullback, it can continue lower and lower, until it provides evidence that it has finally turned. Clearly, we would need to see the market break out of the downtrend channel we have been in for the last 4 trading days. And, ideally, we want to see the market break out of that channel in an impulsive fashion – with 5 waves off the low – to signal that we are on our way to the 2150 target box above.
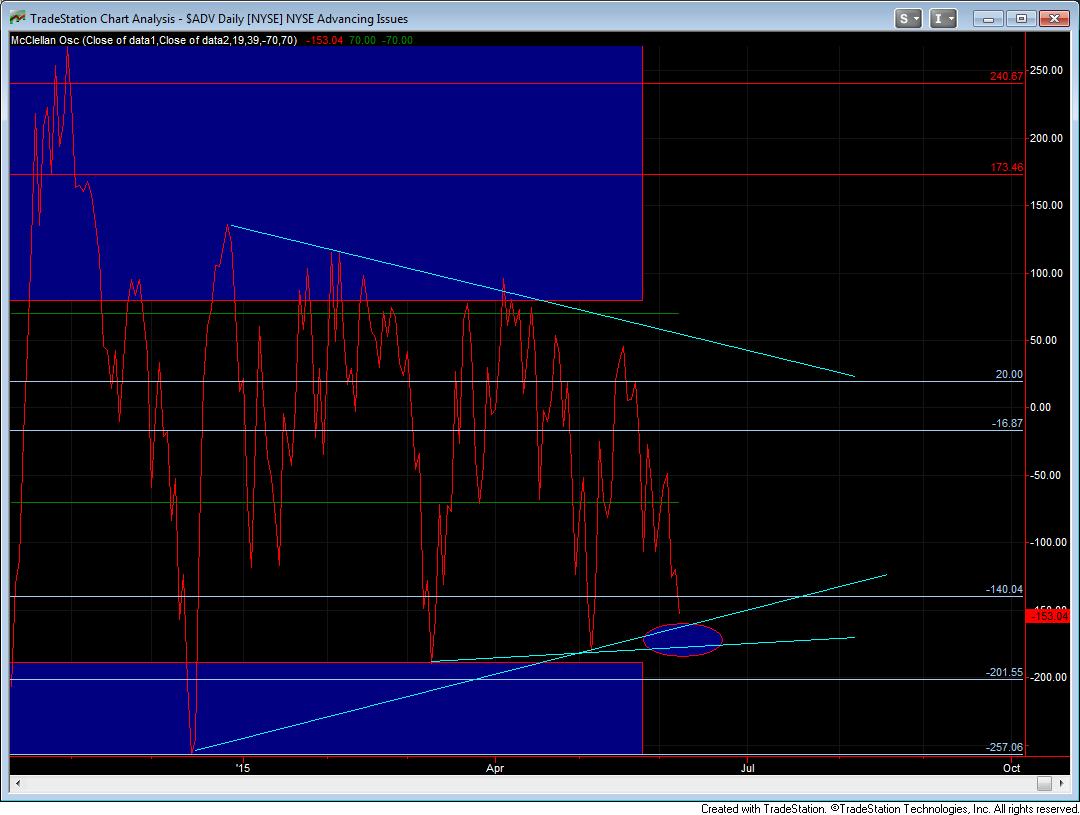
The other indication that we have been following is the McClellan Oscillator, which is now clearly at support. Ideally, we would want to see support held, and the market breaking out to the upside out of this triangle.
I would also like to remind you that today is a Bradley model turn date. Therefore, it is yet another clue I am considering as I looking for a potential low in this region of the market.
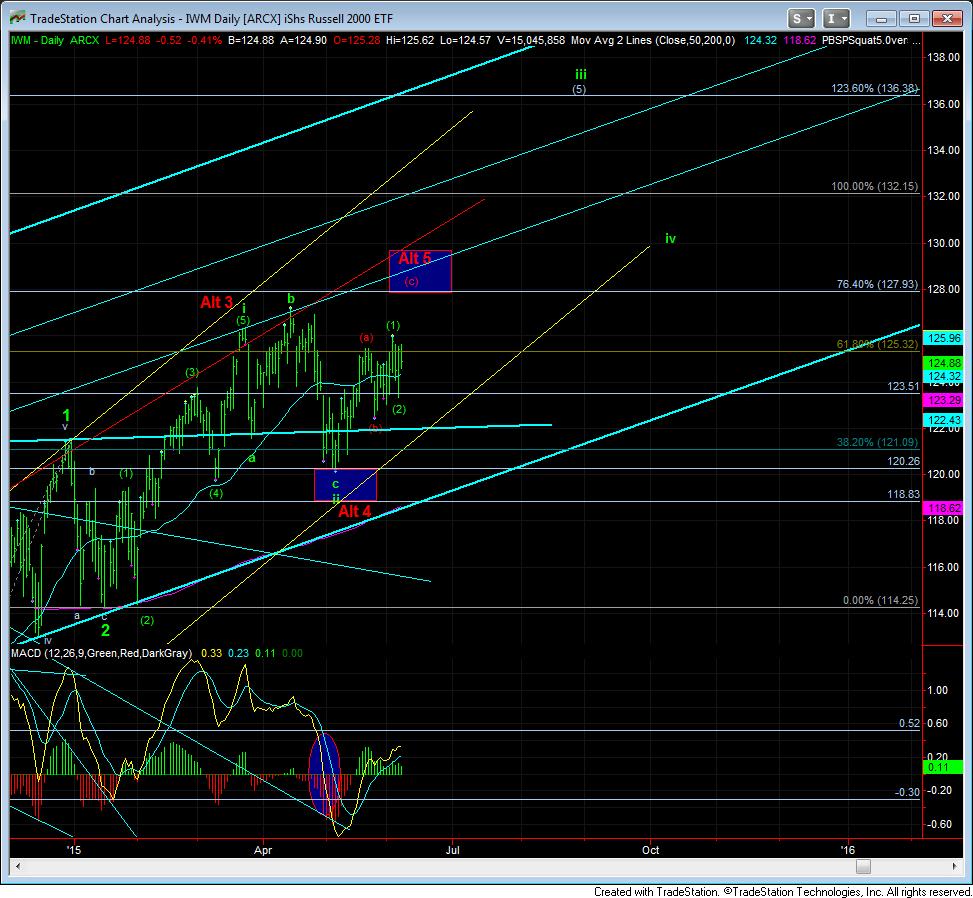
Lastly, while I have noted that the SPX should not break the 2065/70 region of support for me to remain bullish for at least one more high, the IWM has remained quite bullish in its own right. Therefore, as I have mentioned before, not only will I need to see the SPX break support for me to suggest that we have finally topped and begin looking to the 1800 region, I will need to see the IWM confirm that it has also broken its support below 120.25.