In The “Danger Zone”
I am putting this update out early since we are now clearly within the target zone we set many months ago. And, I think you should be considering your positioning very carefully right now.
For those that have followed my work through the years, you would know that I am not always right in my primary analysis. Yet, we do have a very high percentage of correct calls, with most of our members tracking us at around 70% accuracy.
Yet, one of the most important aspects of our work is not only our correct calls. In fact, one can argue that knowing relatively quickly where you are wrong in your primary analysis is even more important.
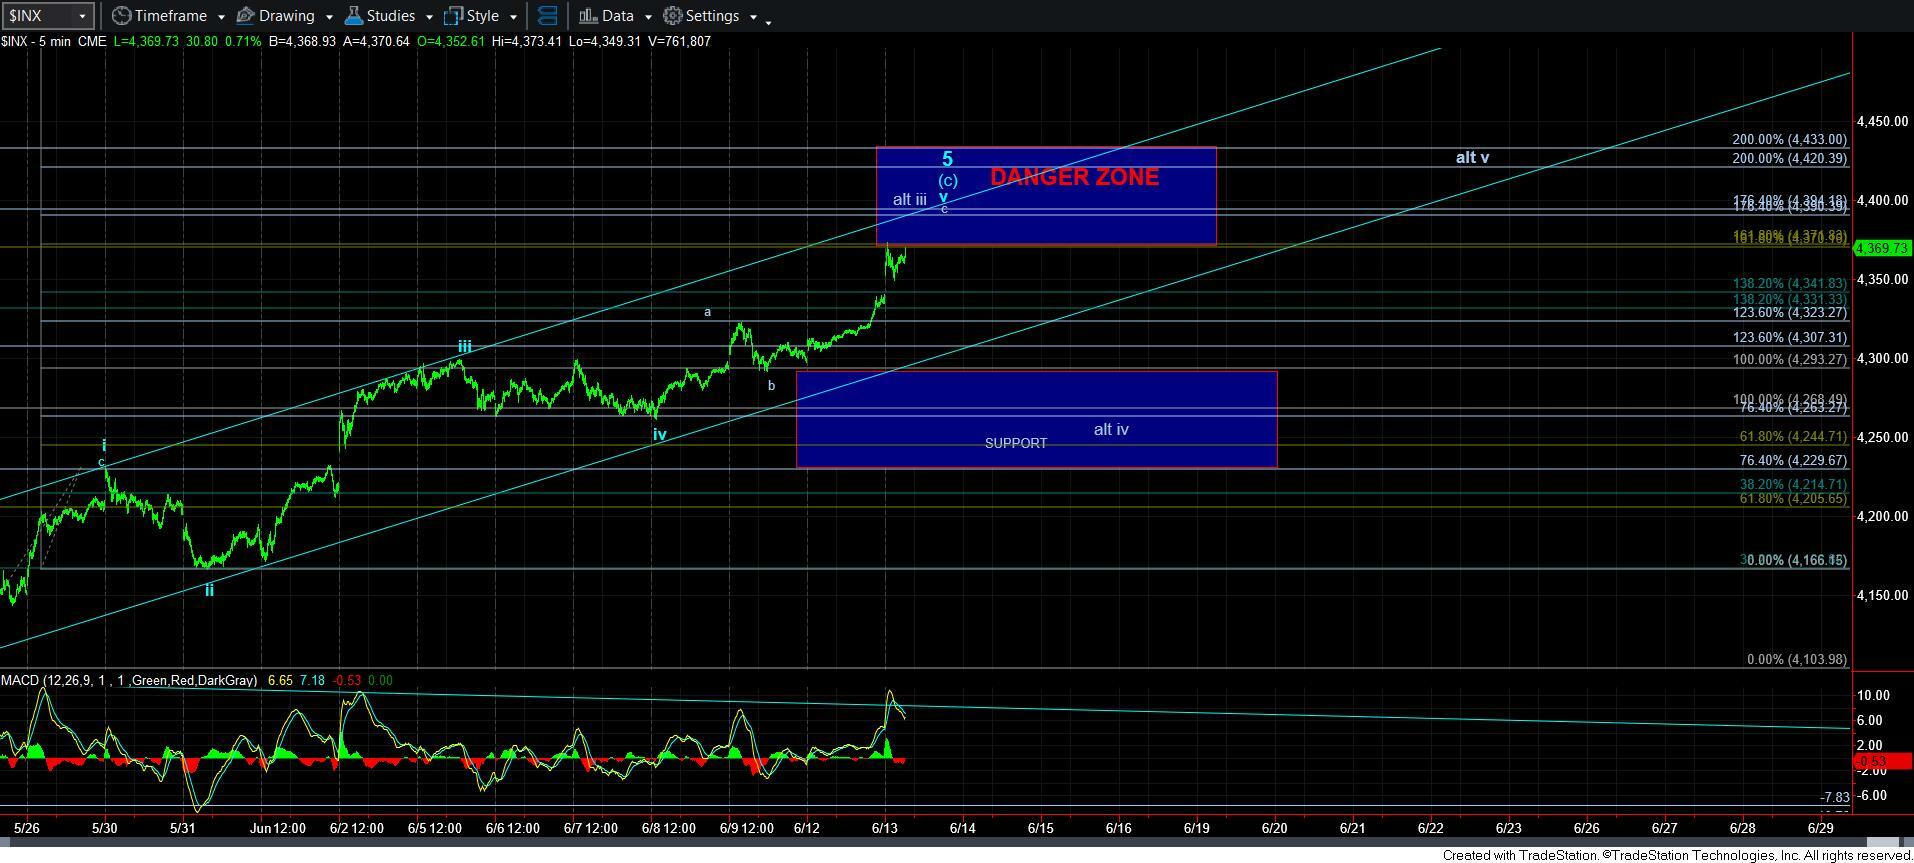
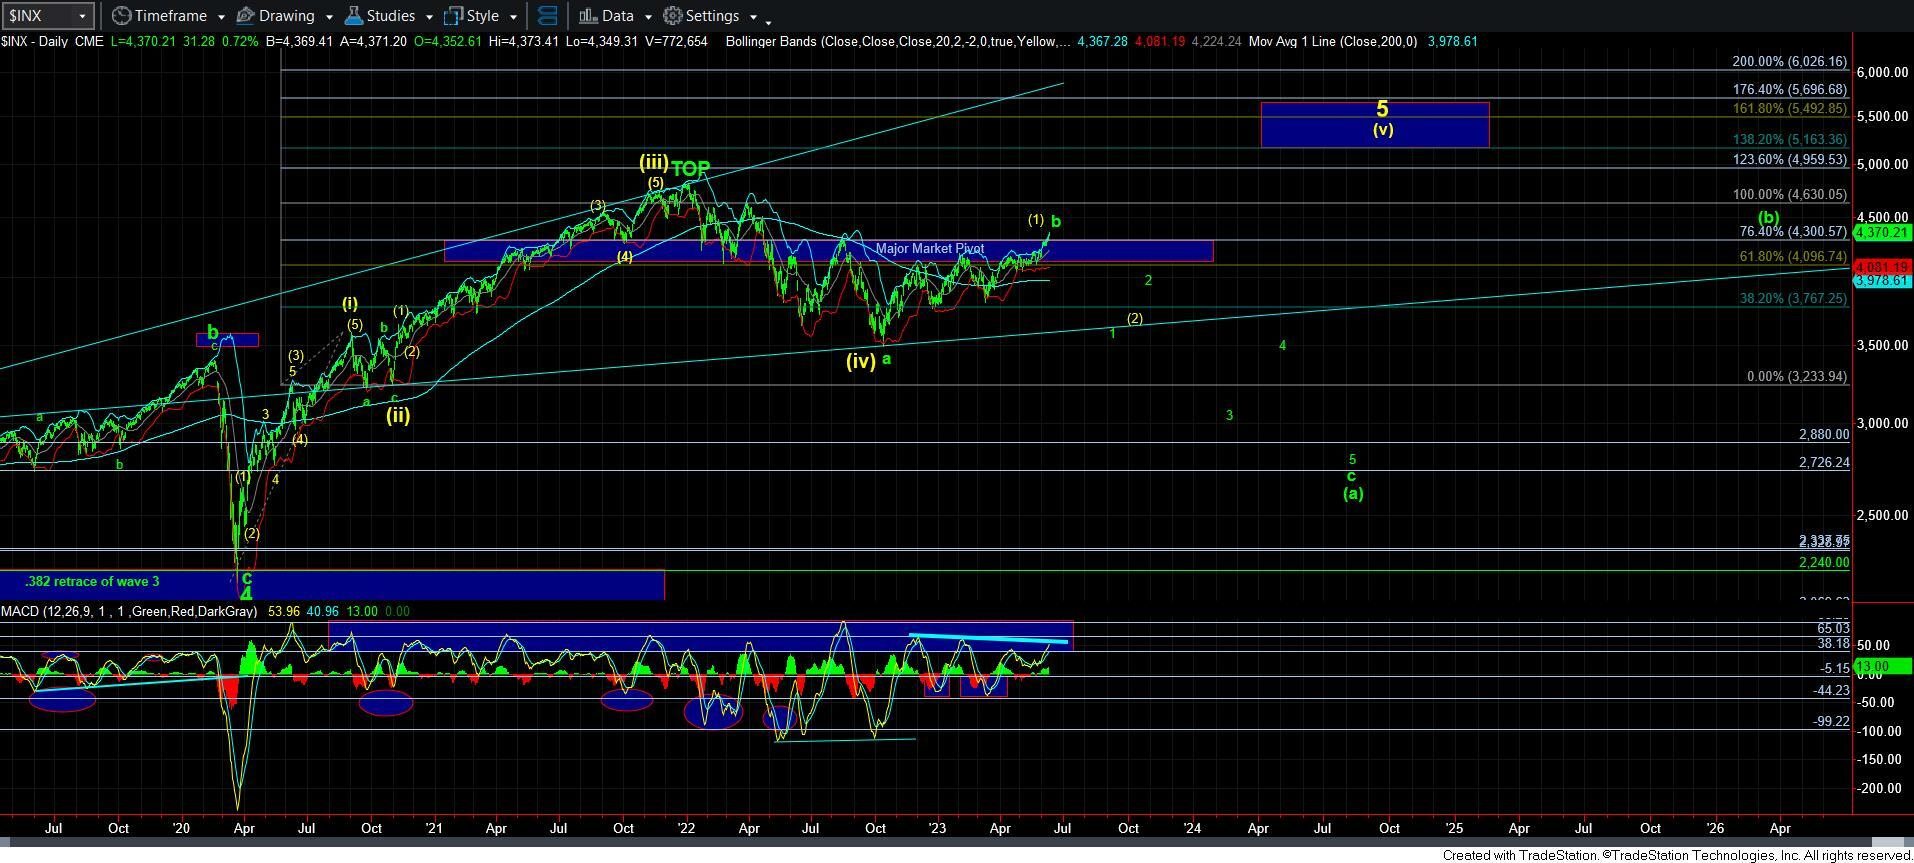
As we stand right now, we have reached the target we set out many months ago. The one issue I have in my analysis right now is that the structure of this rally is not terribly clear as we are hitting our target. If we would have completed a standard Fibonacci Pinball 5 wave [c] wave, then this would have been a much easier discussion. But, that is not what the market has provided to us. Yet, the market has given us relatively strong parameters to track.
As I started this update out by saying, clearly, I can always be wrong in my assessment, and I am always doing analysis to identify where I can be wrong. So, I want to note something that I saw today. The MACD on the daily chart is “attempting” a push higher. While this is really only the first day it is making such an attempt, it can easily be a false move higher, especially if the market turns down over the next day or two. For now, we still clearly have negative divergences relative to the February and December lower highs, even though it is attempting to take out the April high. But, it is something which needs to be watched.
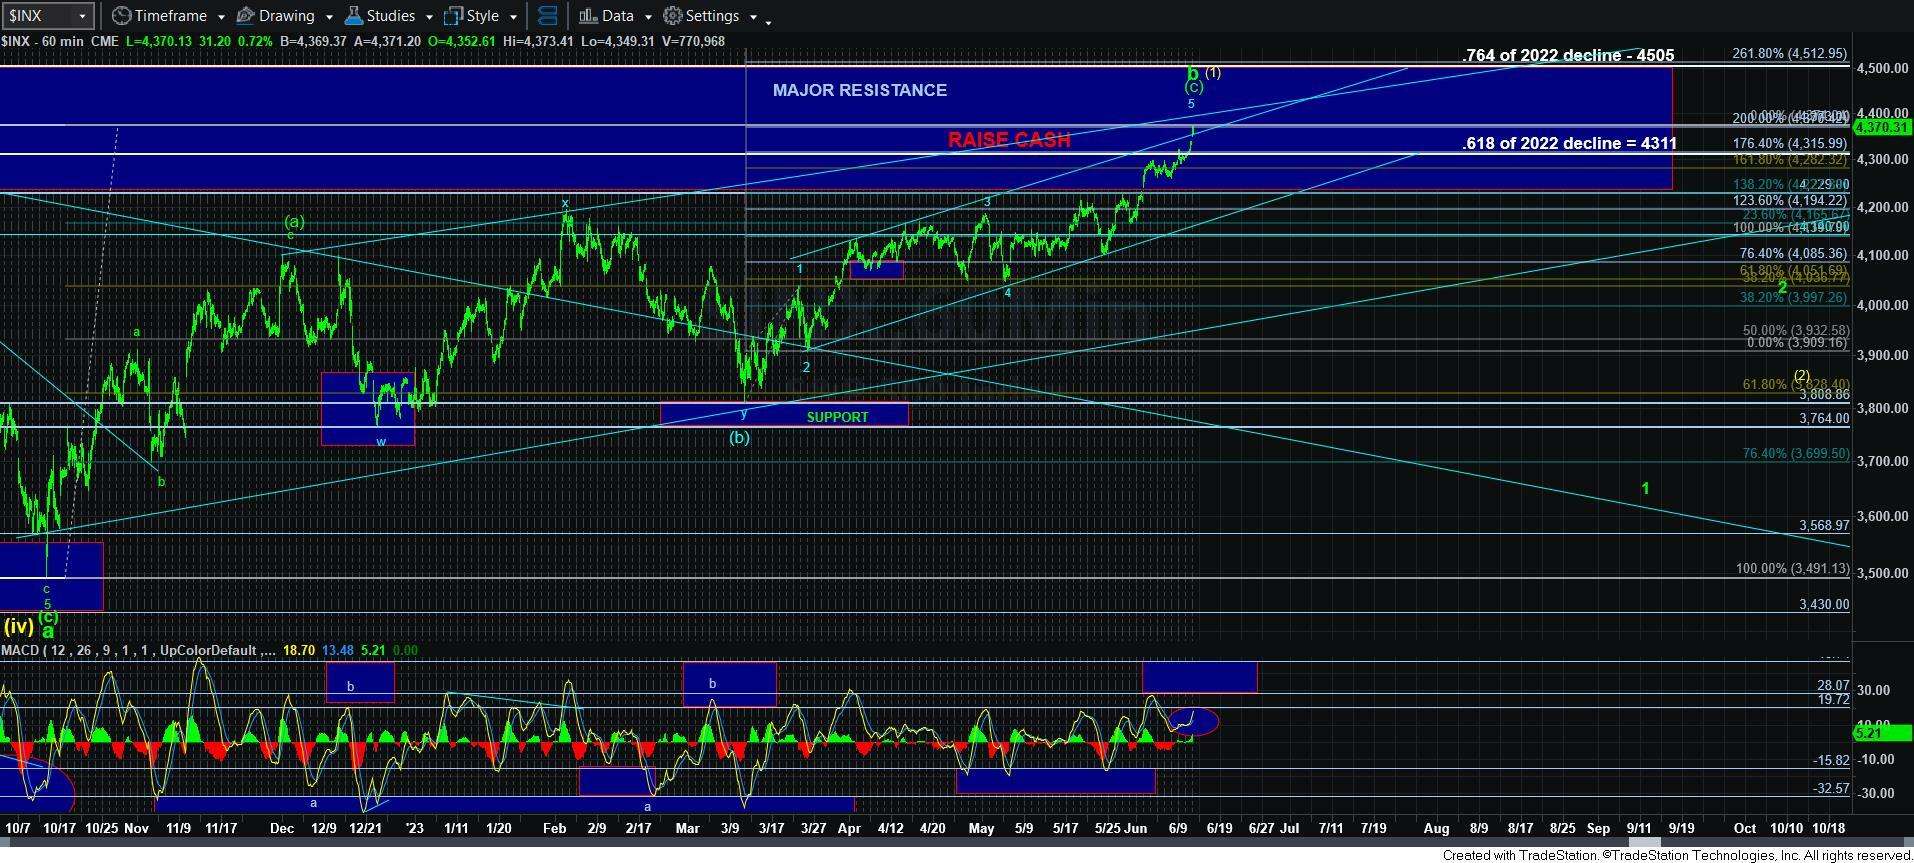
As far as the current rally, you can see that I am counting this rally as completing all of the wave 5. Again, the structure since the March low is not at all clean, so it does leave some questions in my mind. But, as long as the market respects the upper resistance noted on the 5-minute SPX chart with a top end in the 4420/30SPX region, I am counting this as completing the rally which began in October of 2022.
Of course, due to the nature of the rally, I am leaving the door open for this only being the wave iii in this diagonal, with a iv-v yet to come. That is the alternative count presented on the 5-minute chart. The main reason I am leaving this potential open is because we did not see overlap between wave iv and i, which is one of the common hallmarks of a diagonal. Non-overlapping diagonals do occur, but they are much more rare.
Moreover, one of the other hallmarks of an ending diagonal is that we often see a spike high, followed by a strong reversal. Clearly, we have not yet seen that signal either.
Therefore, it now tells me that I need to see a sustained break below the high of wave i, which is in the 4230SPX region. Normally, we can see a spike of the top of wave i, followed by a reversal to begin wave v in a standard diagonal. But, if we see a sustained break (based upon the structure with which we drop down) of the 4230SPX region, that is our signal that a top has likely been struck, and that a larger pullback will ensue.
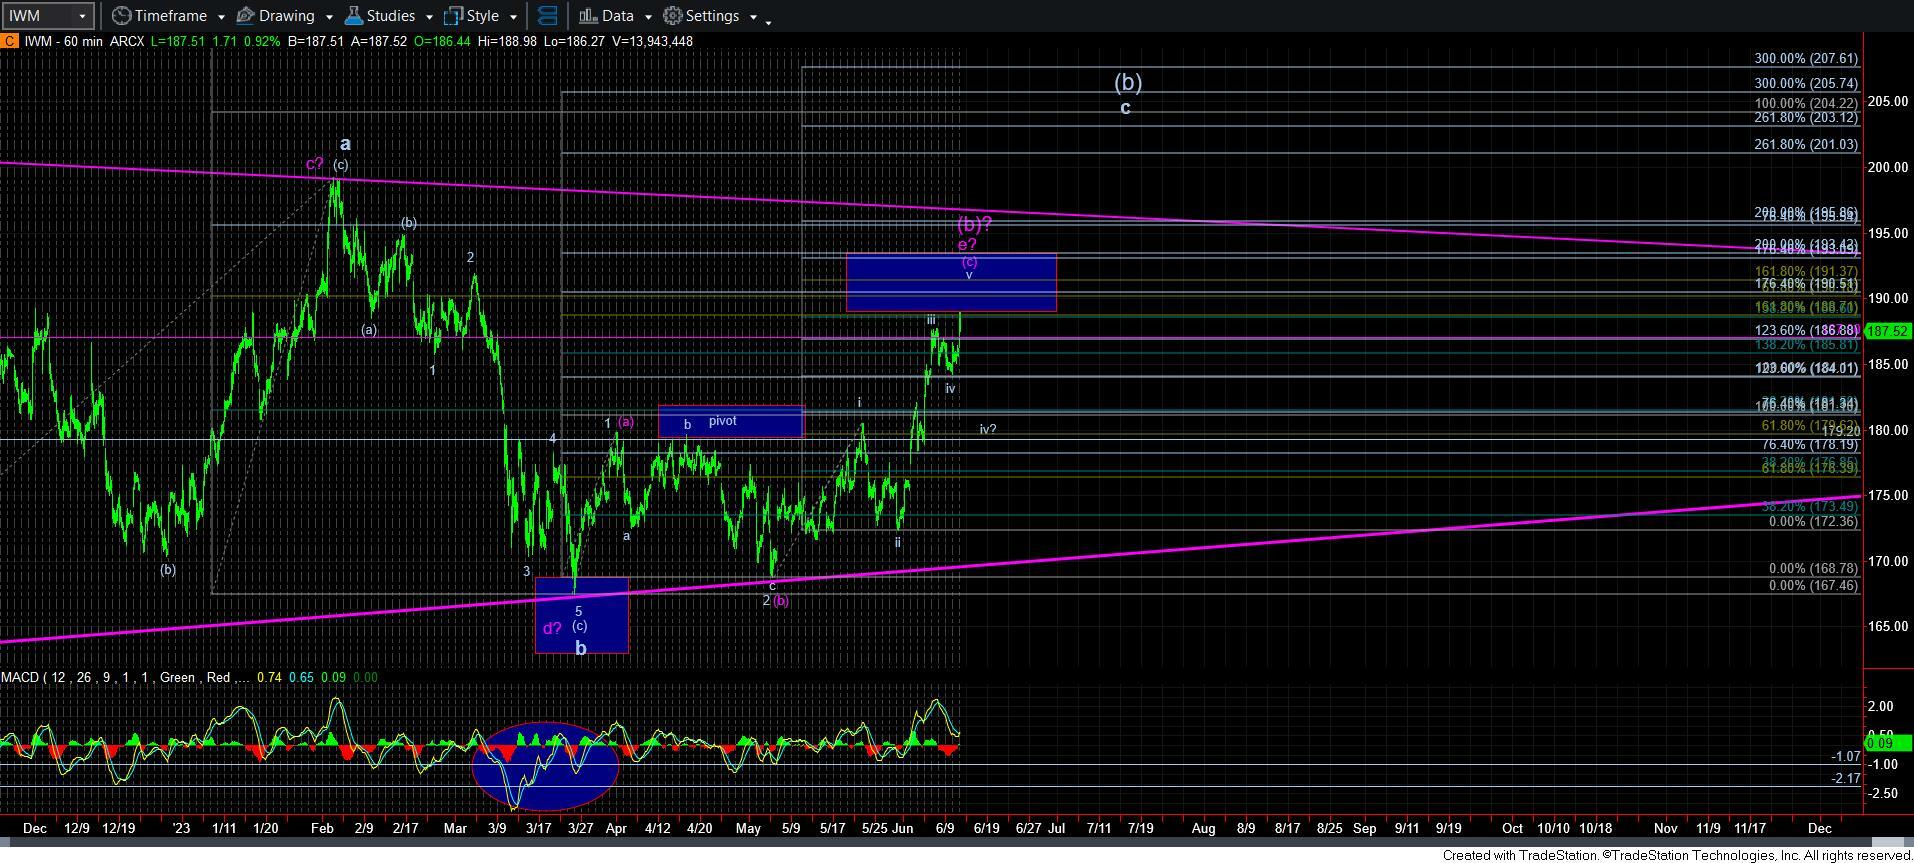
Also, take note that we have the exact same issue in the IWM. While I set our target many months ago for the IWM as well, we have finally gotten there. And, today, I narrowed that target. But, it too did not provide any overlap with waves iv and i, which leaves the door open here is well. And, when both these structures are showing the same thing, it keeps me on my toes to expect that they both may yet see the overlap before a top is struck.
In the meantime, everything that I have stated over these last few weeks remains applicable. It is your job now to scrub what you own in your portfolios, and to consider raising cash in those charts that are clearly completing their upside structures. And, you should be tightening your stops for those charts which still show higher potential.
In fact, over the last 24 hours, I have been doing that myself. I have personally raised further cash (I am a relatively conservative investor), and have tightened the stops of those longs that I still want to hold, as they still present with potential to head a bit higher.
To this end, I would strongly urge you to again read the weekend update I posted on the SPX on June 3rd entitled “It’s Time To Decide Who You Are.”
As far as what will get me to reconsider this “topping” potential in the market, well, if we see a direct move through the resistance noted on the 5-minute SPX chart (4420/30SPX), then I will likely have to reconsider whether we are in a larger [c] wave pointing us to 4500-4600SPX sooner rather than later. For now, this is not my expectation, but I do have to maintain clear parameters to watch.
But, at all times, please remember we deal in probabilities, and not certainties. Currently, the market has now finally reached the point at which I believed we would strike with a relatively high probability. And, I also believe we are completing a topping pattern. But, we will be watching very closely as to how the market reacts, as we have very distinct signs we want to see to mark the completion of an ending diagonal, as well as very clear parameters on resistance and support we will be watching.