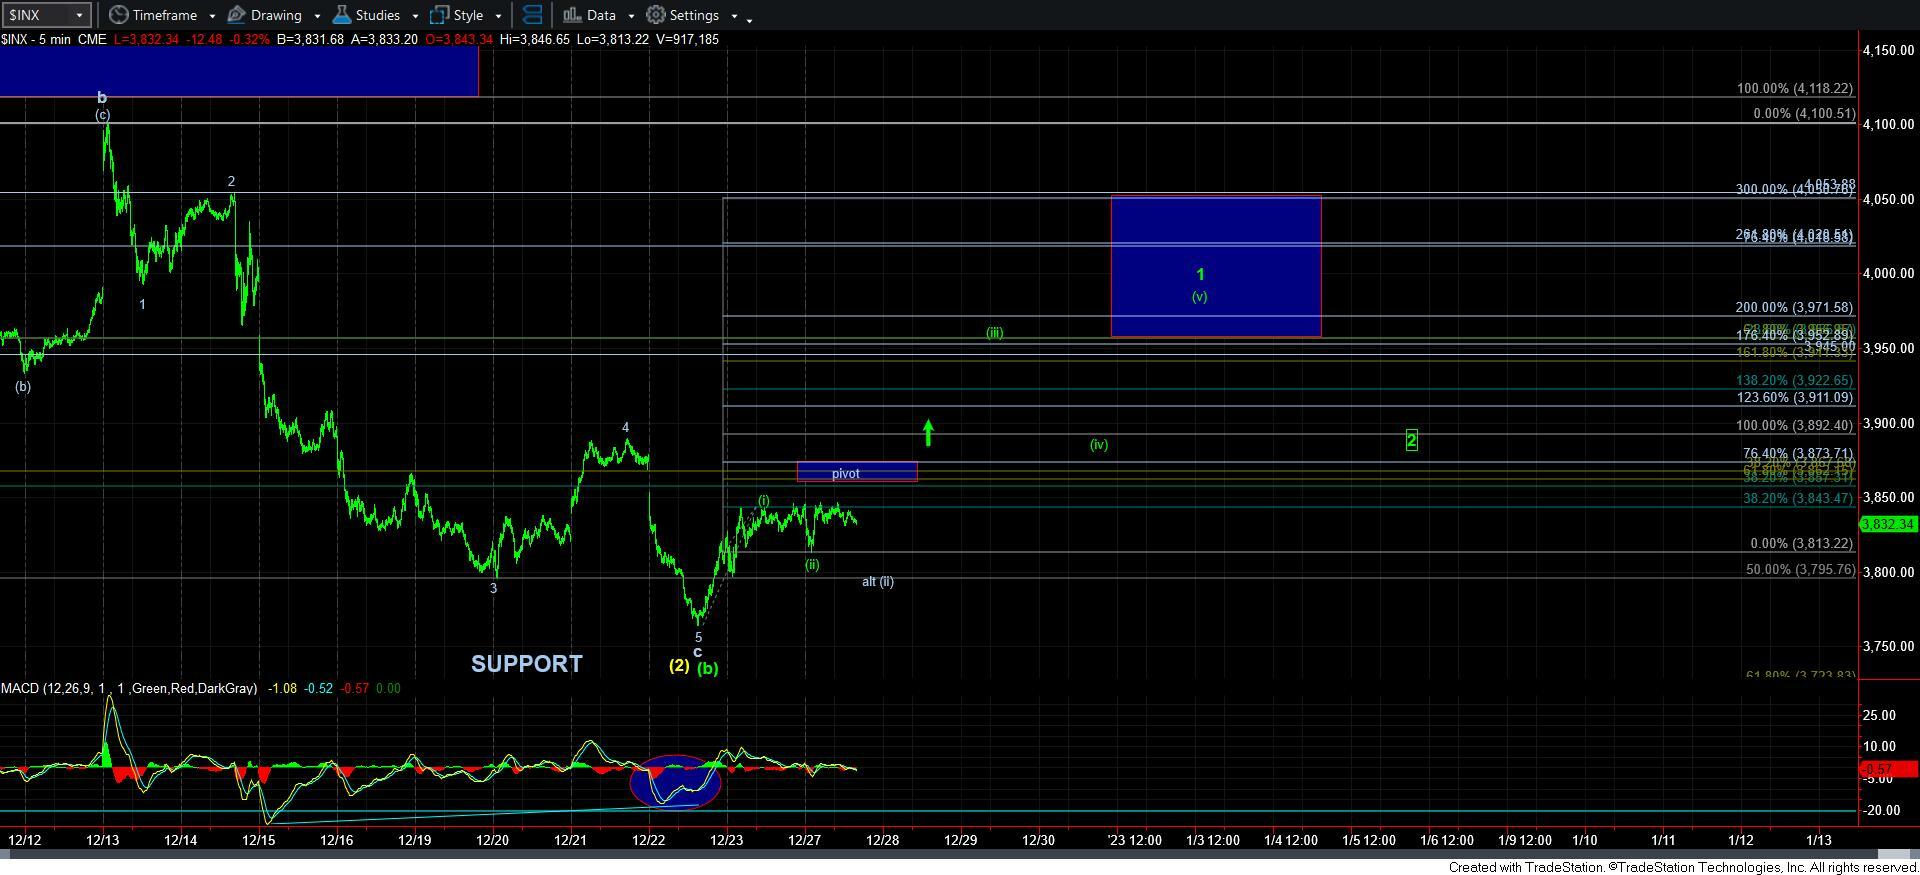
In Search Of Wave [iii]
I wanted to start this update with a discussion of my process and how I use the SPX and ES charts.
First, I want to note clearly that my primary view is based upon the SPX charts. That is because it is much more trustworthy, as certain actions can be seen in the ES during very low volume hours that really have no bearing on the overall wave count.
So, the question many ask is why I use ES at all? Well, we often see gaps in the SPX charts, and the ES fills in those gaps with its overnight action. And, that is how I primarily use the ES action – for informational purposes.
Therefore, when there is disagreement between the two charts, I will always side with the SPX structure. But, sometimes the ES does give me warning that something may be askew.
Last night, the ES seemingly “broke out,” only to come right back down before the open to the point wherein the market opened just about flat. So, I really cannot rely upon the ES overnight action, as it seems the SPX is more reliable. But, when the market had an opportunity to follow the ES up, it does make me a bit more cautious for now, at least until we complete 5-waves up for wave 1.
So, as it stands right now, we have a [i][ii] potential structure in the SPX, as you can see on the attached 5-minute chart. Based upon this structure, I would assume that we would begin wave [iii] by tomorrow if the market has the intention of beginning a [c] wave rally. For now, this remains my primary wave count and market expectation.
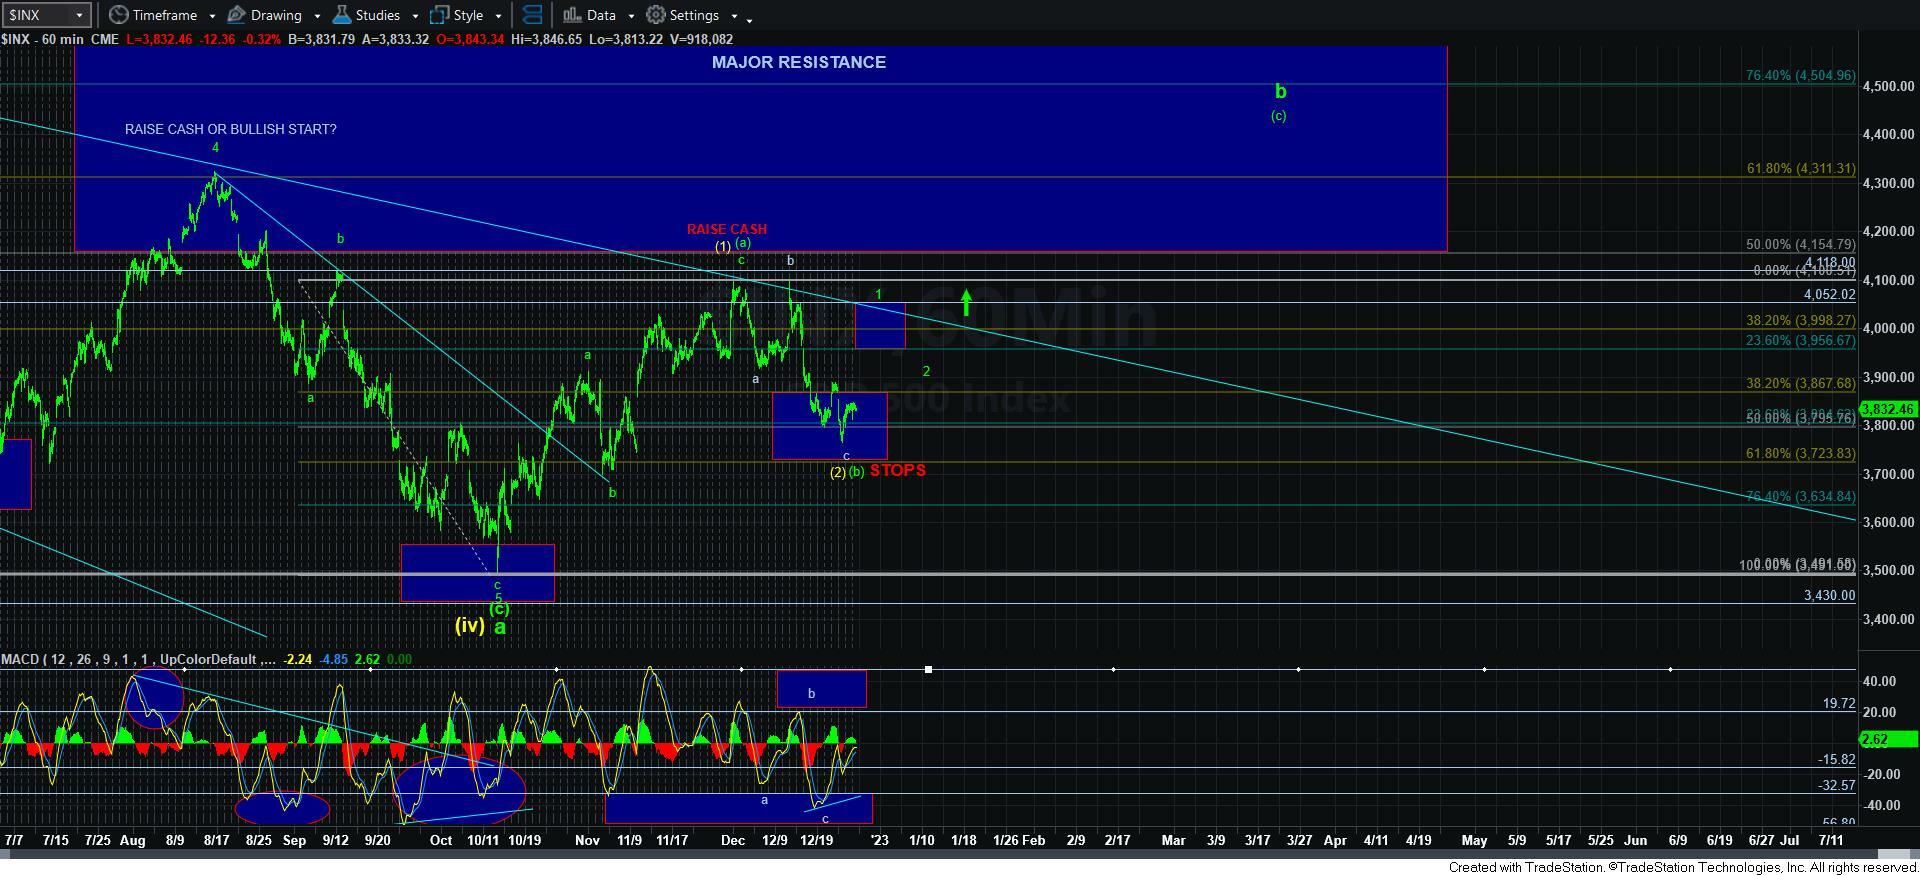
It would take a break down below last week’s low to get me concerned about the potential for a [c] wave rally to 4300.