Important Point In The Market
While Mike will write the regular afternoon update later, I wanted to take a moment to discuss the bigger picture, as we are at a pivotal point in the market.
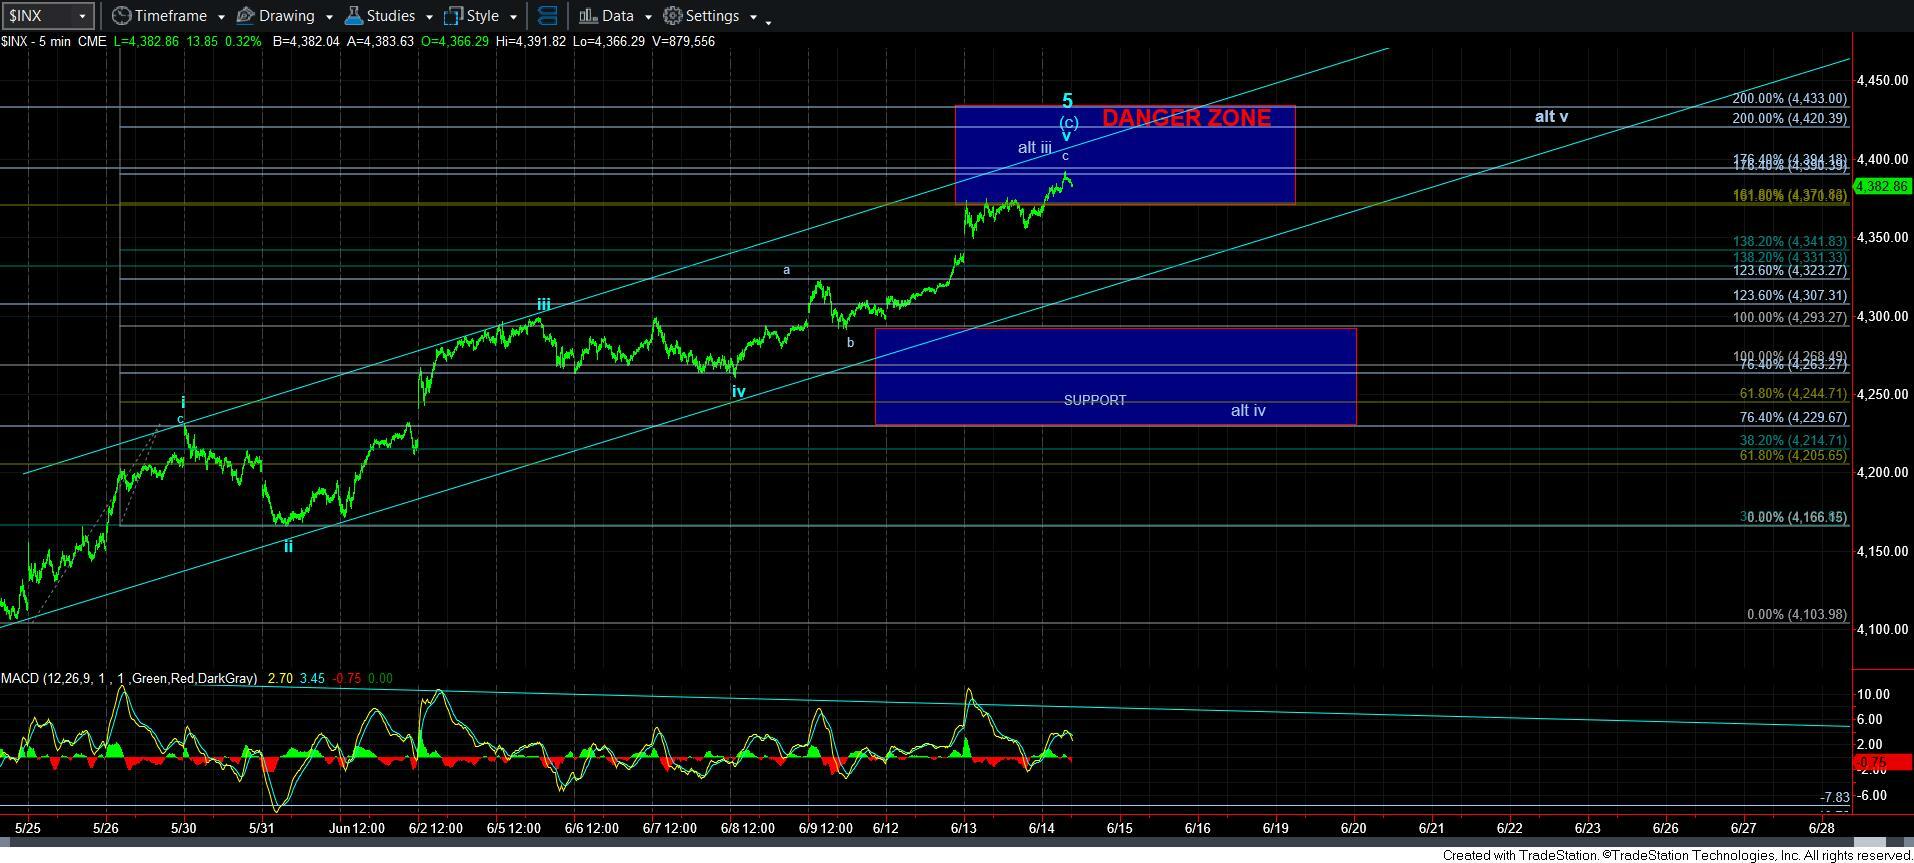
With the market now pushing towards the top end of our resistance region for this rally, I outlined a bullish alternative this morning in the live video, and I wanted to present it in writing as well for those that did not see the video.
First, I want to start out by noting that Zac has said whenever the market pushes us to an extreme and forces me to propose another alternative, that is usually marking the point at which the market turns. We will see if this is yet another such instance.
I have noted many times throughout the course of the last year that I have had a major issue with calling the top to the bull market back at the end of 2021, since it really counted best as 3 waves up off the Covid Crash low. And, for that reason, I was going to keep a VERY open mind to us getting to that 5000+ region before the real bear market began in earnest. Yet, the reason I was maintaining the green count as my primary was for risk management purposes.
With the market now pushing on resistance, I want to present an alternative that can be a more direct path there. But, I am also going to outline the major issues I see with this alternative, which is why it remains an alternative.
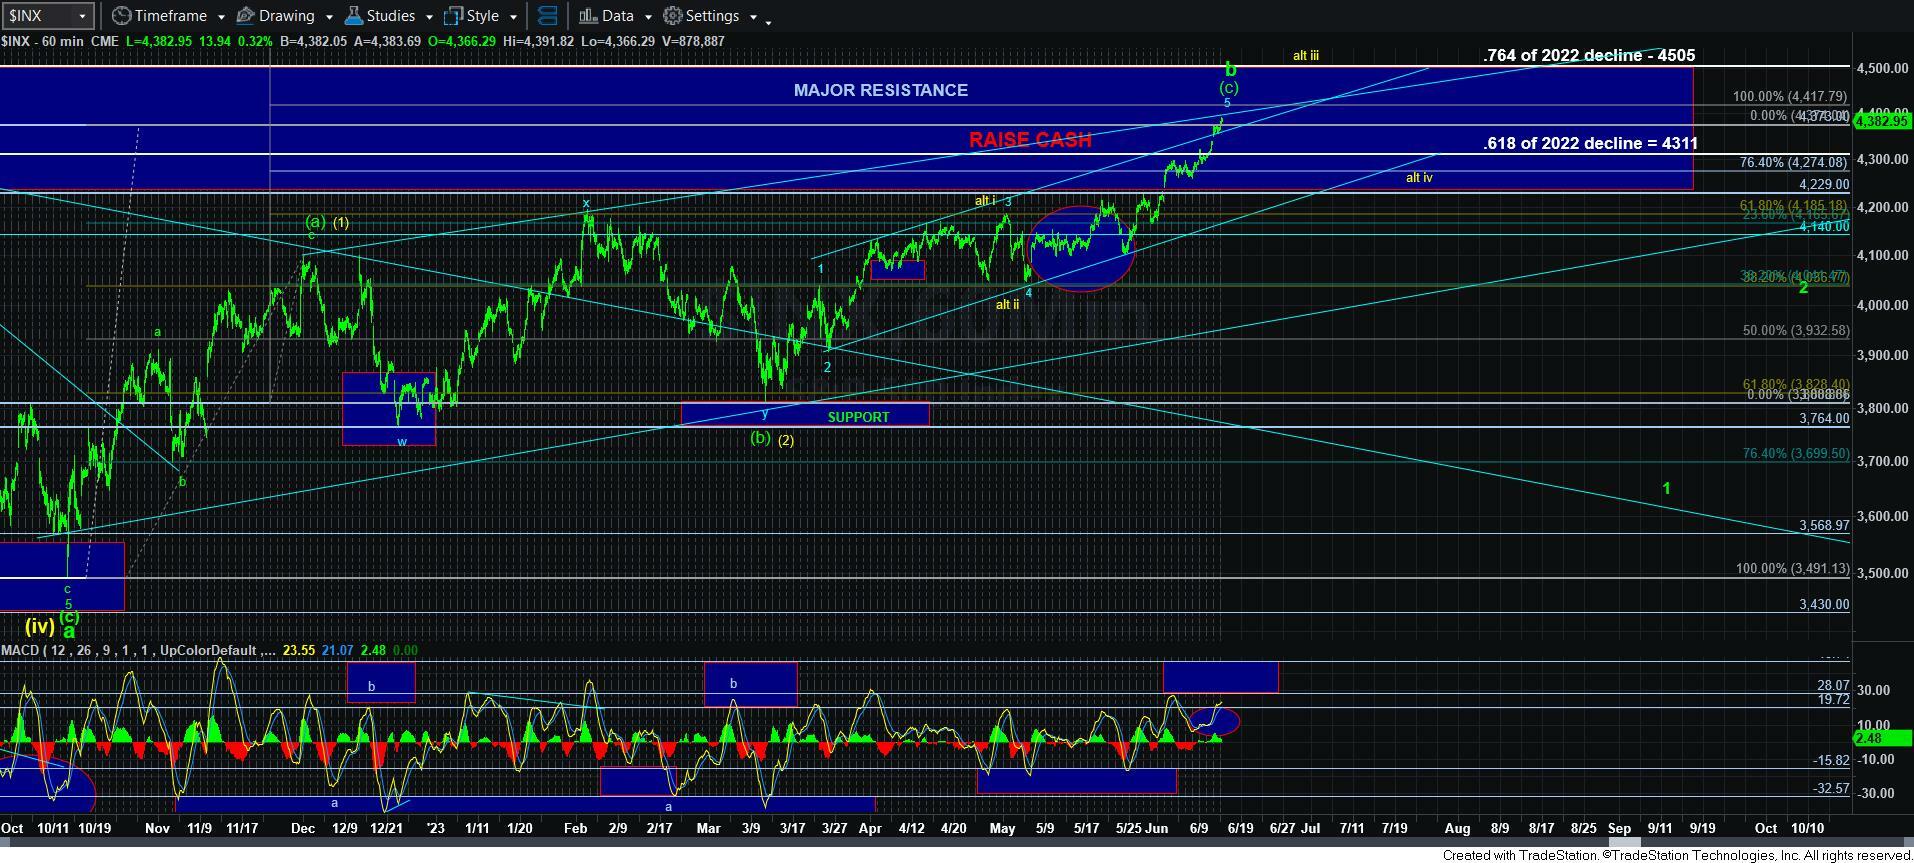
If you look at the attached 60-minute chart, you will see I have labeled a yellow [1][2] instead of the [a][b] as an alternative. That would then provide us with a wave i and ii within wave [3] as shown in yellow as well. And, that would suggest we are now in wave iii of [3]. And, the market is certainly acting like it.
Yet, allow me to present the major problems with this count. First, it would be a VERY forced wave count to call yellow wave [1] an impulsive structure, as even a leading diagonal count would be pushing the bounds of leading diagonals. This is the major reason I did not adopt this count from the beginning.
Second, what is labeled as the yellow i-ii has many issues with it as well. The wave i has very unusual internal structure and proportions. And, the wave ii is almost non-existent, and clearly no where near what would one see as a 2nd wave. Furthermore, even the start of what would be yellow wave iii seems to be a rather clear 3-wave structure.
Lastly, all the sentiment readings seem to be strongly indicative of a market top in the very near term.
As you can see, the view that we are in wave iii in yellow at this time is very low based upon a number of factors, as they currently present. So, what will force me to adopt this perspective?
Well, the 4420SPX region is where the 1.00 extension resides. That means that as long as the market remains below 4420/30SPX, then I am maintaining the count as shown as my primary.
However, if we were to see a direct break out through that resistance, then I may be forced to assume that we are indeed in wave iii of [3]. So, how would we adjust at that point?
Well, we did rather well in maintaining a bullish bias until we got to this danger zone. And, I still very much view it as a danger zone until the market proves otherwise. And, if it does prove otherwise, then once wave iii of [3] tops, likely around the 4500SPX region (around the 1.236 extension of waves [1][2]), and if the pullback therefrom is clearly corrective in nature, then I would view the 4275SPX as the target for wave iv of [3] (the .764 extension of waves [1][2]), and a potential buying opportunity, with a stop at just under the 4165SPX region (the .618 extension of waves [1][2]).
The target for wave v of [3] in this potential would be the prior highs in the 4800SPX region. So, in this set up, we would risk about 100 points for a potential 500 point rally. But, I want to again stress this is ONLY if the market proves its ability to take out the resistance noted above and then drop correctively thereafter. For now, I see this as a lesser likelihood.
Yet, I have constantly told you that I am always looking for where I can be wrong in my primary assessment so that we do not remain on the wrong side of the market. And, now that we have reached our target for this rally, I have to outline where I can be wrong.
So, as I have stated many times, I have no interest in shorting this market until we break support. Yet, I have been raising cash because we are in a very pivotal zone which can mark a high for 2023. Prudent risk management suggests I approach the market as such. But, should the market prove otherwise in what I view as the lesser likelihood at this time, I want you to understand the plan I will be putting into place.
And, now back to your regularly scheduled program.