Important Bottoming Structure - Market Analysis for Oct 3rd, 2023
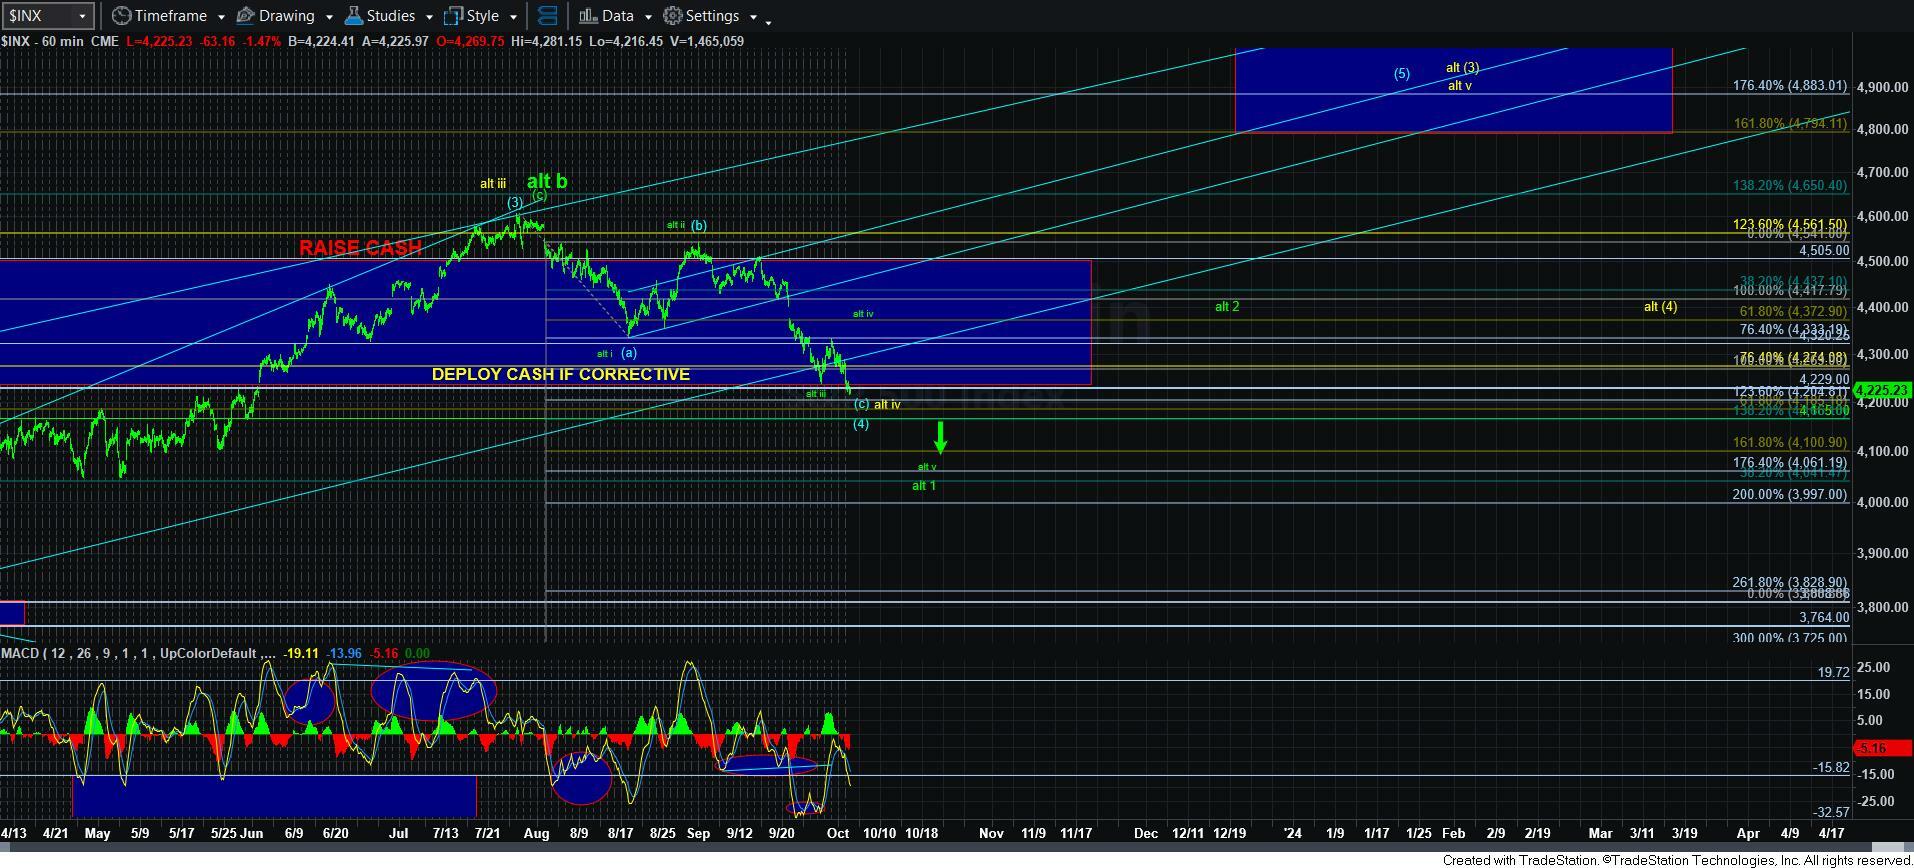
With the market breaking minor support today, it told us rather clearly that we are in wave 5, as per the primary wave count. That means that this “should” be the final decline in the blue [c] wave.
Again, I want to remind you to basically ignore the yellow count right now on the 60-minute chart, as the yellow and blue counts are mirror counts until they reach the 4800SPX region, and will diverge at that time.
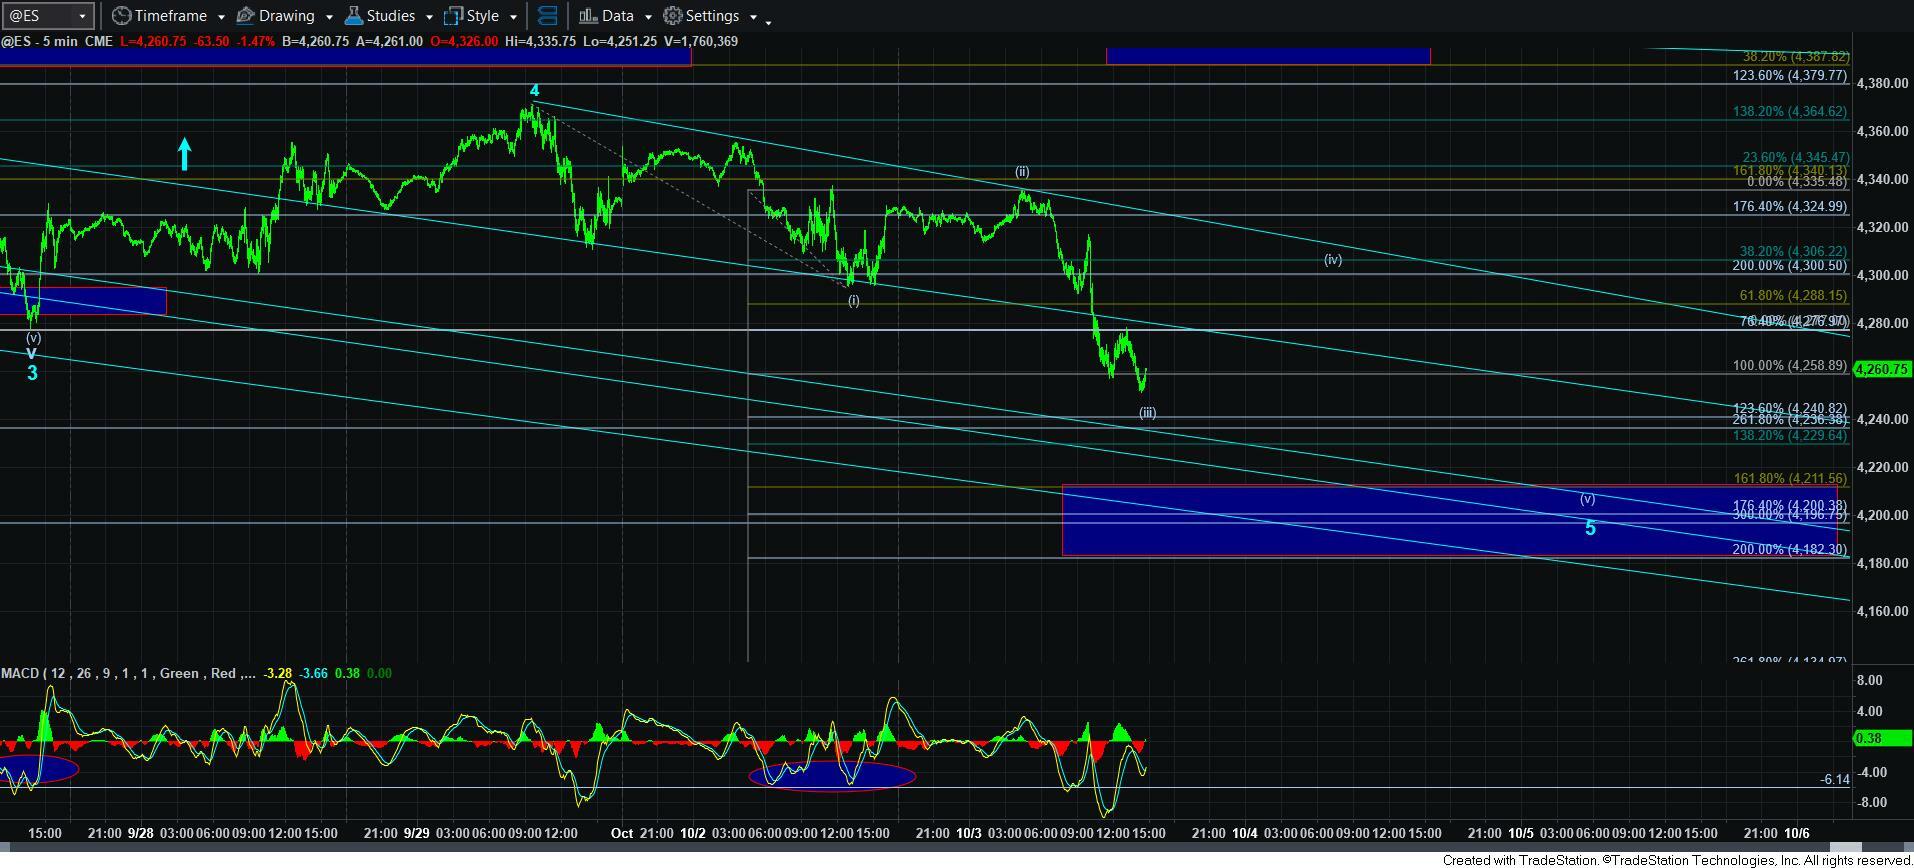
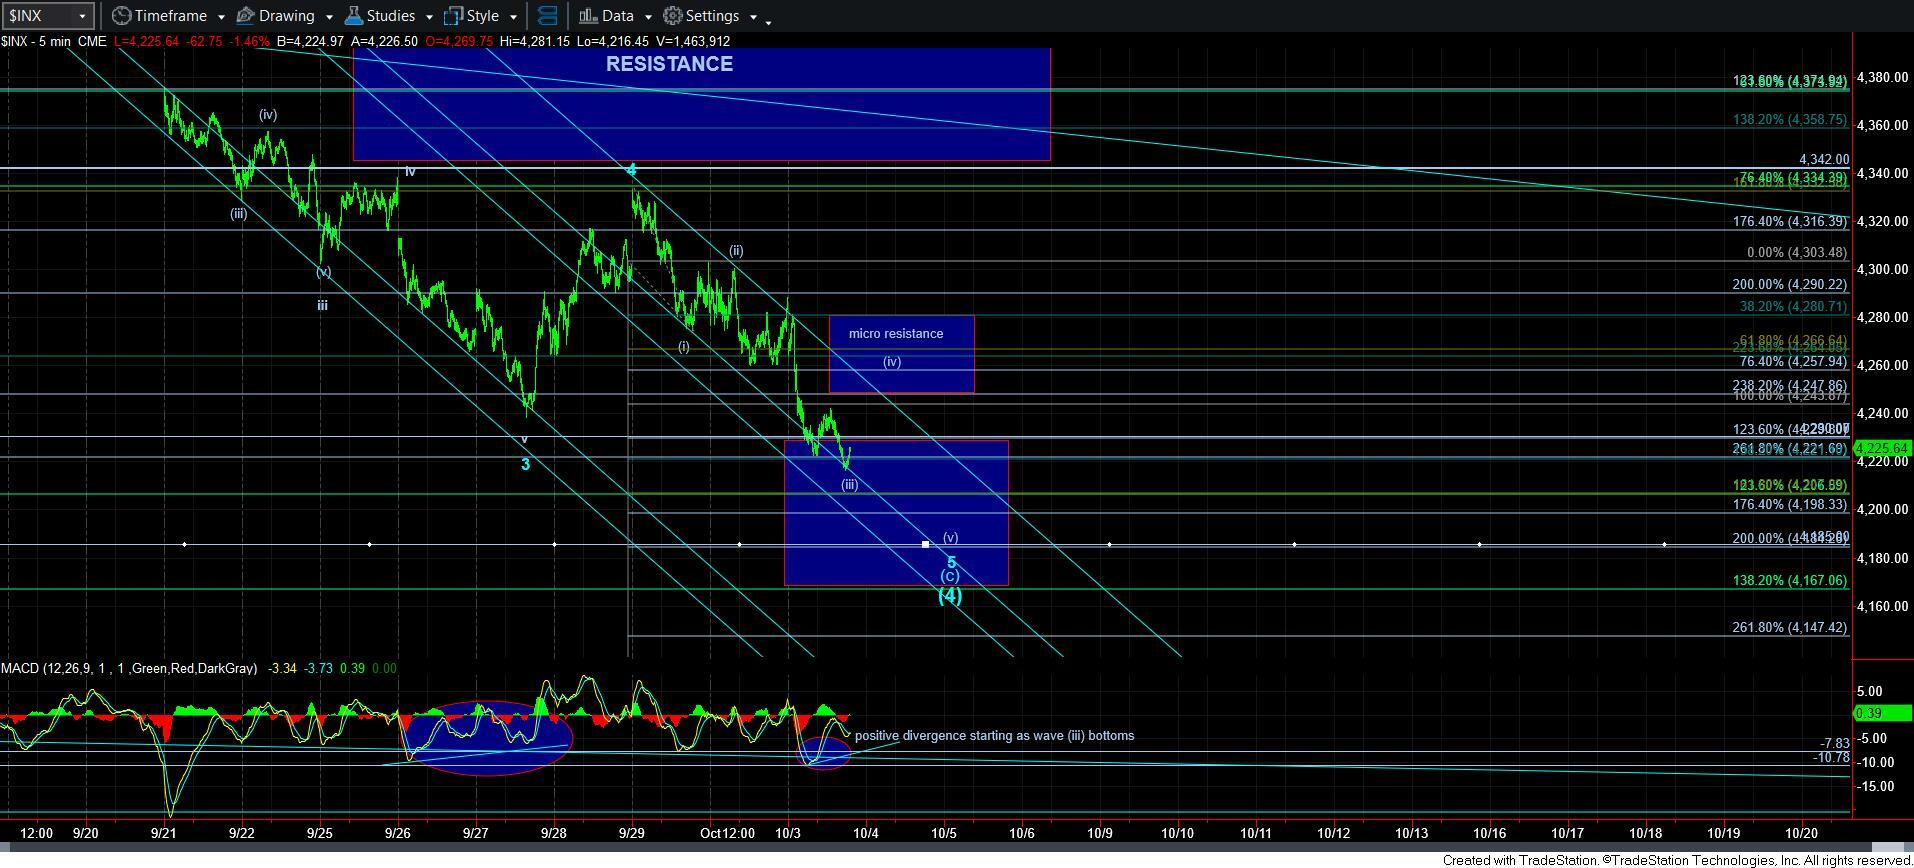
The structure of wave 5 seems to be taking shape as an ending diagonal, which is what has made it more difficult to distinguish between the end of wave 5 and the start of wave 5. But, as I write this update, I believe it is rather clear that we are in wave 5.
Within wave 5, we seem to be within wave [iii]. Support for wave [iii] can be as deep as the 4230-4240ES region, depending on how we count this ending diagonal structure. You see, they can be counted a bit differently in ES and SPX, since ES had more overnight action for which we would have to account.
I believe the bigger question is going to be the wave [iv] bounce. I have highlighted a resistance region on the SPX chart which would be applicable to a wave [iv] within an ending diagonal, as they most often overlap with wave [i] in a diagonal structure.
Once we do see that wave [iv] bounce, that is a strong indication that the market is likely going to be bottoming after one more decline – wave [v]. The ideal target for wave [v] within an ending diagonal is the 1.618-1.764 extension of waves [i][ii[, which in our case is the 4198-4206SPX region, or 4200-4211ES region. Again, there is a disparity in the structure due to the futures action, and that is what accounts for the difference in standard targets.
As far as the MACD on the smaller degree charts, they are providing us with the indications we would want to see for a potential bottoming structure developing, as we are seeing appropriate divergences exactly where they need to begin.
Furthermore, should we see a break-out through the micro-resistance box on the 5-minute chart, that is an initial signal that this ending diagonal has completed, and, with that, that the 5th wave of the blue [c] wave has completed. That means it is also an initial signal that we could begin the rally to the 4800SPX region. Of course, I would want to see a move through the 4375-4101SPX higher resistance for confirmation.
To remind you again, I would not want to see this decline breaking down below 4165SPX, or that would increase the probability of the green count, which suggests a long-term top has already been struck, and that we have begun a decline that will ultimately take us below the low struck in October of 2022. Take note that the ES chart could represent a small break of that level (which would be akin to the 4147SPX Fibonacci extension level on the 5-minute SPX chart), but as long as we hold that blue box of support on ES, I am still maintaining the blue count as my primary perspective.In fact, if wave (iii) ends around where we are at the time of my writing this update, then it is not likely that we will see such a deep extension.
At this time, I am not seeing indications of a major break-down potential. But, please remember that THIS is the general region which will likely decide if we get another rally to 4800SPX or not. And, we must remain objective in our perspective of the market in order to remain on the correct side of the next 500+ point move that will likely take shape in the coming months.
Our parameters are set, and Mr. Market will guide our way over the next few days. It should not take more than a few more days until this pattern has either provided us with the bottoming structure we want to see in the blue count, or break support and place us in the green count. My primary count remains the blue count, pointing us to 4800SPX. But, I have objectively outlined where I am wrong in that assessment.


