IWM and SPX Have Different Micro Stories
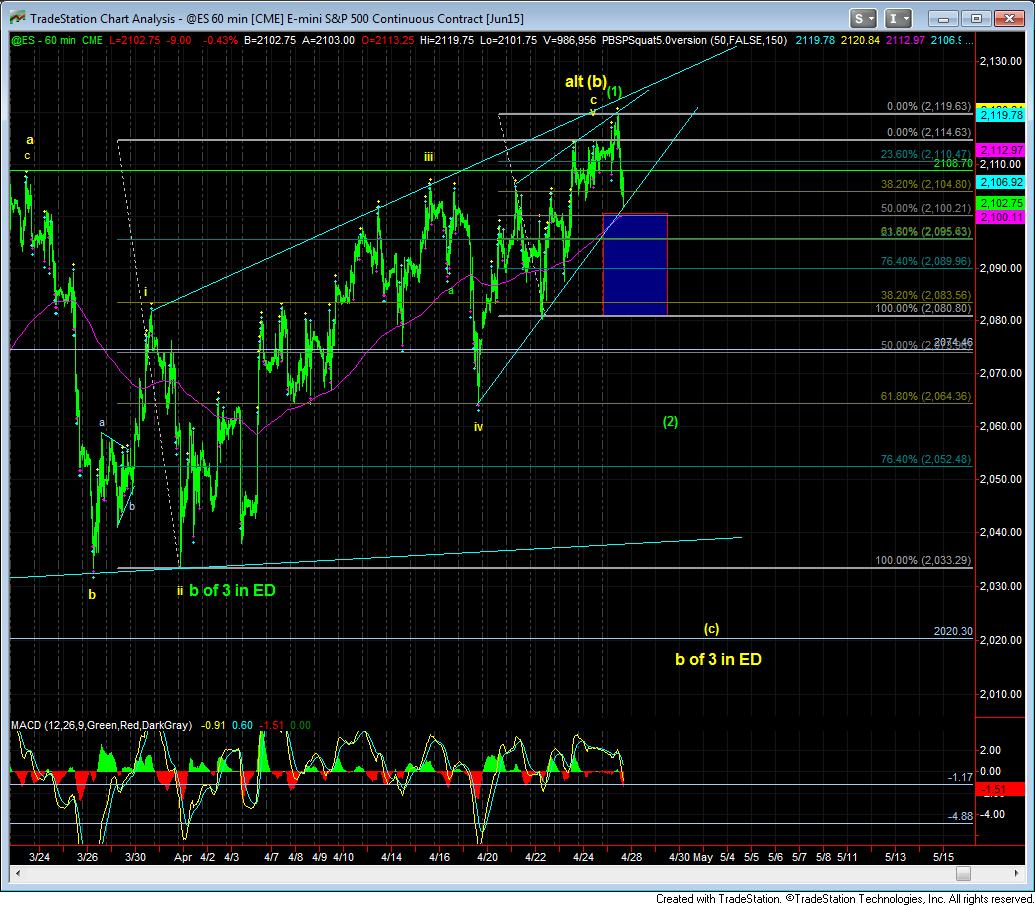
With the pullback in the SPX/ES from the new highs today, the market was not able to sustain a clear 3rd wave break out, nor has it broken below the upper support at 2092ES. But, as we noted over the weekend, the larger degree upper support in the ES resides between 2092ES-2100ES, with the lower part of the upper support region resideng at 2080ES. And, as I said over the weekend also, it would take a full break below 2080ES to make me view this as a larger (1)(2) in the SPX/ES, as noted on the 60 min ES chart.
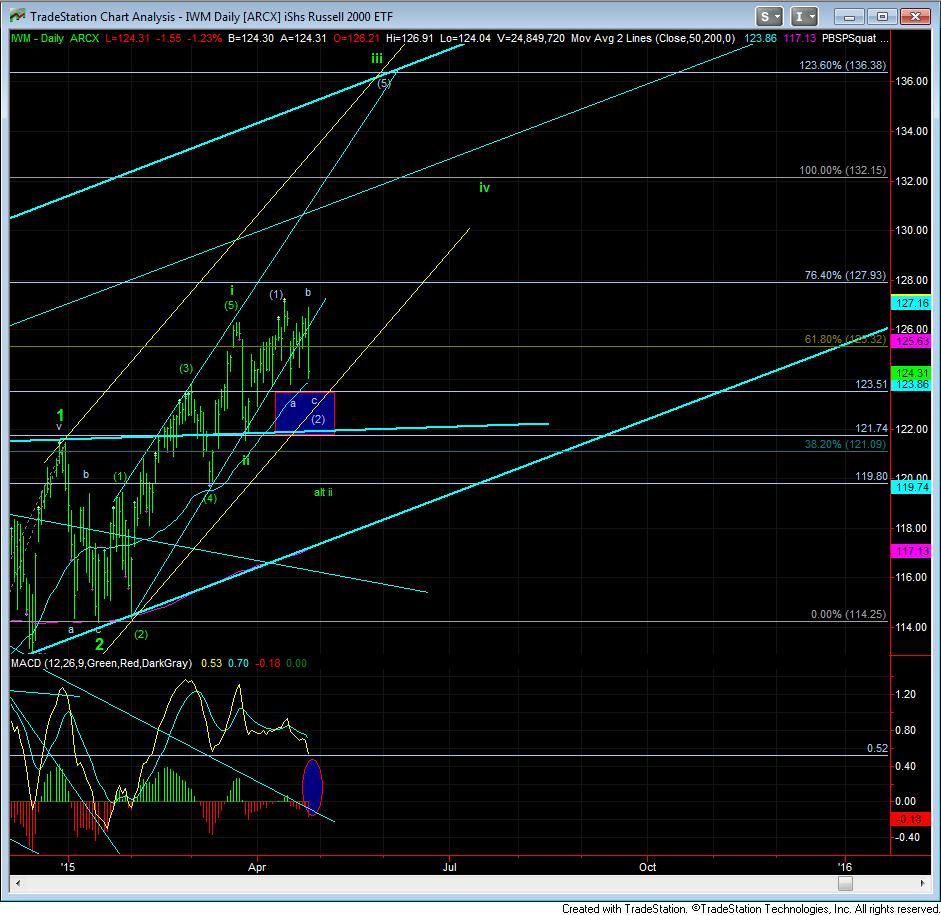
However, in the IWM, we came right back up to the prior highs, and broke down from that region. Based upon the larger degree patterns, it still looks like the IWM wants to target that 123.50 region that it missed by 30 cents last time. If so, we would have a nice wave (2) flat in the IWM.
But, the question with which I am struggling is how to reconcile the two markets at this time, and, for now, I am going to have to reserve that judgement. I will simply go back to what I said over the weekend that if the IWM is unable to break out early this week, then it will likely be re-testing that 123.50 region, and possibly even lower.
For now, the market does not seem set up to provide us with a significant break of that region. But, due to the potential further downside which can be seen in the ES, I am going to keep my options open at the moment. Until I am able to see the next 5 wave structure off one of these support regions, I am going to question whether the market is set up provide us with the 3rd wave break out to our higher targets just yet.
But, the one thing I do want to point out is that the daily MACD on the IWM chart has finally been moving much closer to the target oval, which should reset the technicals enough to support that 3rd wave extension to much higher levels.