IWM Taking The Lead
As we came into 2015, the analysts here at EWT have noted many times the potential for the IWM to outperform in this 2015 rally. And, it is clearly giving indications of this today.
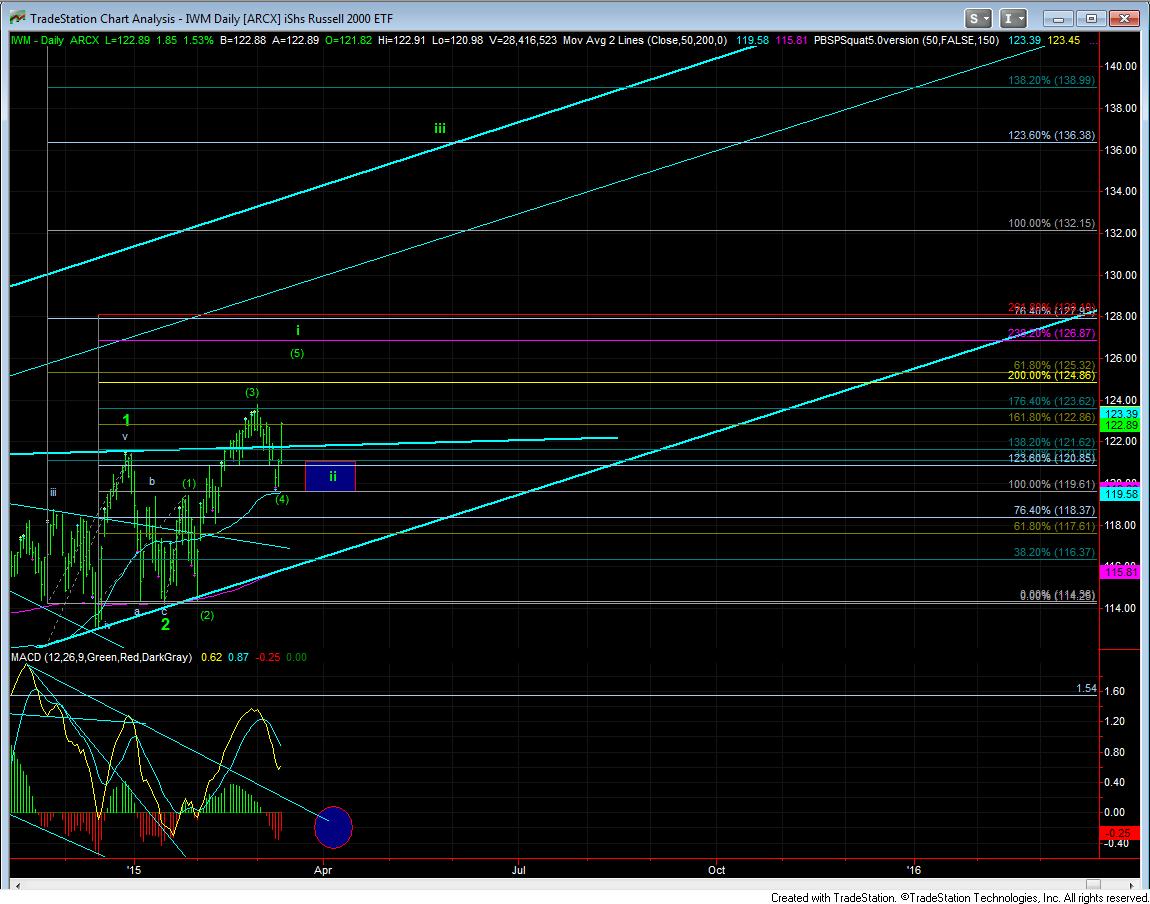
Over the last few days we have heard a lot of bearishness in the market and on the site. While I can clearly see some merit to some of the presentations and arguments, when we have such a bullish potential on the chart, I would rather wait until the bullishness has invalidated. To this end, I want everyone to please recognize that should IWM make a new higher high within the next week, I see nothing bearish about this chart. Rather, it is set up in a potentially uber-bullish 1-2, i-ii pattern.
Yet, even so, this will still bring back the bearish feelings into the end of the month if we see the wave ii into the early part of April, as I think the pattern will play out. Should the IWM exceed the 128 region from here, then I was wrong, and we are likely on our way to 136 for wave iii of 3.
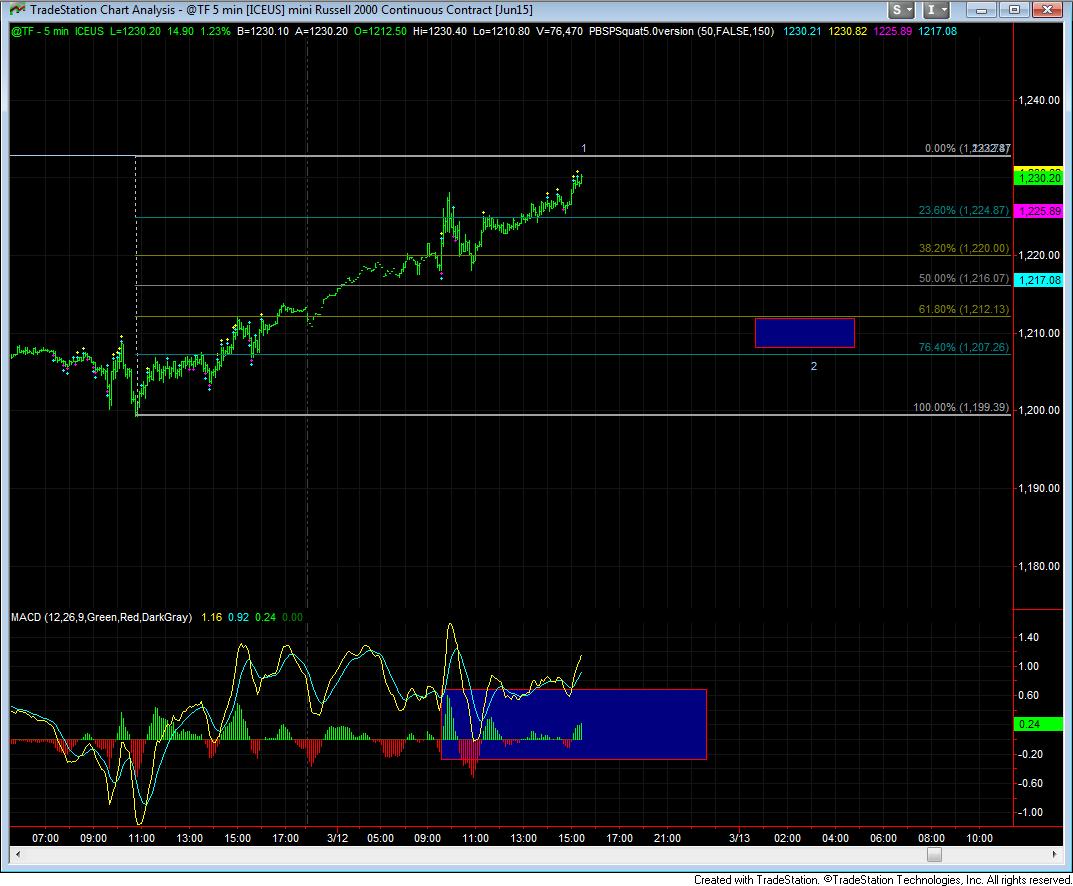
But, my expectation right now is that we will see a wave 2 pullback tomorrow in wave (5) of i, and it should be a deep pullback to have the market adhering to the larger degree ideal Fib Pinball pattern for the 1-2, i-ii potential. Remember, wave I of 3 ordinarily targets the .618 extension. However, if the TF is able to strongly move through the 1233 region, we are likely taking the direct route to higher highs and the .618 extension in the IWM.
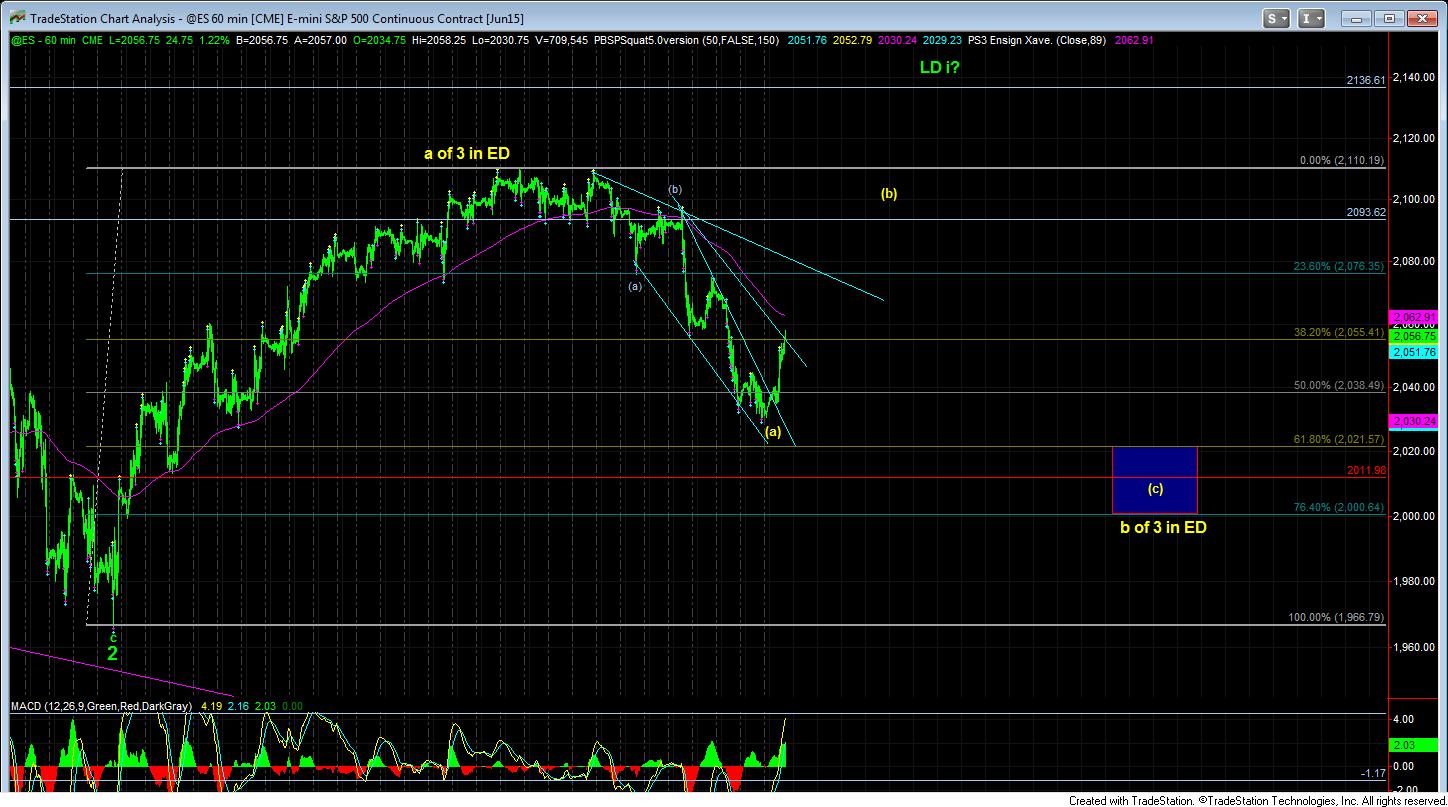
As for the ES, while I am still going to maintain an open mind to the potential for a leading diagonal for wave I, represented in green, we would need to make a higher high to get there. But, I really question the ability of the ES to do so. Rather, I like the larger flat pattern for the b-wave of wave 3 in the ES.
Please note, I am now on the June contract on the ES