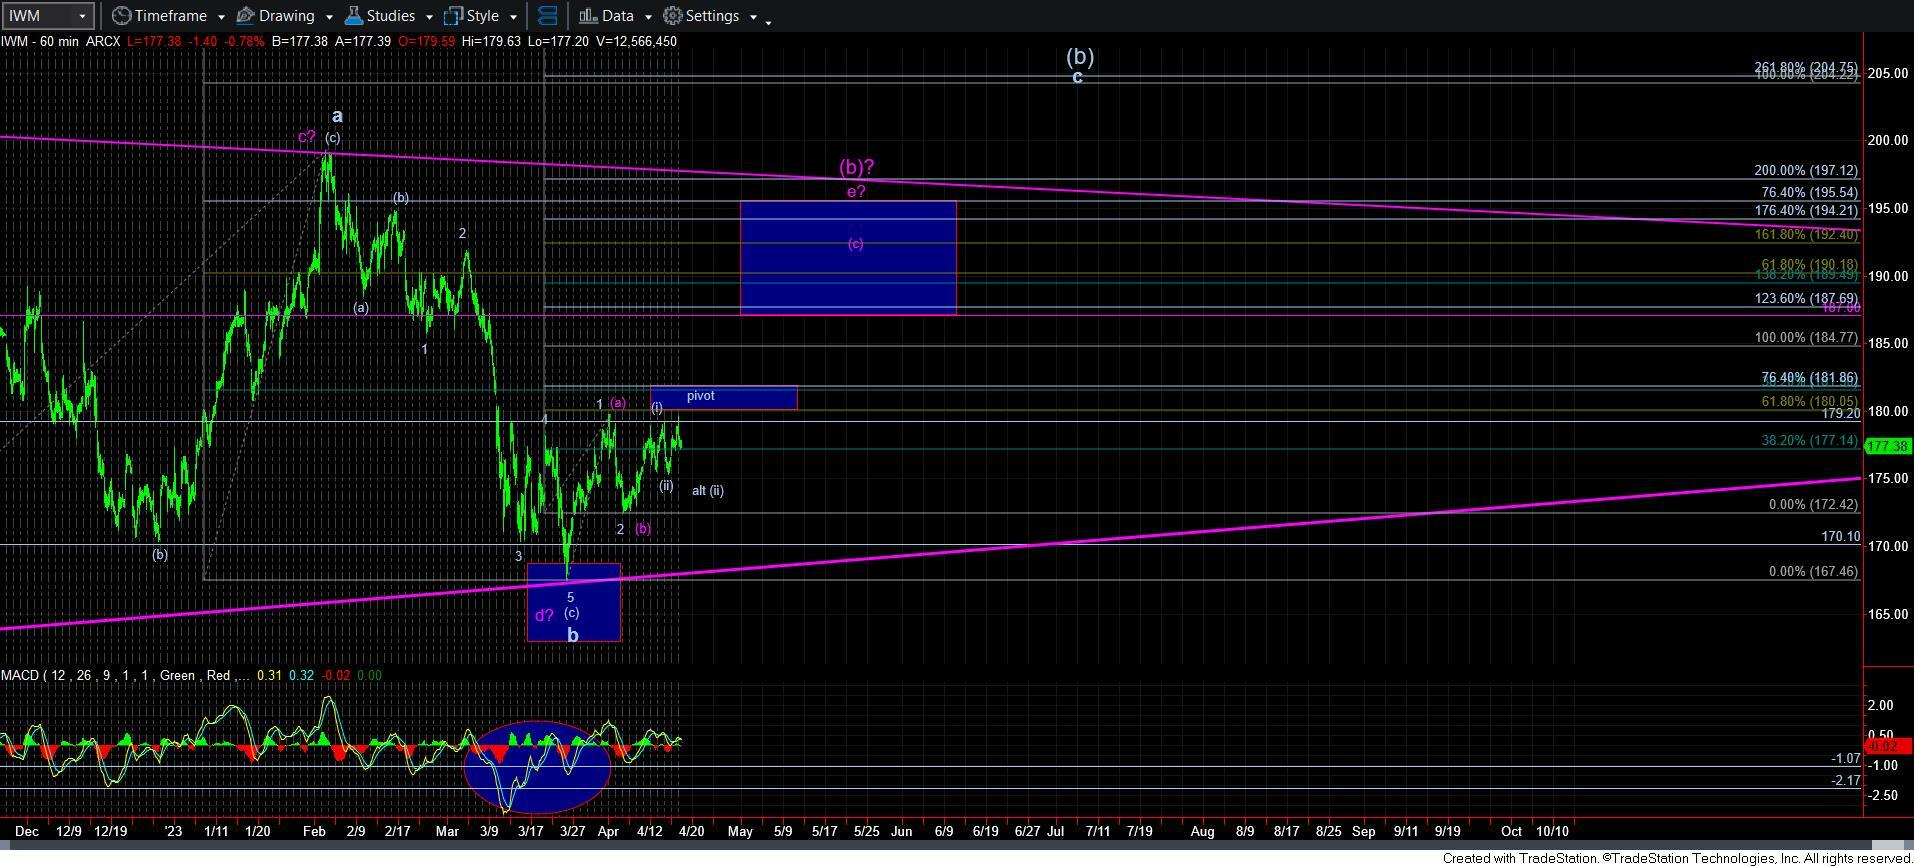
IWM Still Looks Near-Term Bullish
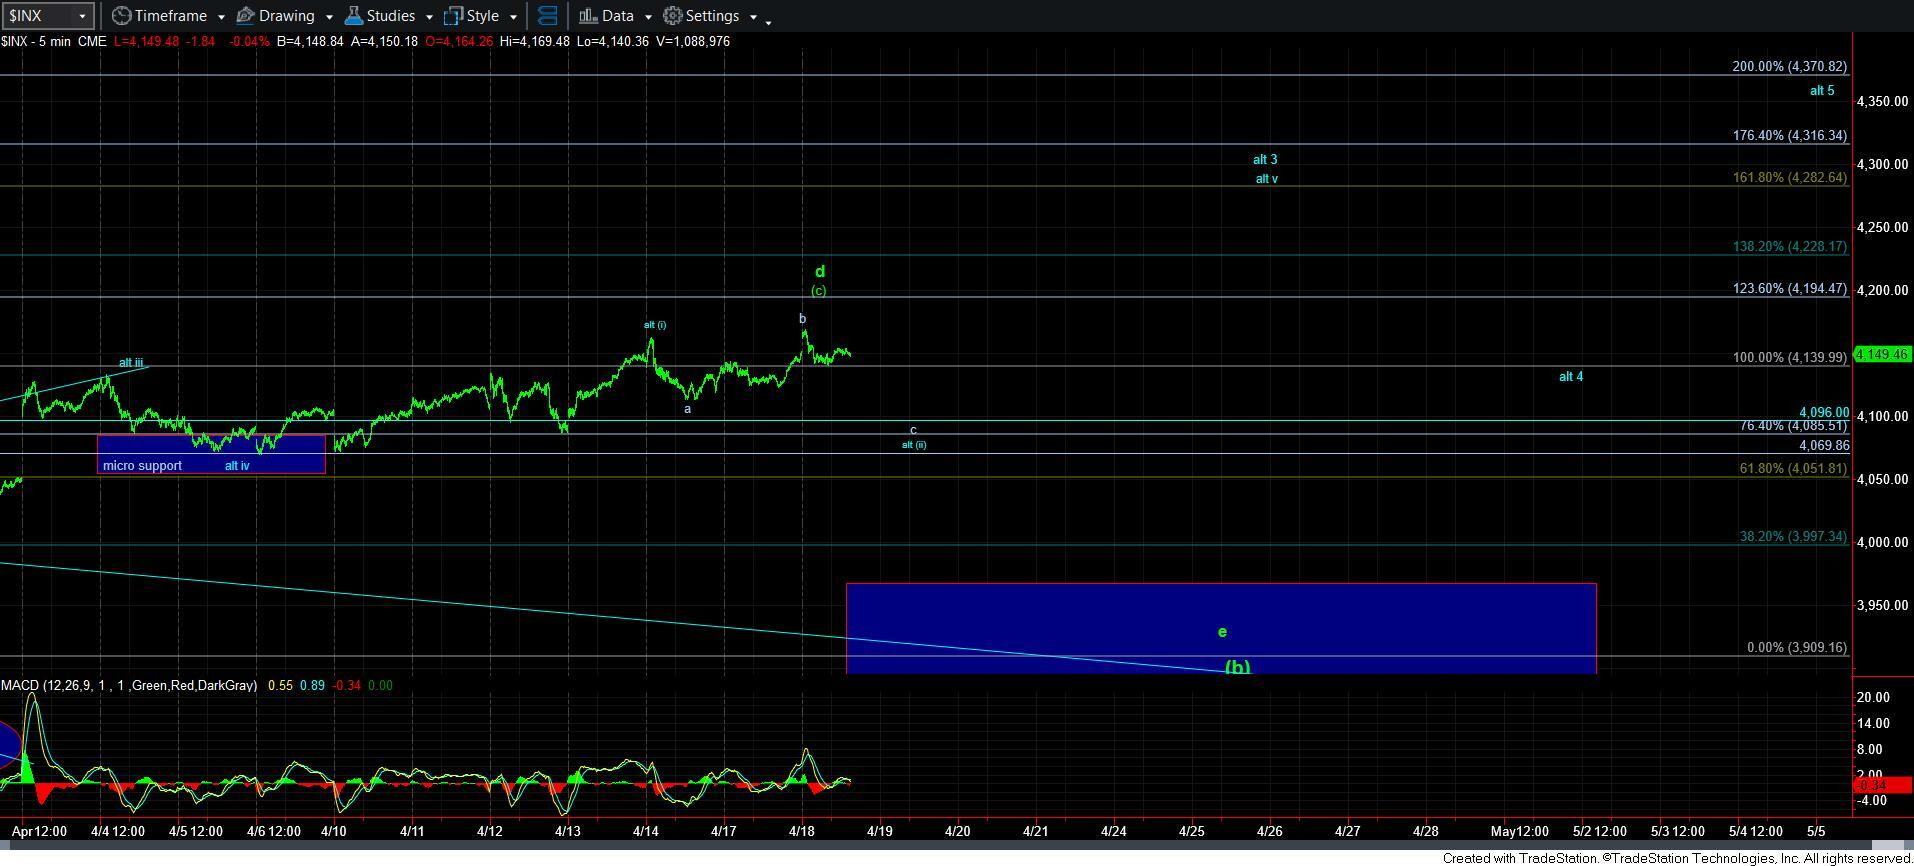
Unfortunately, I cannot say that I have a high probability perspective that is highly reliable in the micro structure in SPX at this time. The best I can do is potentially suggest that we may see a c-wave down to complete a wave [ii] in the blue count, especially as long as we remain over 4096SPX, as outlined yesterday.
But, I will say that the IWM has a very nice set up for a rally to the 189/190 region. While we may still see more of a wave [ii] take shape, as I show on the attached 60-minute chart, I would go so far as to say that the next time we break out over today’s high will likely suggest we are in wave iii of [iii] in the next rally higher.
Whether the IWM can exceed the 189/190 region or whether it tops to complete the e-wave of a [b] wave triangle is still a question that cannot be answered until we see if we get any larger extensions on the break-out. But, for now, I think it is reasonable to assume that a break-out can minimally target the 189/190 region.
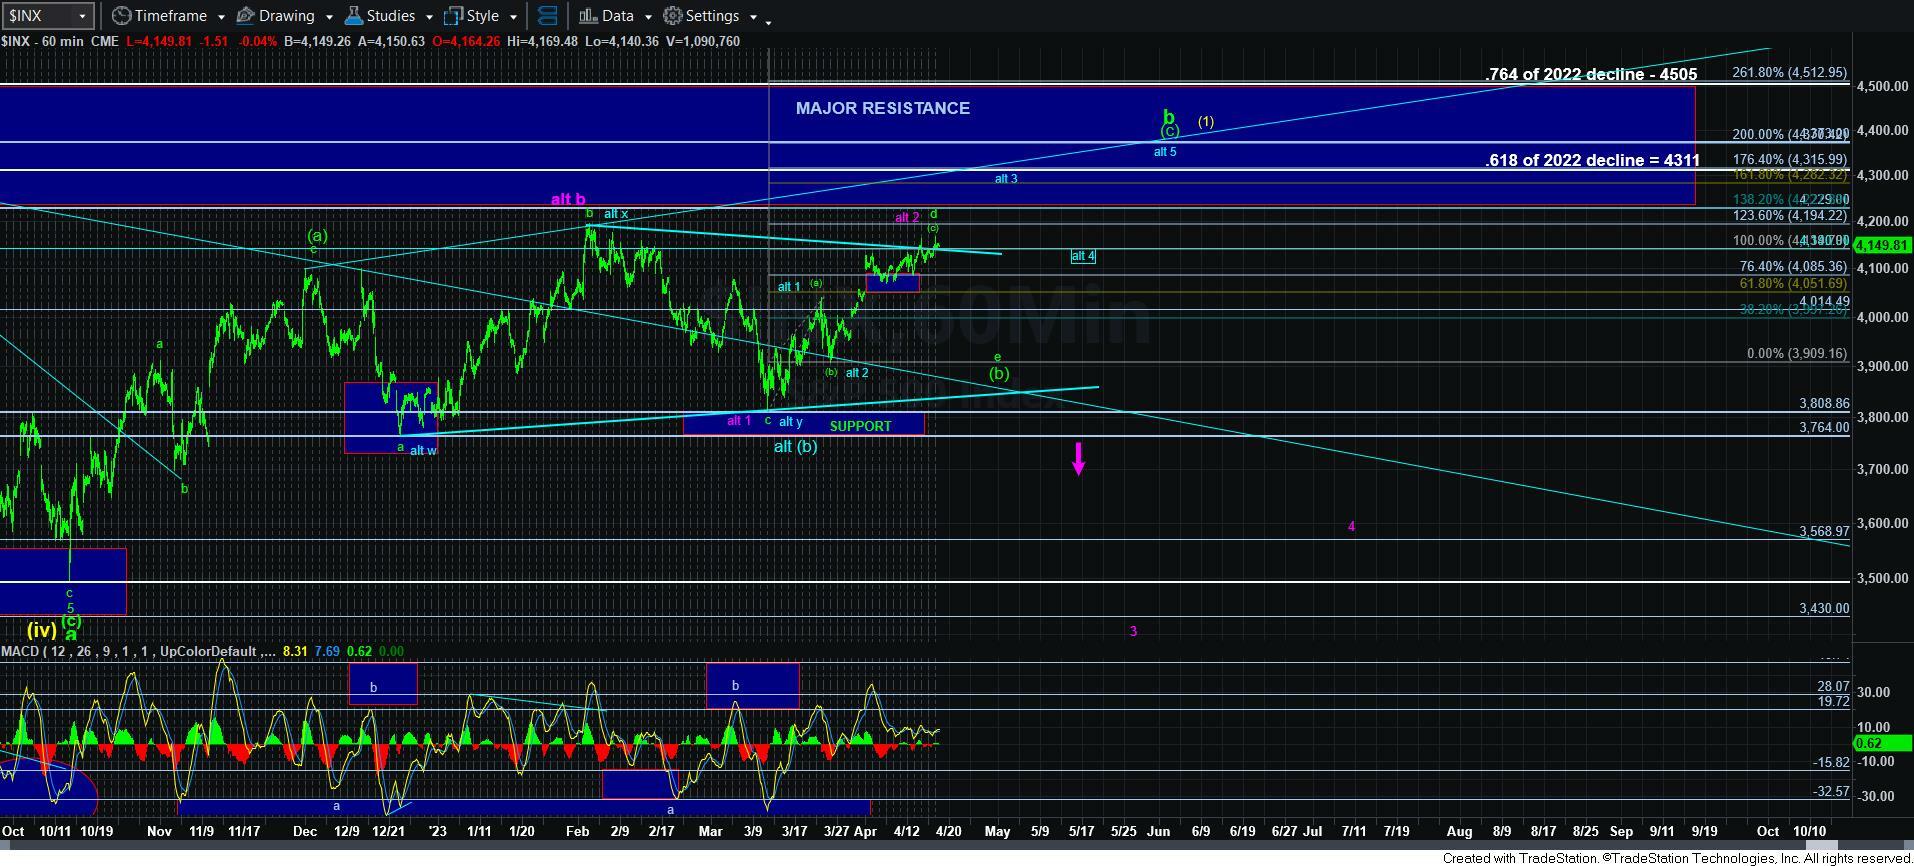
Overall, I still see no indications that a meaningful top has yet been struck. And, should the market break out over 4195SPX, then I will be taking off the triangle count and the purple counts from the SPX chart, which leaves us with only the green b-wave topping, and of course the yellow count. But, there is no way I am adopting the yellow count unless we see a VERY clear corrective decline once this rally completes.