I Have To Remain Objective
 By
Avi Gilburt
By
Avi Gilburt
Despite all the issues I have outlined with the yellow count over these last several weeks, we have seen something today that is forcing me to be tracking it on the chart a bit more closely now.
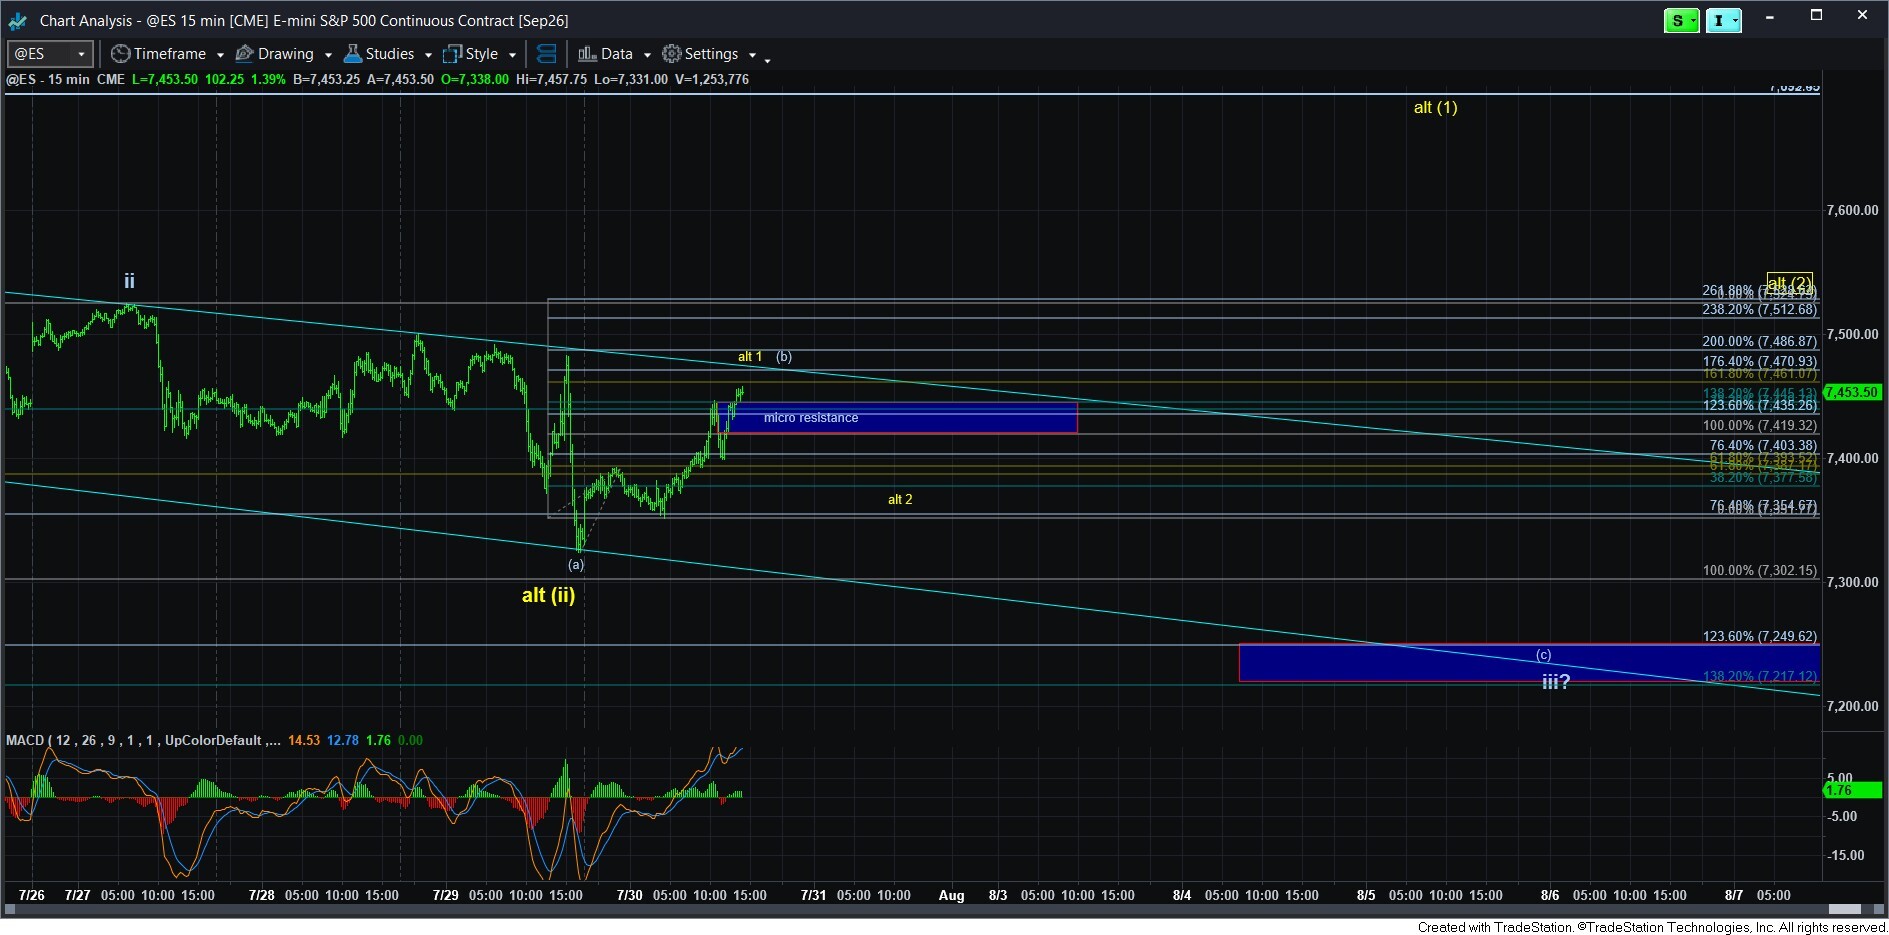
With the rally in the futures off the overnight low, I can now count a 5-wave structure but ONLY AS A LEADING DIAGONAL, which I do not view as highly trustworthy in and of itself. In other words, while there is some potential that this is a 5-wave rally, I think it is quite reasonable to also view this as a 3-wave rally., which I would classify as the (b) wave within wave iii in the ending diagonal structure, as outlined on the 15-minute ES chart.
Remember, in my earlier post this morning, I noted that the triangle had become much less likely due to the invalidation in the futures. So, this leaves us with only the ending diagonal structure for the (c) wave decline. And, I am counting us as still being in wave iii, with today’s rally being the (b) wave of wave iii.
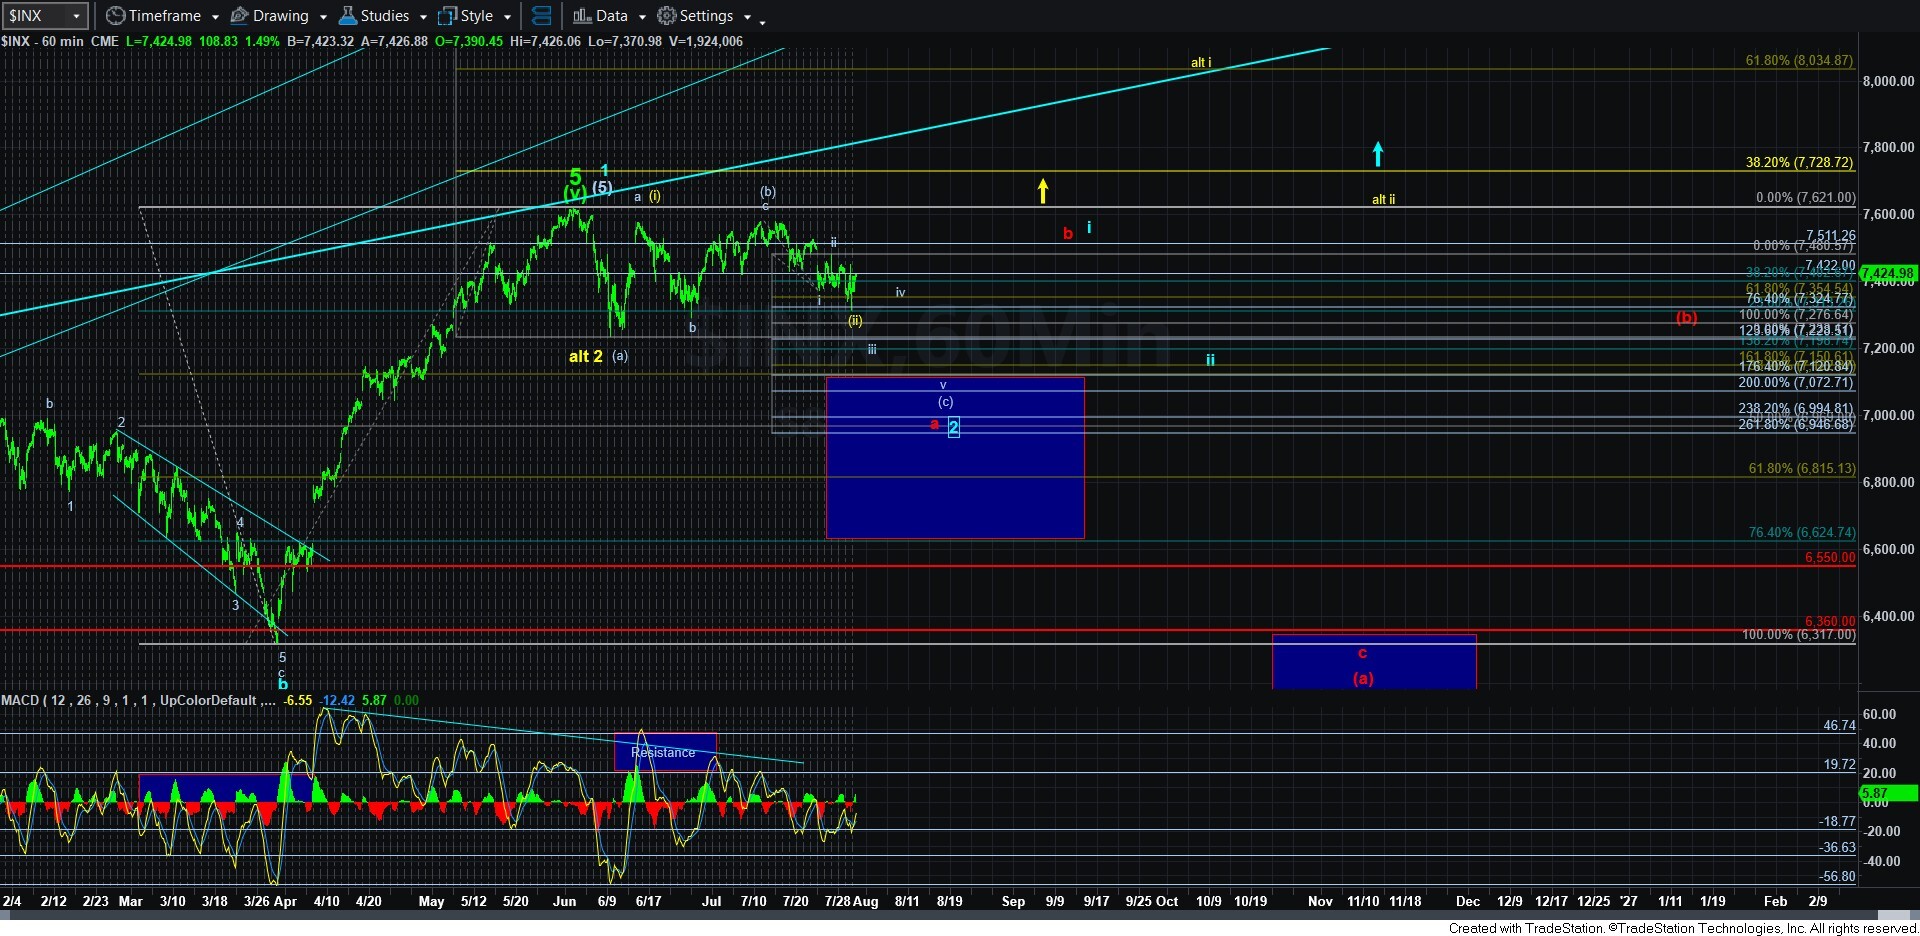
Unfortunately, with these 3-wave structures, there are other ways to count it as well. But, for now, I am following the count as still being in wave iii of the (c) wave. One of the reasons is that the 1.764 extension in the ending diagonal as I present it actually targets the top of the support box below and the .382 retracement of the rally off the end of March low.
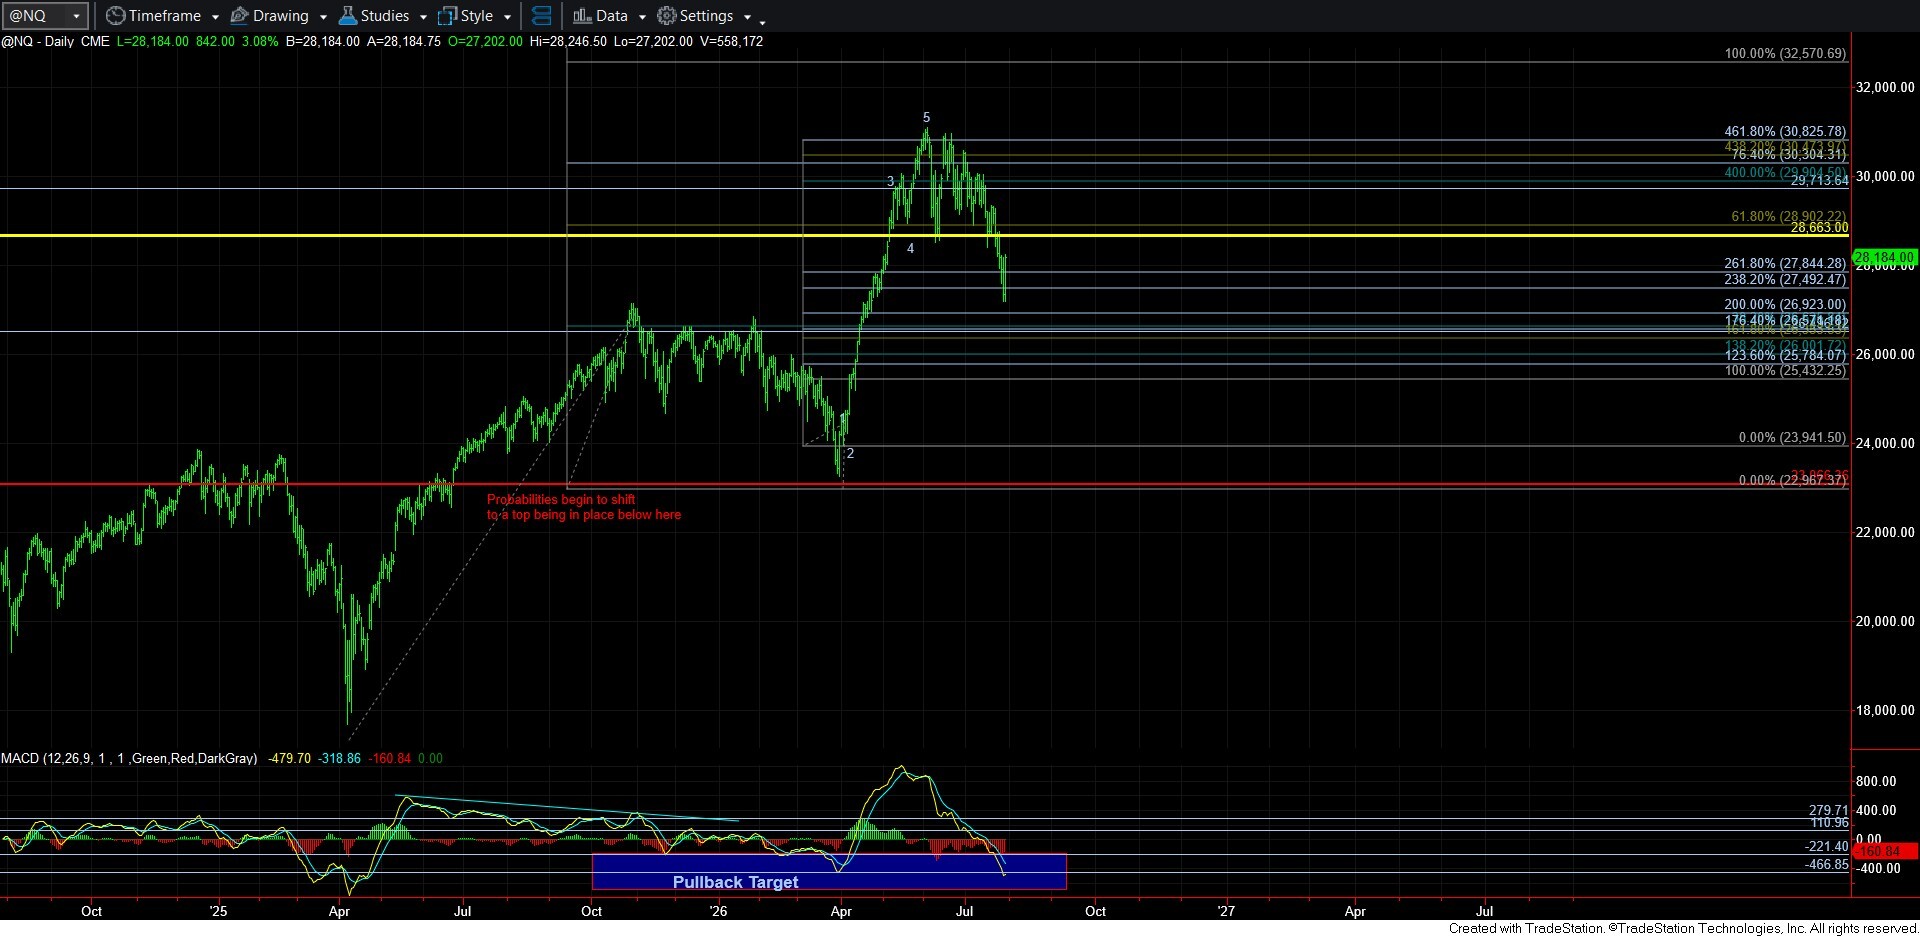
One of the other items of which I am going to ask you to take note is something I discussed in the live video for the main service that I do on Wednesday mornings. If you see the depth of the MACD on the daily NQ chart, we have reached a region from which major rallies have begun in the past. So, this is a warning not to remain too bearish at this time. While it can and has gone lower and deeper into that support box in the past, we need to be alert to any bullish indications so as not to remain bearish too long.
For now, I am still looking lower and would still prefer to target the .382 retracement on the SPX charts. But, with a potential 5-wave structure – even as a leading diagonal – off the overnight low, I have to be tracking a more immediate bullish count despite all the issues I have with it. Therefore, if the next decline is clearly impulsive, then I am viewing that as the (c) wave of wave iii, and pointing us down to the blue box target on the 15-minute ES chart. However, if the next decline is clearly corrective, we may have to switch gears a lot earlier than I had originally expected and take the yellow count much more seriously.
There is one last point I would like to make, which I posted in the main room today. Due to the lack of strong indications that a major top has been struck, I would strongly advise you to seek out individual stock charts in StockWaves which are presenting a CLEAR 5-wave c-wave decline in completing an a-b-c corrective structure. Those may be your best opportunities for long entries should you desire more long positions when this a-b-c correction comes to a close, or if we get confirmation that the yellow wave (ii) low is already in place. While I still would not yet view a long position in the SPX as a low risk, high probability entry, there are a number of individual stocks which can offer those types of entries at this time.