I Have Been Looking For A Pullback
I know that I have been looking for a pullback over the last week, yet the market has continued to grind higher. So, I want to explain why.
As I have tried to explain many times before, it is hard to determine how far an initial rally will carry us off an oversold low. We have our standards, but when the market is extremely oversold, the market will often exceed those standards. That is what we are dealing with at this time.
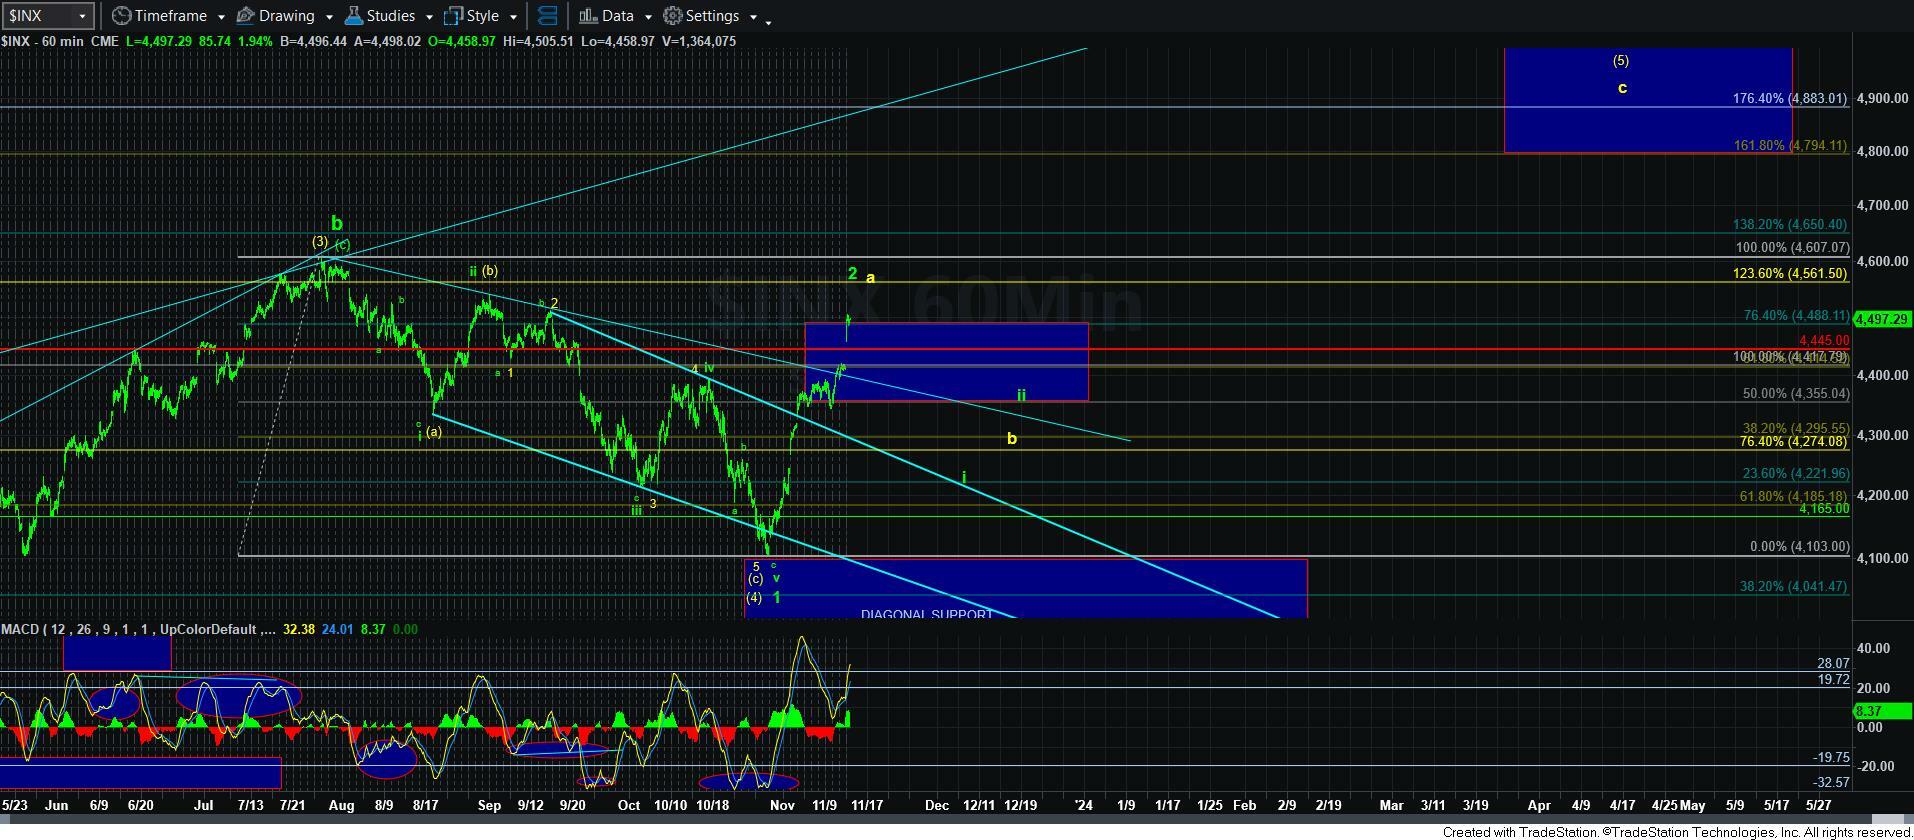
Now, if you remember, before this rally began and as the market struck the 4100SPX support region, I noted the following in my weekend update:
“So, as long as the market holds over the 4000-4100SPX zone, I think it is reasonable to expect a rally. While the exact region for that wave 2 cannot be calculated until we have a confirmed bottom in this decline, I am guestimating that wave 2 can rally back to the 4350-4475SPX region in the coming weeks and months.”
While I correctly began to look up at the lows, I clearly did not expect that we would see a direct rally to our target. And, even so, we have now slightly exceeded the target I set before we even began this rally. So, allow me to state again that this is not a move which can be reasonably foreseeable. That is why I was looking for a reasonable pullback before we reached these levels.
Now, even though I was looking up towards the 4350+ region from the 4100SPX region, I turned towards risk management as my guiding principle during this rally. And, the main reason was because there was a reasonable structure that could be considered as a 5-wave decline off the 4607SPX high.
You see, if we have a potential 5-wave decline off a b-wave high, that puts us on notice that we could be setting up a 3rd wave market crash. While that clearly is not definitive, as I explained, it is akin to having weather conditions ripe for a tornado to form. It does not necessarily mean that it will. But, it is wise and prudent to take cover. For this reason, I have been cautious during this rally. Yet, I have been strongly urging in the chat to not short this move until some support was broken.
Now, I also outlined that the initial 5-wave decline structure into the 4100SPX region was not the most reliable due to its counting as a leading diagonal. And, I have made it no secret that I do not find leading diagonals as terribly reliable trading cues.
However, with that being said, I also would not aggressively trade the long side with the potential that a 3rd wave decline may begin to the downside. Again, from a risk management perspective, that is never wise. Moreover, the nature of the rally for the green count and the yellow count would both be 3-wave structures, so there was not a good way to be able to distinguish between the two at the onset of the rally. Yet, as the market began its rally, I was expecting us to get to at least the 4417SPX region, which was the .618 retracement of the decline off the 4607SPX high.
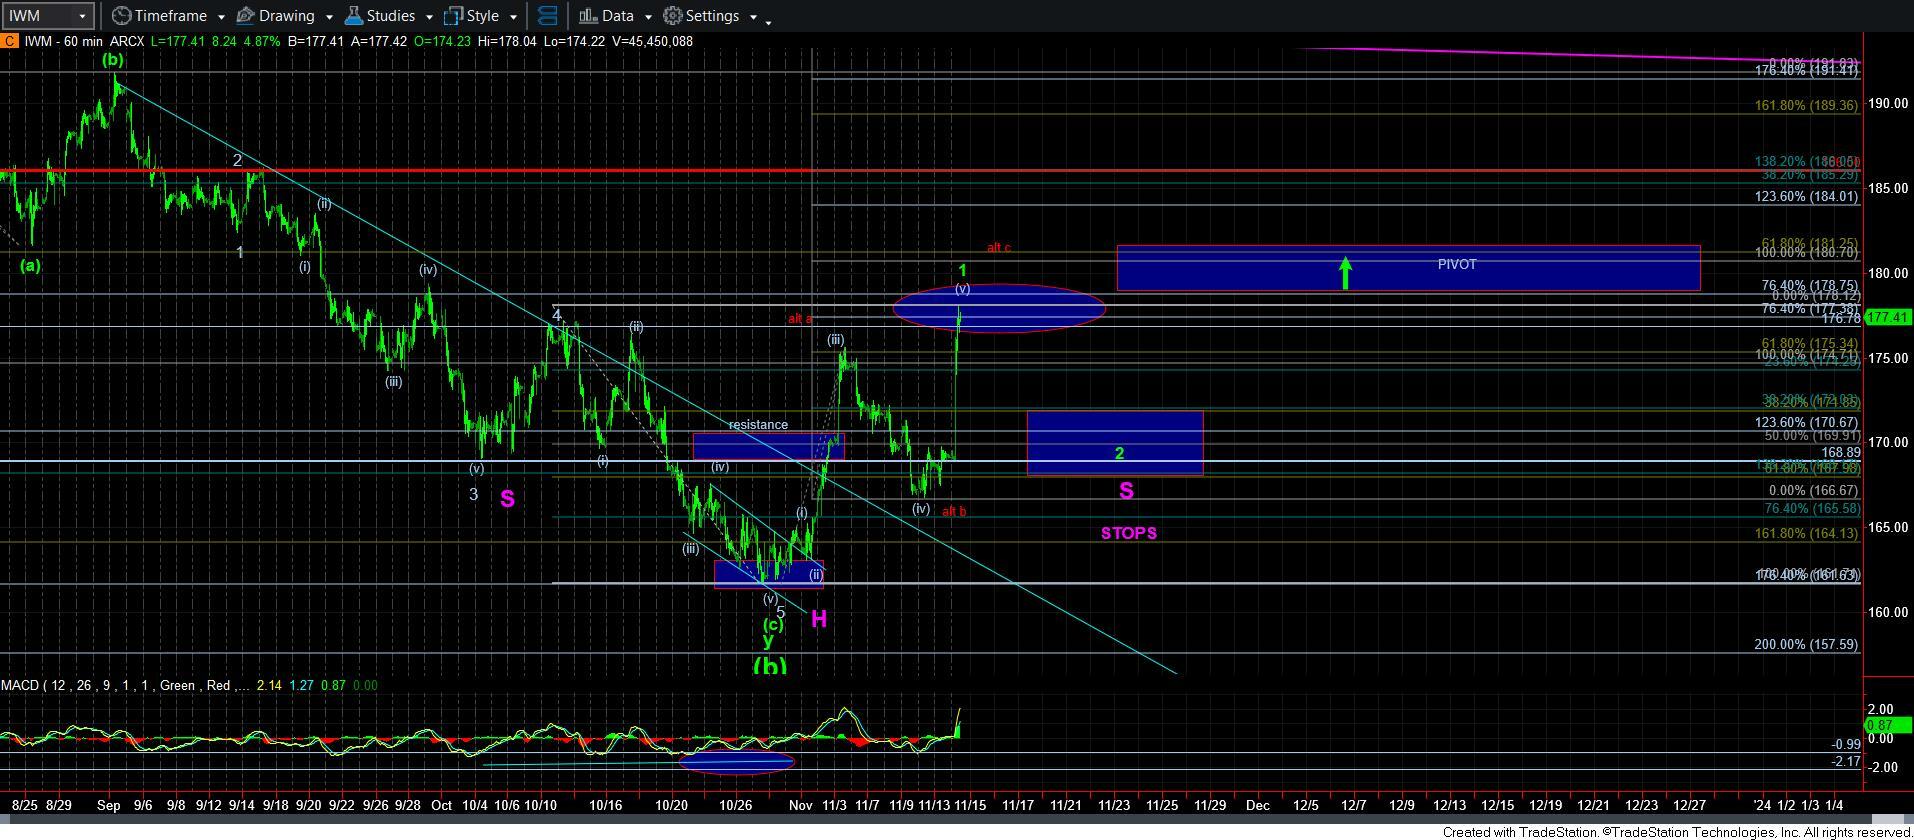
But, I have continually been seeking additional indications for the yellow count to take us to 4800+ as we move into 2024 so that I can be more confident on the long side of the market. And, I was looking towards the IWM for initial cues. Unfortunately, the IWM did not provide us with those indications, at least not until today.
So, let me take a step back and try to summarize what I am saying.
I have been using Elliott Wave analysis for decades. I have been running a public service to teach people how to use Elliott Wave for over 12 years, wherein we have grown to 8000 total subscribers and almost 1000 money manager clients.
And, during that entire time, one of the lessons I have learned the hard way was to not get aggressive in trading against the tide of what could be a 3rd wave in the opposite direction. For this reason, I have been quite cautious during this rally. And, this is based upon many decades of experience. Moreover, I also recognize that I will never be able to garner every point the market gives us in every direction that it may move. And, when I do move into the market, I want to make sure the probabilities are on my side of the table, as I do not like to take excessive risk.
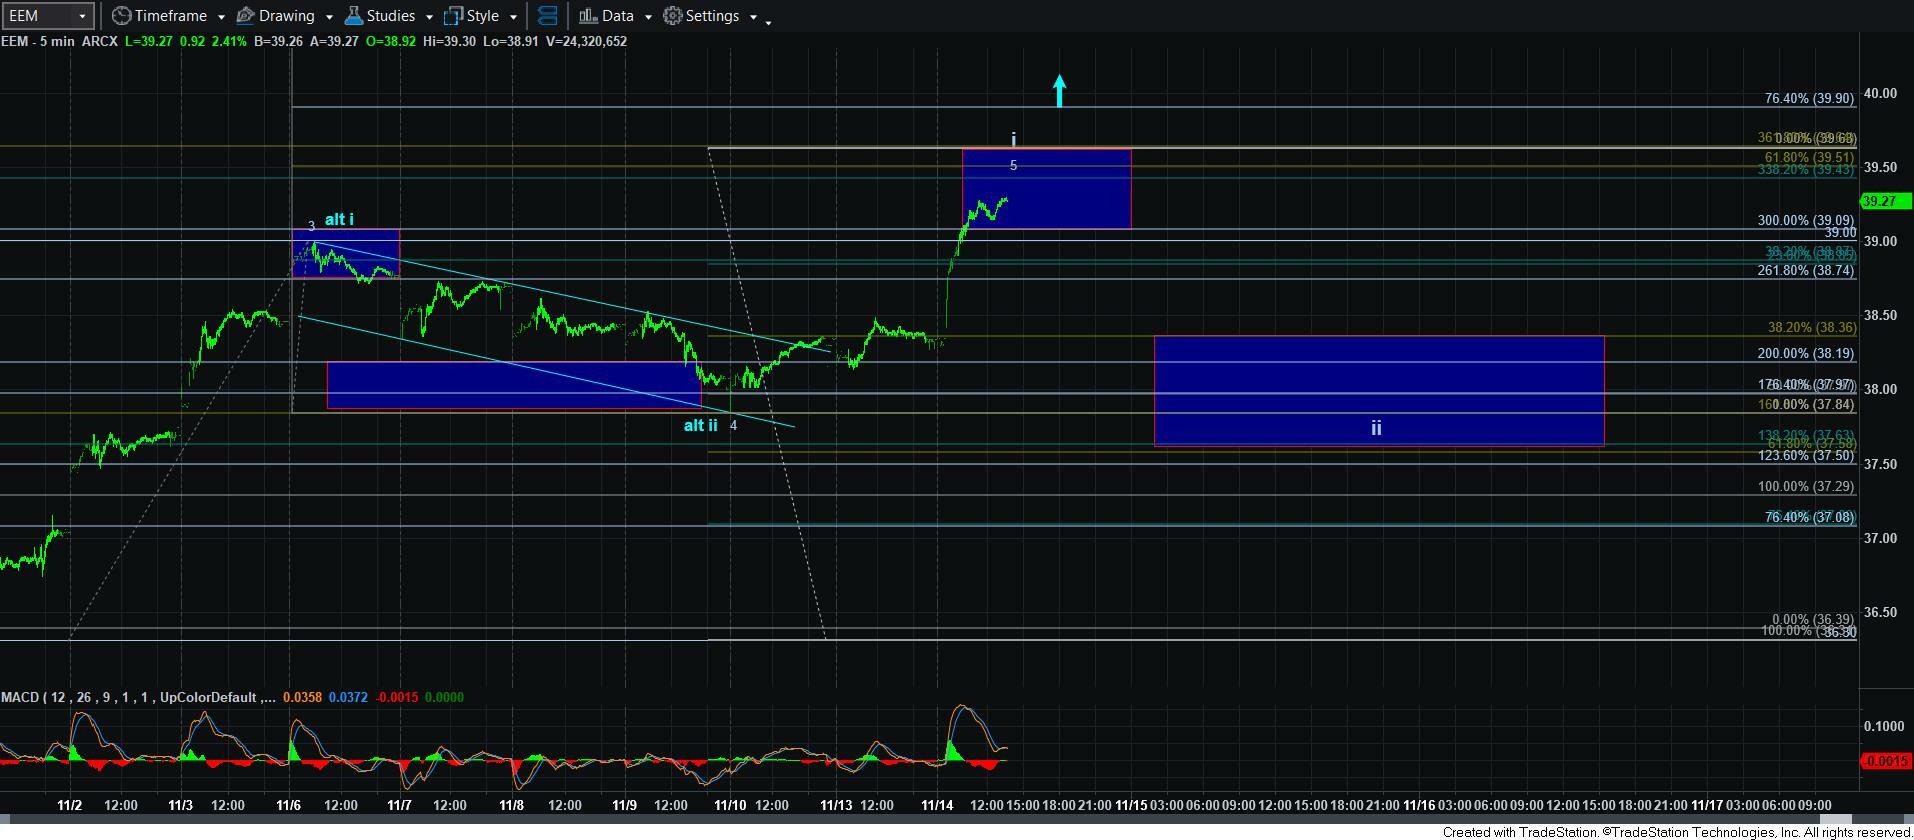
So, what will place the probabilities on my side of the table to move into the long side of the market? At this point in time, it is all based upon the nature of the next decline. Should that decline be a clear corrective pullback, such as a wave 2 in IWM, a wave ii in EEM, and a b-wave in the SPX, then I will gladly layer into long positions as that pullback takes shape.
Now, all of this comes with a very clear warning. Should the market provide us with a 5-wave decline at any point in time before the SPX is able to exceed the 4607SPX level, then I will move strongly into the green count. Keep in mind that a 2nd wave can retrace a substantial amount of the prior 1st wave. In fact, when a diagonal completes, the 2nd wave is often a very deep retracement. So, in fact, there is nothing yet that is giving me high confidence that we are indeed in the yellow count.
And, that is what brings me to the conclusion of this update. As long as the next break-down below the 4445SPX level is clearly corrective, then I will likely adopt the yellow count, especially if the IWM provides us with a corrective wave 2. And, should the market continue to grind a bit higher in the coming days, then I will raise that signal level. But, it is imperative that the next decline be clearly corrective for us to move into the yellow wave count, which will be pointing us to the 4800+ region in the coming months.