I Am Uncertain On TLT At This Time
I want to start by reminding our members that the market structure alerted us to an impending major market topping in the early summer of 2016, wherein we published an article entitled “Beware of Bonds Blowing Up” on June 27th, 2016. As we now know, within two weeks of that article, the bond market struck a major top which has not been exceeded in almost 3 years. In fact, the TLT dropped 22% since it struck its high two weeks after that article.
Then, back in late October of 2018, I alerted our members that I was expecting a bottoming in the TLT as we were approaching the 113 region. In fact, I noted that I was going to be buying TLT once we struck 113 and broke below it in November. And, as we now know, that began the larger degree rally we expected, which ultimately topped out at 126.69. Since that time, I have significantly reduced my exposure to TLT.
While I am contractually obligated to our members to provide continuous updates on the SPX and the metals no matter if the chart is clear or not, I am not similarly bound when it comes to the TLT. That allows me to only post about the TLT when there is a clear set up to trade. However, since I have been asked so many questions of late regarding TLT, I thought I would at least provide my thoughts about the chart. And, at this time, I have no clear set up to present to you with any form of higher probability.
As Bob Prechter noted in The Elliott Wave Principle:
“Of course, there are often times when, despite a rigorous analysis, there is no clearly preferred interpretation. At such times, you must wait until the count resolves itself. When after a while the apparent jumble gels into a clearer picture, the probability that a turning point is at hand can suddenly and excitingly rise to nearly 100%.”
And, this is how I currently view TLT. Allow me to explain using my Elliott Wave perspective.
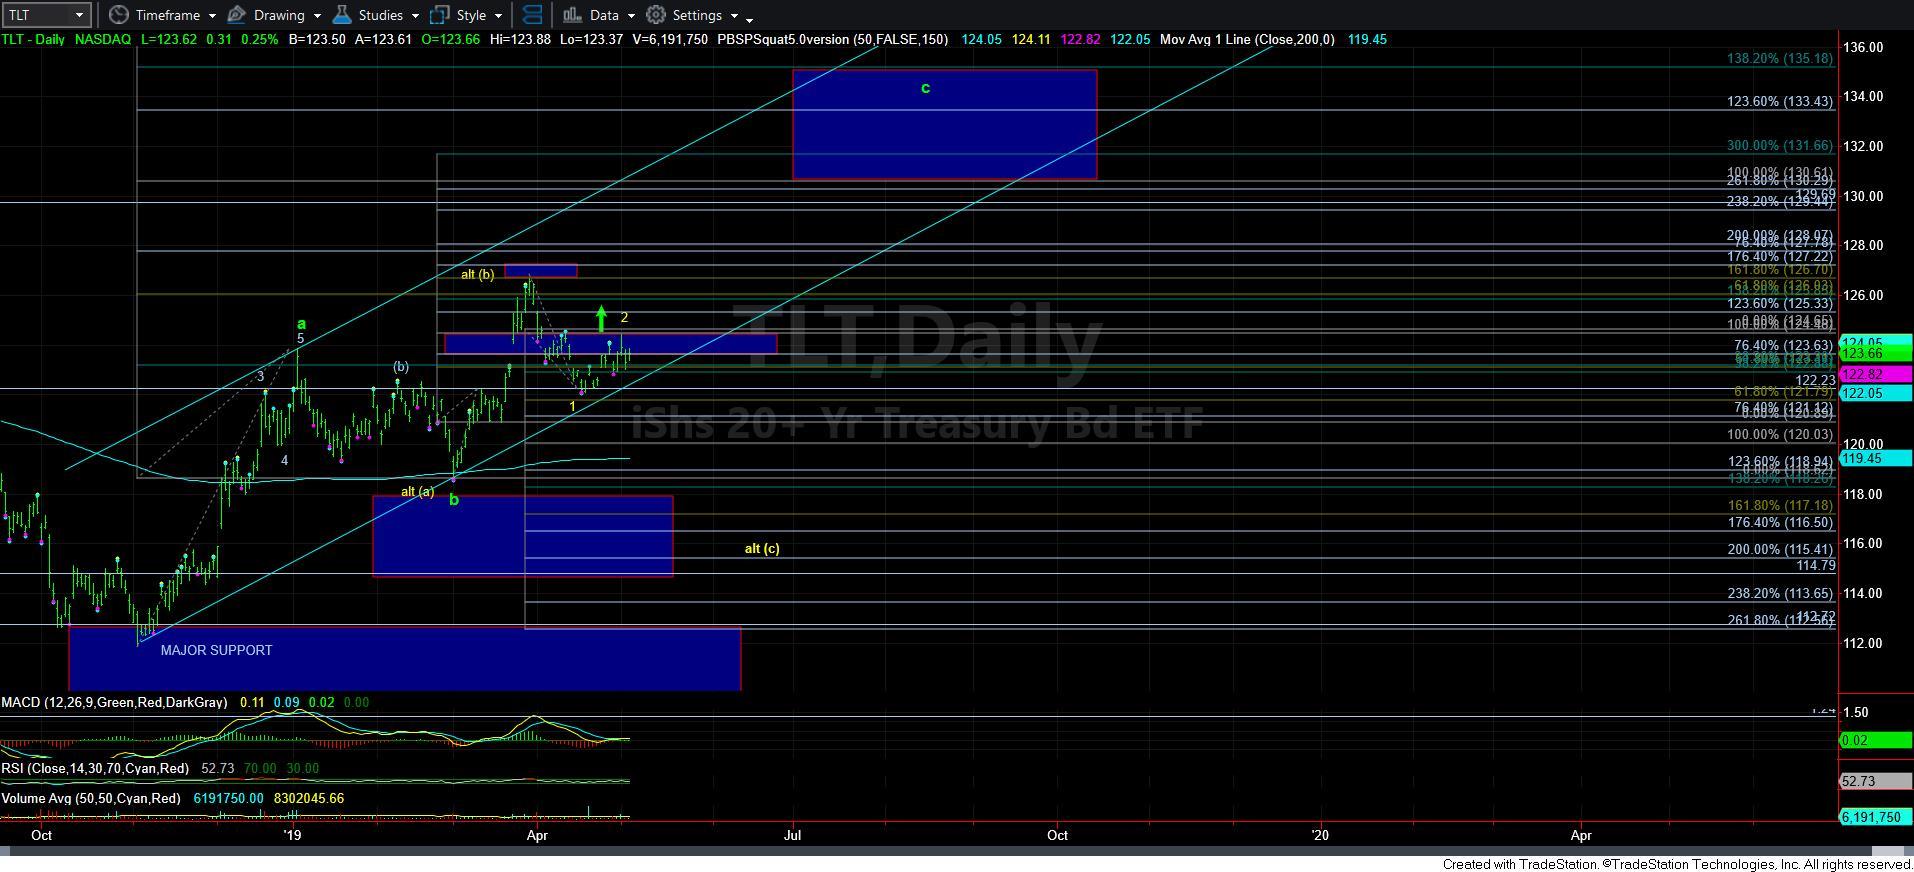
As I explained in the last update I published on TLT, the last rally topped within one penny of the target we had for what would have been wave 3 of an impulsive rally off the 119 region. And, when it broke down below a standard wave 4 pullback level, it suggested that the rally was potentially corrective in nature.
Effectively, what this means is that the market has not likely struck a major top yet, as it is quite rare to see the market provide a lasting top in such a fashion. It also means that there is potential for the TLT to drop down again to the 115-117 region before it begins the rally up towards the 130+ region target we had identified since we bottomed just below the 113 region when we first went long on this chart.
Based upon the structure seen since the 126.69 recent market high, I have questions as to whether that drop has taken shape as an impulsive structure or not. If it has, then a break down below 122 would likely point us down towards the 115-117 region in the yellow [c] wave presented on my attached daily chart.
The alternative would suggest that the market is going to rally in the form of a diagonal towards the 130+ ideal target region sooner rather than later. The rally we have seen off the 122 recent lows has been overlapping, which lends to the lack of clarity I am experiencing at this time.
So, at this point in time, I am probably 50/50 as to whether the market is going to rally directly to 130+, or if it will drop down to the 115-117 region before it begins its next attempt at those targets. For this reason, I have not posted anything of late on this chart.
Should the market provide a bit more clarity in the coming weeks, I will update my perspective. For now, the 122 region is going to be important support, which, if broken, can open a larger downside potential to 115-117.
But, the structure does not lend itself to clarity at this time. And, my mother always taught me that if you don’t have something nice to say, then it is better to not say anything at all. (smile)