I Am Starting To Lean
While I have been preferring more of a 2nd wave pullback for some time now, the market has been terribly stingy with pullbacks since we struck the lows in March. In the meantime, we have been tracking a potential break out scenario for the SPX, yet it has refused to follow through on it when it had the chance into the open today.
When the market has a set up to break out in the heart of a 3rd wave and chooses not to do so, oftentimes it is an indication that we are just not ready for that move yet. This may be one of those times.
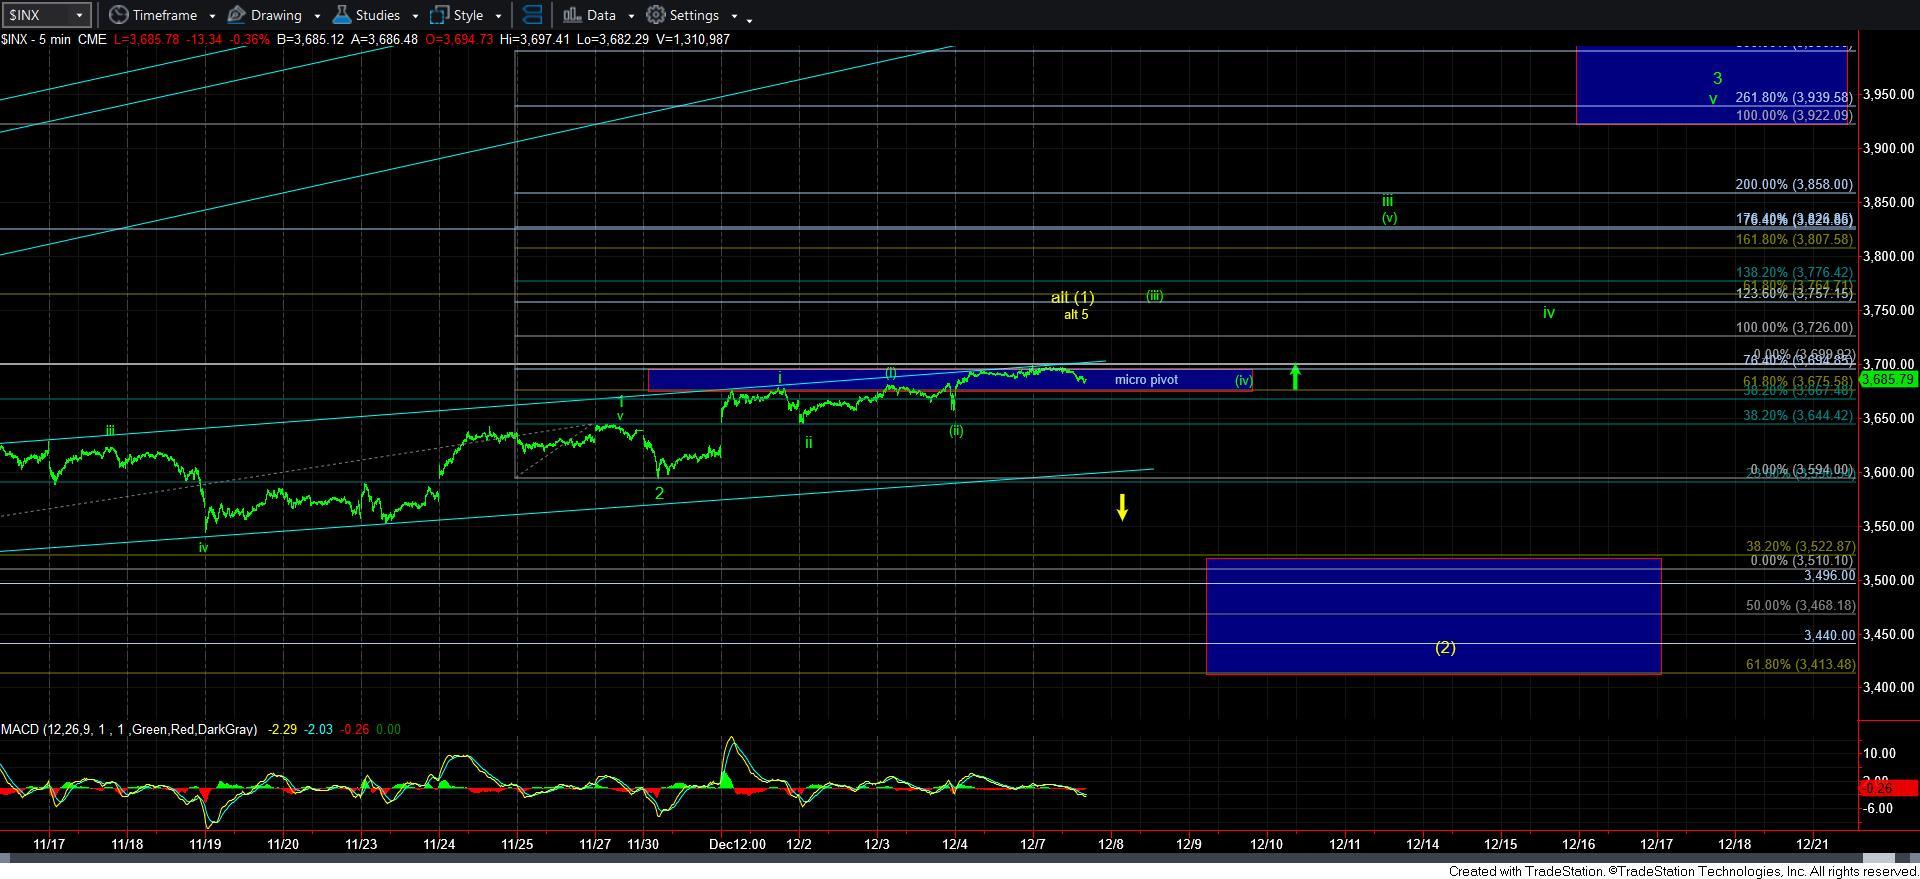
We closed the market on Friday with the market having an opportunity for a sizeable gap up in furtherance of wave [iii] of iii of 3, as can be seen on the 5-minute SPX chart, yet the market has clearly chosen to move in the other direction. This is one indication that has me leaning towards the yellow count now.
Moreover, the structure in the futures have begun to overlap much more than I would expect at this point in time. While the futures can still push higher one more time, it is starting to look like this is taking shape as an even bigger diagonal for what may be the 5th wave of yellow wave [1]. Of course, this means it can also be a larger wave 1 of [3] in green, and the appropriate count will not likely make itself known just yet. But, it does seem as though the probabilities are starting to shift again towards the potential for more of a wave 2/[2] in the coming days.
However, take note that as long as the market remains over the 3657SPX level, it can still choose to take the more aggressive path higher, as present at this time in green on the 5-minute SPX chart. Should we see a gap up and rally to at least the 3725SPX region, then as I highlighted over the weekend, the 3675-3694SPX support region will tell the story. If we pullback and hold that support, then the market is already in wave 3 of [3], and we will likely continue to rally much higher in the coming month. However, even if we do gap up, but then break back below the micro pivot, it is likely still going to provide us a wave 2/[2] pullback thereafter.
So, the market has been at a relative standstill for the last month, and has just refused to make a decision. So, continue to follow the support and signal levels because once the market does make a decision, you will know just as quickly as I will, as we are all following the same structure.
But, please remember that this is still a bull market and surprises often come to the upside. Moreover, when the market has a set up for a heart of a 3rd wave to take hold, it is not wise to ignore that potential, as it can really begin at any time now. While I may prefer more of a pullback, the market owes us nothing, and we have to recognize when the heart of the 3rd wave has taken hold, and stop “wishing” for more of a pullback at that point in time. For now, I am still learning towards that pullback until the market proves otherwise.
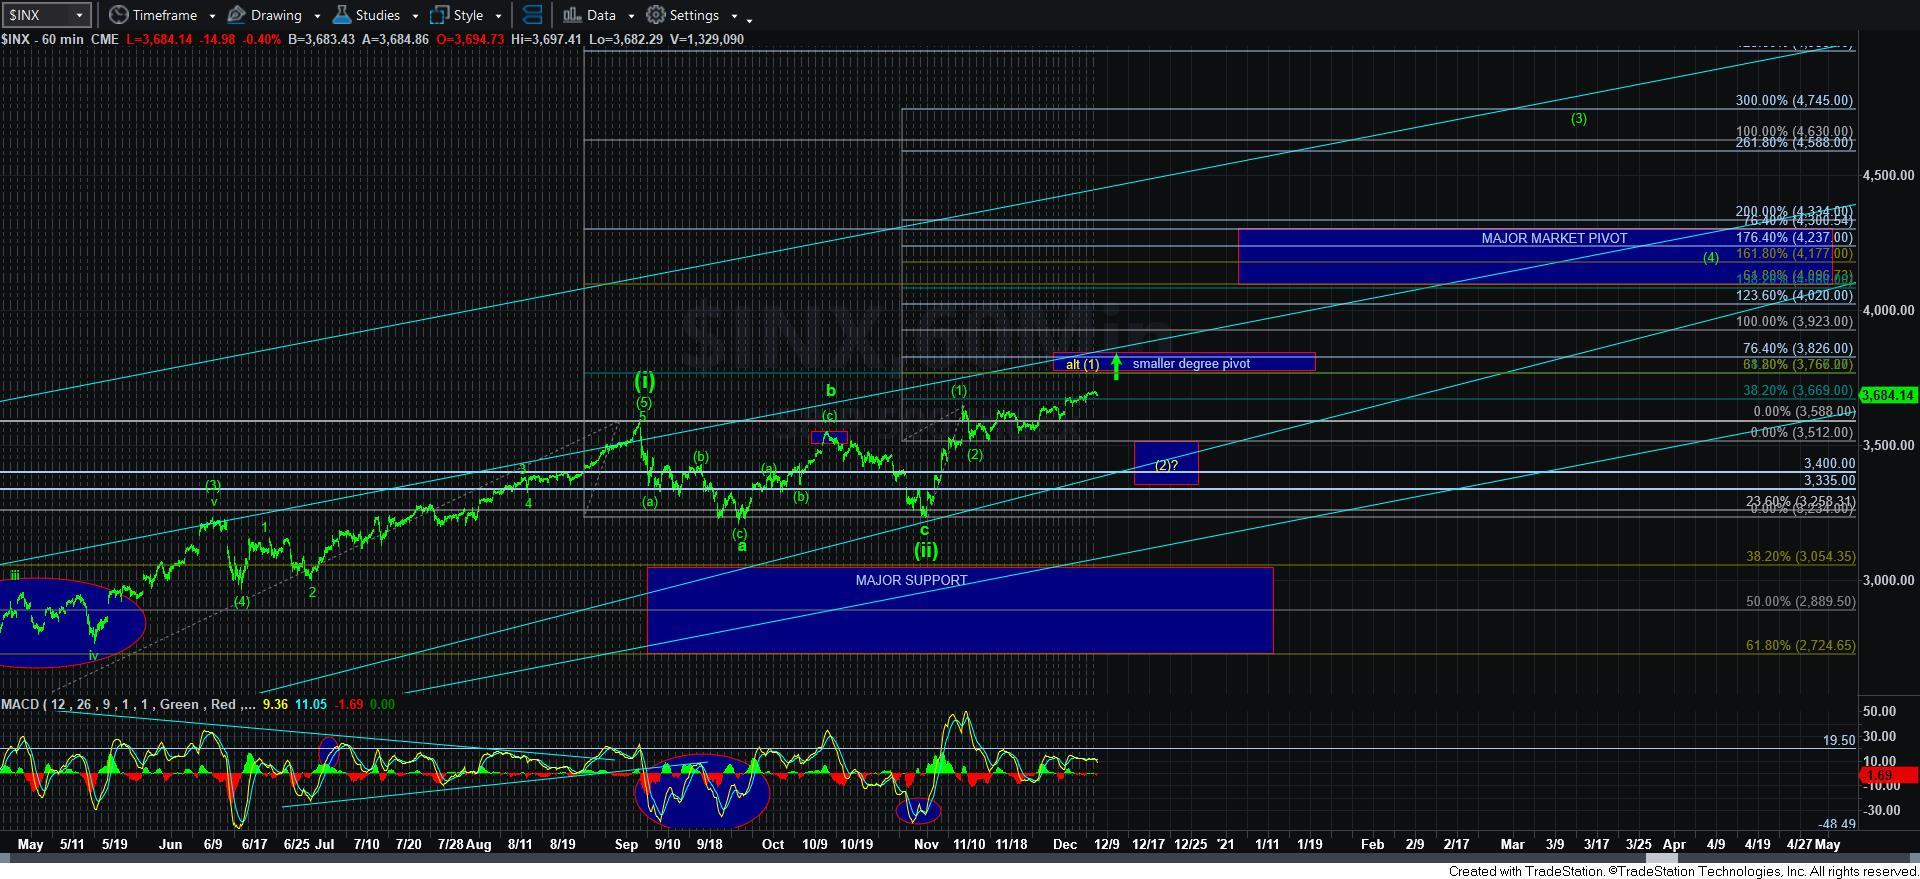
There is one final point I would like to highlight about the charts. If you look carefully, you will see several pivots noted on the two charts I have posted. Each represents a different wave degree. For example, the pivot on the 5-minute chart represents the pivot (.618-.764 extensions) for waves 1-2 within wave [3], whereas the smaller degree pivot on the 60 minute chart represents the pivot for waves [1] and [2] of wave [iii]. Lastly, the major market pivot represents the pivot for waves [i] and [ii] off the March lows. So, when I say to understand and know your time frames, this is to what I am referring, as the supports and resistances are different for the multiple time frames we are tracking during this rally. Some consider this the hardest part of Elliott Wave analysis to track during a market trend, so I wanted to at least bring your attention to it.