How Will This [b] Wave Resolve?
So, this is the question of the month. And, clearly, there is a direct way, and the scenic way.
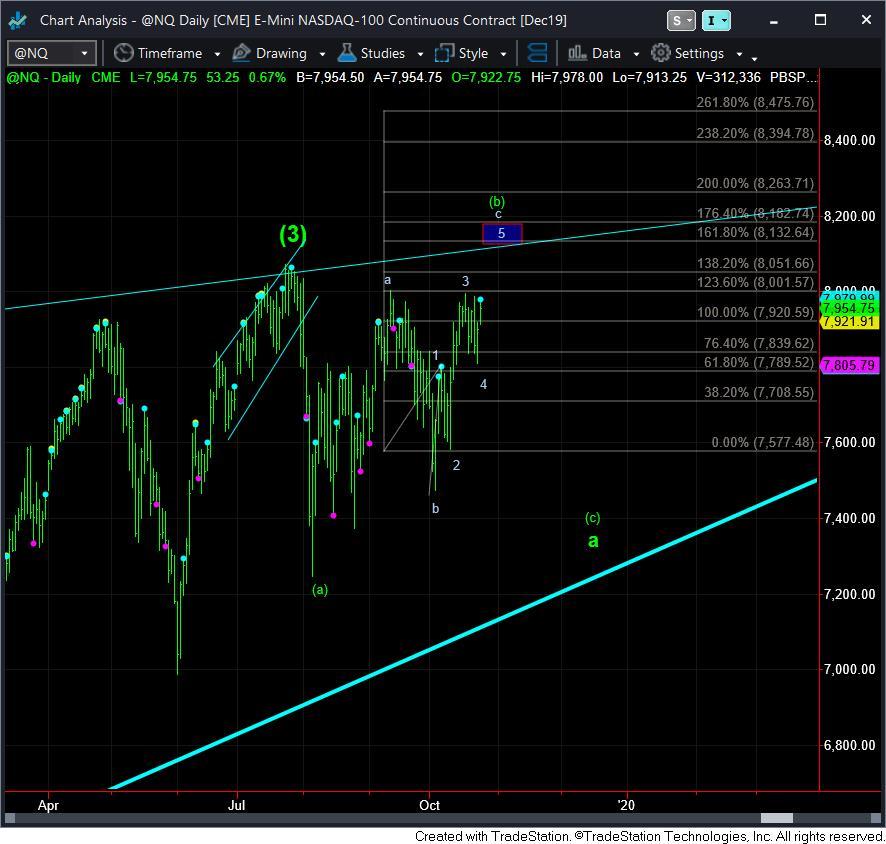
For those that heard my live video on Wednesday, I took a peek at the NQ chart, and it game me a bit of insight. You see, just as I was looking for a possible higher high in this [b] wave for the SPX, the NQ has the same potential. And, in the NQ, we would need a 5th wave higher to complete an ending diagonal for the c-wave of the [b] wave right into standard Fibonacci extension targets and the long term trend line overhead. This would be the scenic route.
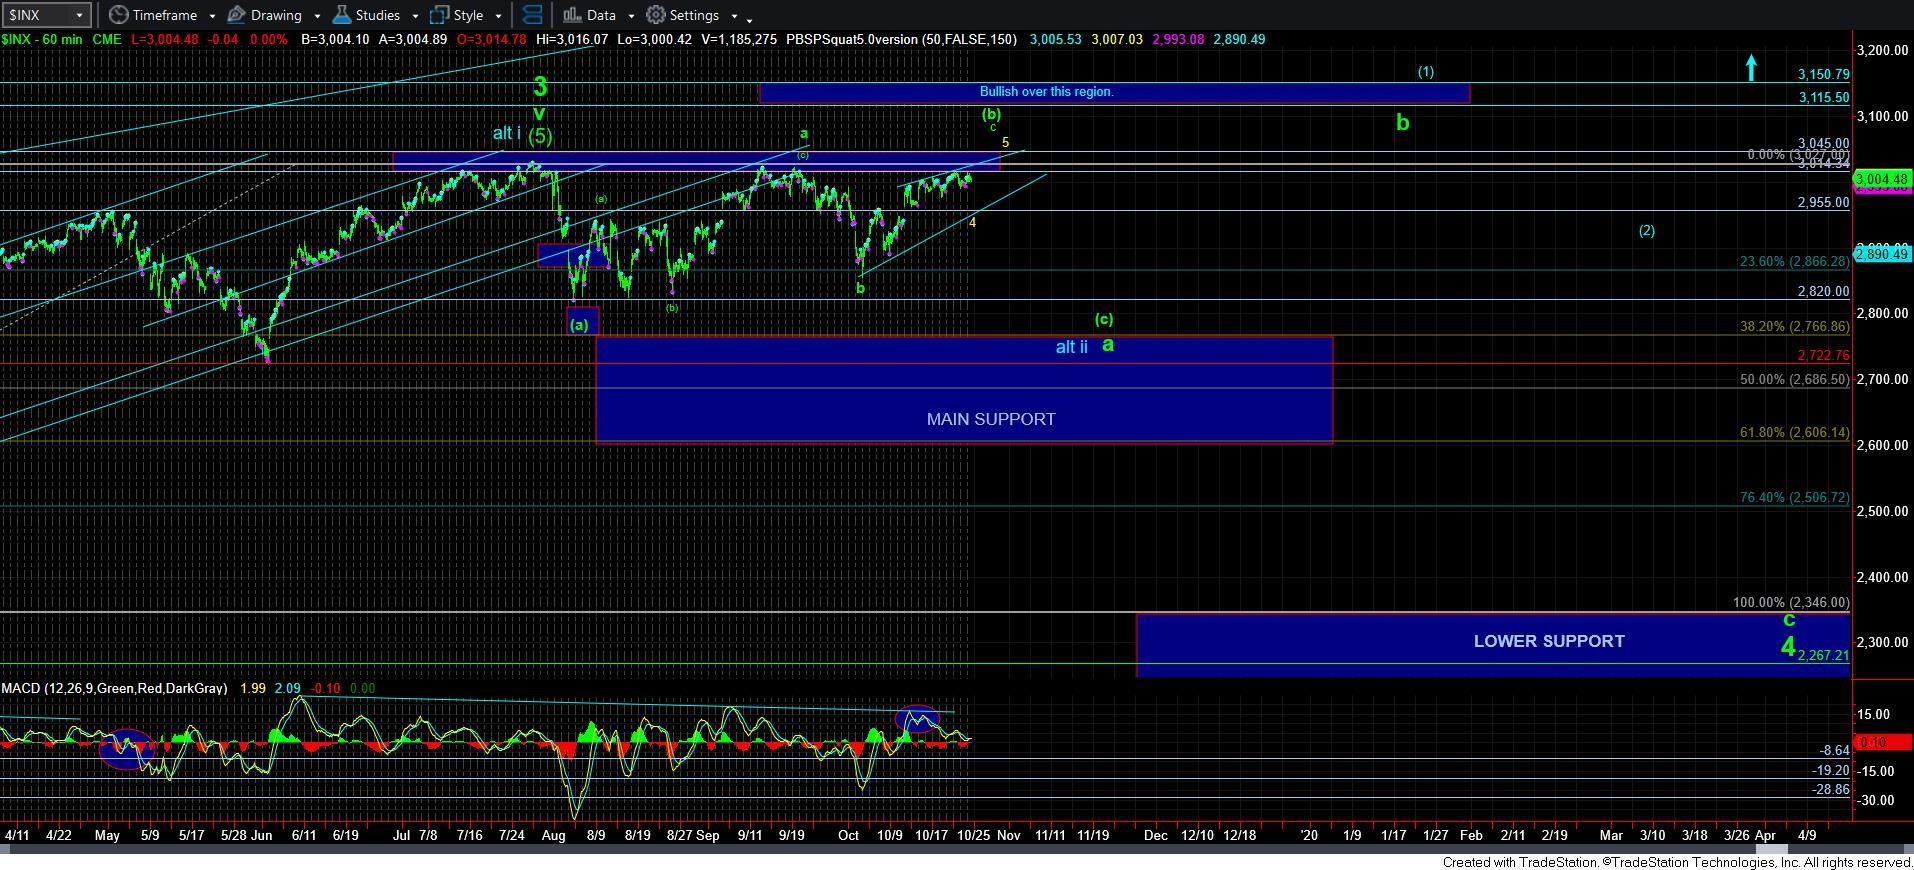
The more direct route would be an immediate and sustained break down below 2955 in the SPX. But, I am not as confident of this potential due to the relative proportions between the a-wave and c-wave within the [b] wave. Ideally, this c-wave can take a bit more time to fill in before this [b] wave completes. But, as I noted before, if we should see a more immediate and sustained break down below 2955SPX, I am not going to argue with the market.
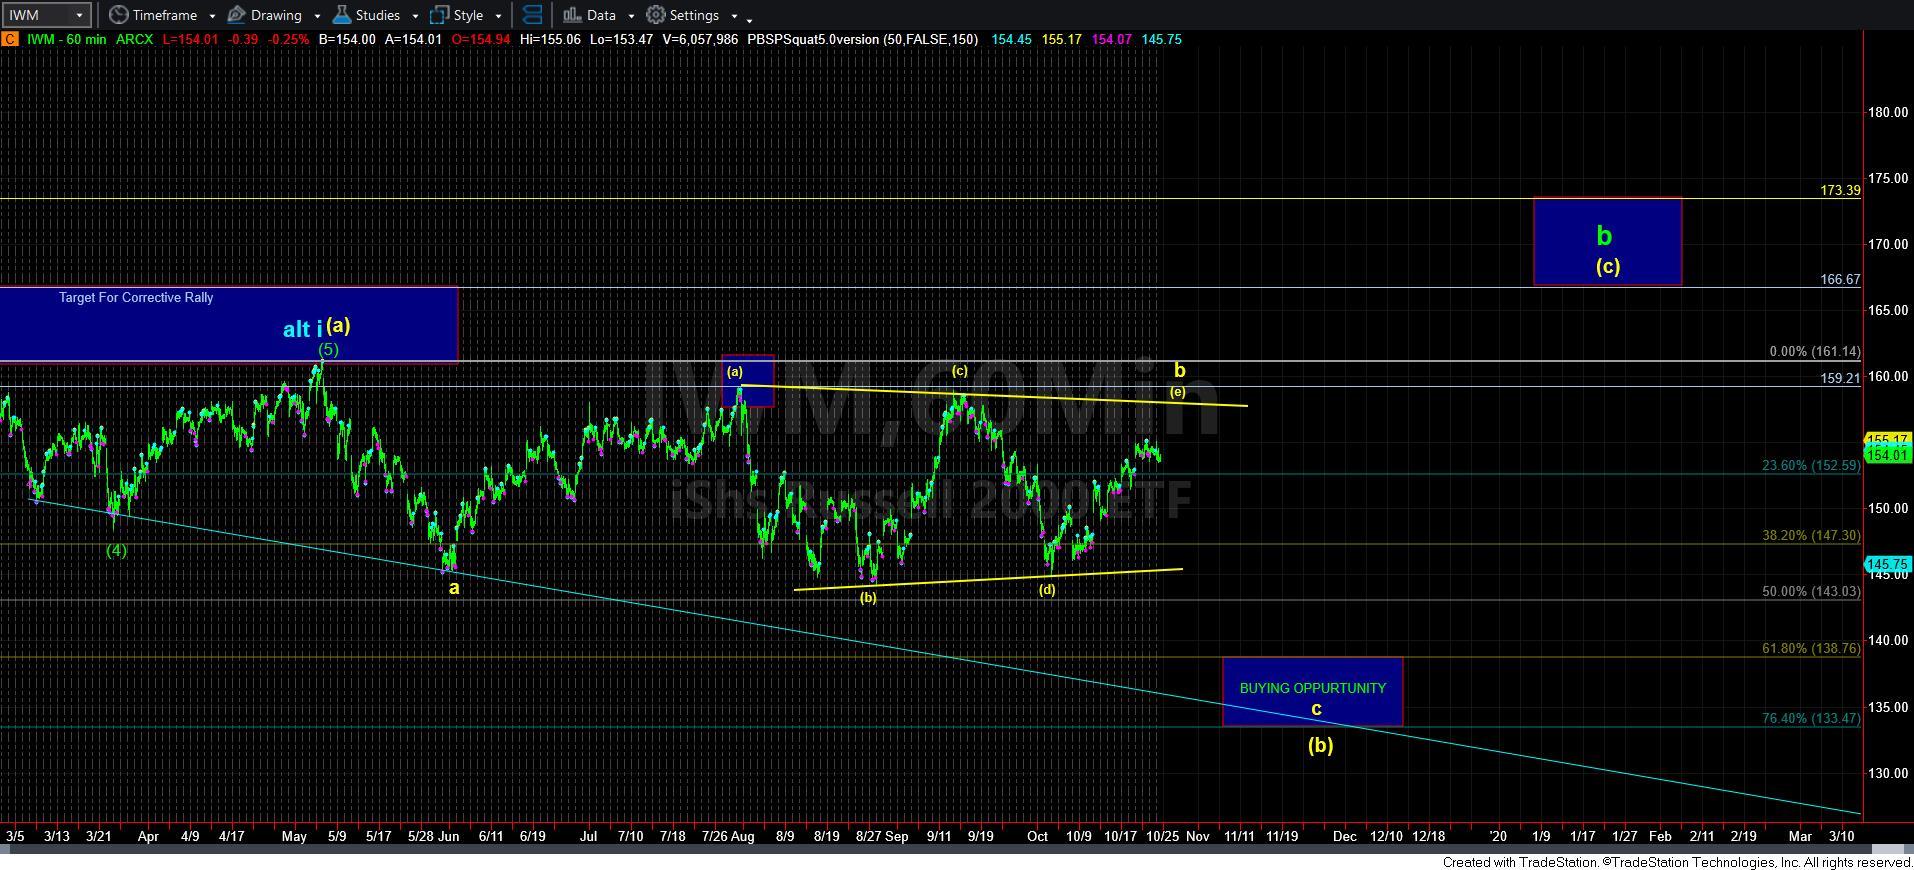
Lastly, as you can see from the IWM chart, it also has room overhead if it wants to target the trend channel in what I am counting as a b-wave triangle. But, please recognize that, based upon my experience, most [e] waves within triangles do not reach the downtrend channel and come up short.
So, as the market continues to grind within this current region, I am tracking two potential ways in which this [b] wave can complete, and I am leaning towards the more protracted path outlined above, of course, unless we see a break down below 2955SPX.