How Soon Can We Complete [2]?
There is no doubt that the decline today was not high on my list of options I was tracking. While I have recognized it as a possibility, it was not one of the patterns I was tracking. Yet, the market made its choice.
Since the market began to fall apart from the impulsive rally I was trying to track earlier this week, it made it clear to me that we will likely be getting a bigger wave [2] pullback, which I outlined several days ago. Moreover, I also noted when we rallied up to the 3900SPX region that it was a good time to buy some protection, as I think the probabilities had increased that we would be taking a trip down towards the support for the bigger wave [2].
The main reason I did not hold the immediate drop potential in such high regard was because not only did I not have a 5-wave c-wave to complete a bigger a-b-c structure, I also did not have any impulsive 5-wave drops to suggest that the c-wave down was in progress. So, without either of those structures, the market was not providing me any clear indications that an immediate drop was going to be seen. Most of the time the market provides those indications, but in the minority of the times, it does not.
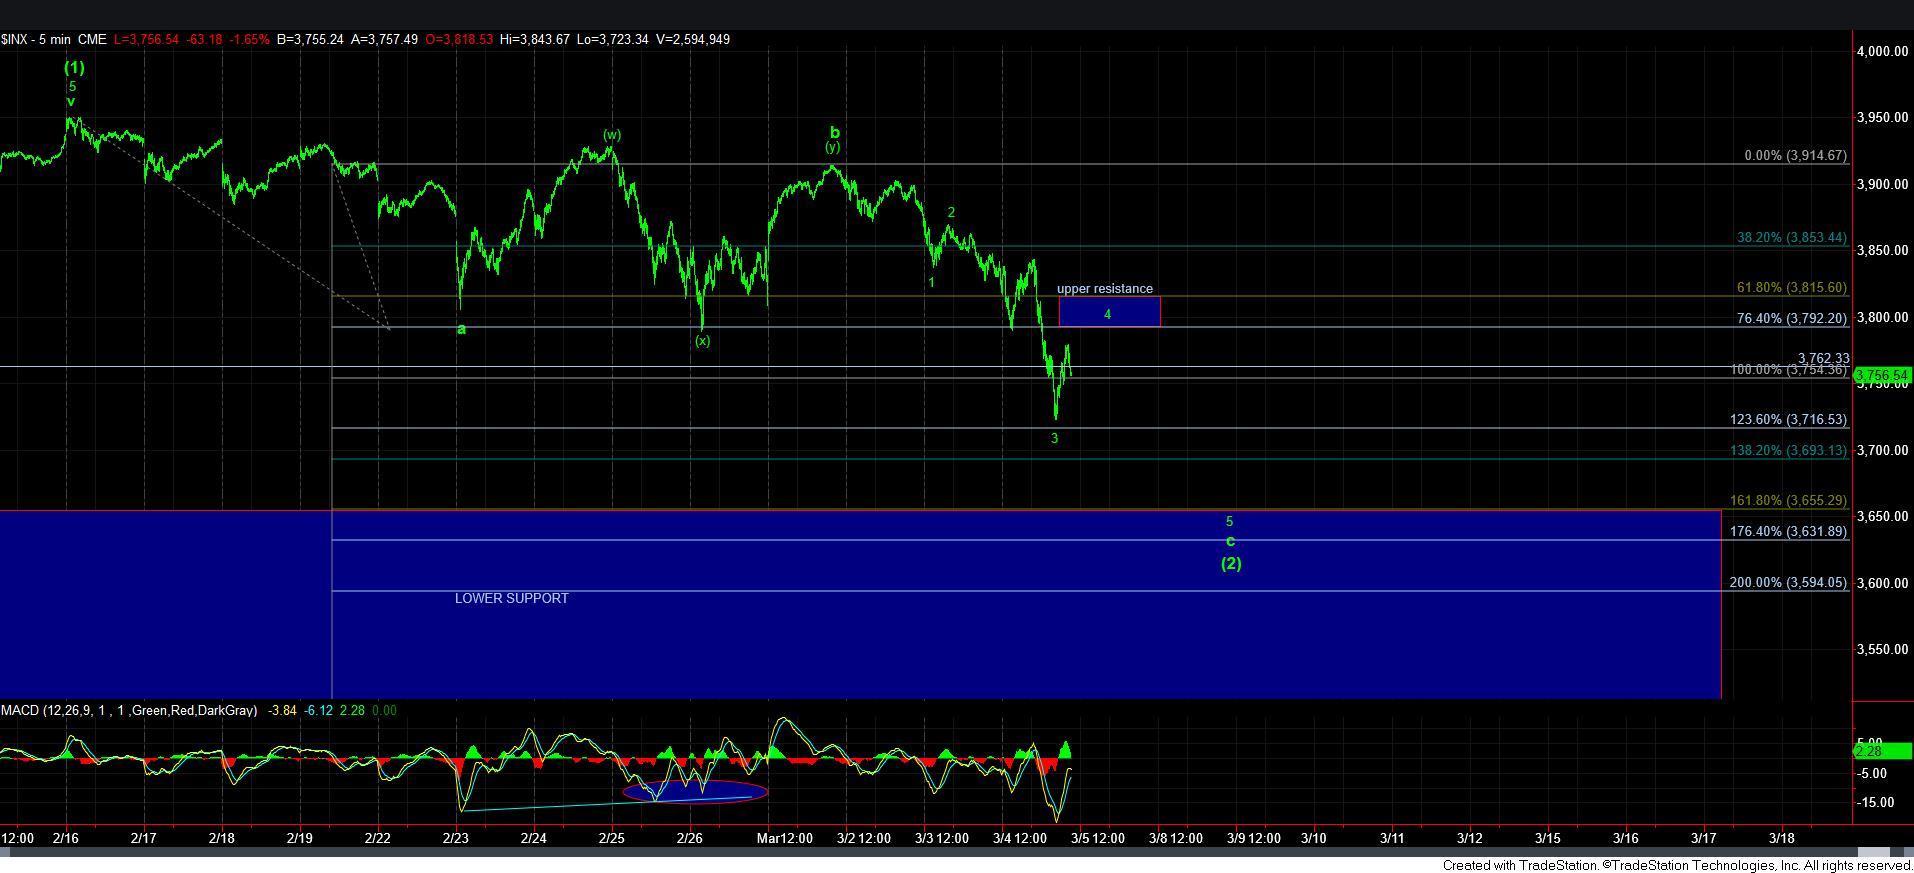
What the market did provide was what I would have to count as a [w]-[x]-[y] pattern for the b-wave, which is much more rare, and only provides us with a 3-wave rally to complete the last leg of the b-wave. For now, this is seemingly what the market has provided to us.
But, again, once I recognized the potential for us to be dropping much lower in the bigger [2], I took the first opportunity to buy some protection, as we can never be certain as to how these corrective structures will take shape. And, this one is a definitely higher on the levels of complexity.
While I was trying to earlier track a possible impulsive 5-wave c-wave decline, the move through 3766SPX suggested that it was not what the market had in mind. Rather, it would seem that we may be getting an ending diagonal to complete this c-wave of [2].
I want to again state that I am not highly confident in this structure. It does not really provide for a high level of probability due to the many overlapping 3’s we have within this structure. So, for now, I will say that this is my primary count simply because I think it is the best I can come up with. But, by no means do I think it to be a high probability pattern for now.
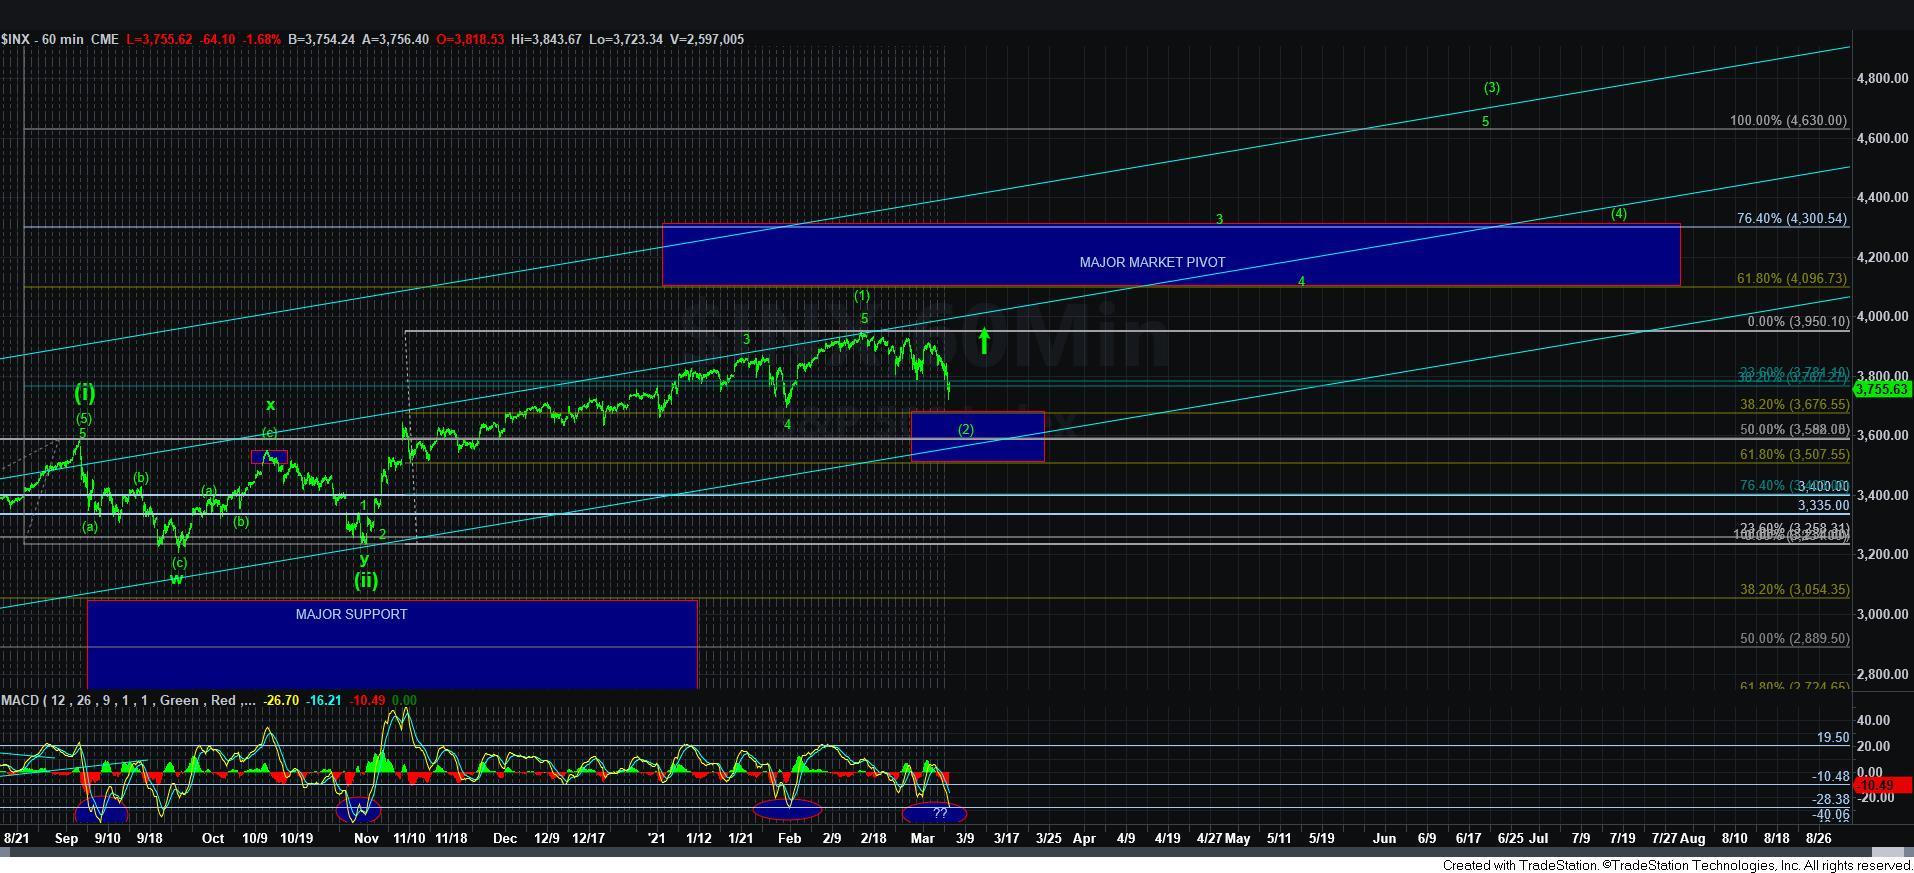
But, I want to now take a step back and have everyone take a breath, and look at the 60-minute SPX chart. I have simplified that chart and cleaned it up. For now, my waves 3-4-5 of wave [3] are simply guestimations, as I still do not have wave [2] in place. Once wave [2] is in place, I can then provide you with high probability targets for waves 3-4-5 of wave [3].
Moreover, please take note that the MACD is now again hitting the levels at which major bottoms have been struck within this rally since March 2020. In fact, we have not been this oversold since June of last year. So, maintaining extreme bearish perspectives here is not usually advisable when we have become this oversold, and are nearing a target.
At this point in time, I have nothing to suggest that this corrective decline has completed. Furthermore, this also means that I will be again tracking the potential for the 1-2, i-ii structure for the break out in wave iii of 3 of [3], which is the heart of the rally I am still expecting in 2021.
Also, many of you that have been tracking the StockWaves set ups have likely seen a number of them which have invalidated their most immediate bullish set ups. In my humble opinion, I believe it is simply because we are seeing a larger 2nd wave take shape in many of those charts, which means their 3rd waves have really not begun in earnest. Consider this when you are thinking about your frustrations about a set up breaking. It is simply providing you a better opportunity when you look towards the rest of 2021, similar to what we are seeing in the SPX.
So, in summary, I noted earlier this week that the 3500-3650SPX region is our ideal target for a bigger wave [2], as it represents the .618-.382 retracement of what I am counting as wave [1]. At this point in time, it is looking like the upper end of this support can provide us with all of our wave [2], which should not come as a surprise due to all the shallow retracements we have seen to date.
And, yes, keep in mind that this is a retracement of the rally off the November low. Since we have not seen much in the way of retracements for many months, this may “feel” quite bad. But, in fact, this is still quite shallow for this degree of pullback thus far. Please stay focused on the bigger picture, as it is not likely that this bull market has ended. Rather, I still think we have many innings left to the this baseball game.
(This was written fast to get it out before the close, so I apologize for any errors.)