How Much Longer Can We Levitate
With the structure of the market action off the December 2018 lows quite full to the upside, having come within 6 points of the target we set, and with the technical indicators rolling over, we clearly have to wonder how much longer this market can continue to levitate up here before it finally cracks and provides us with the pullback we still expect.
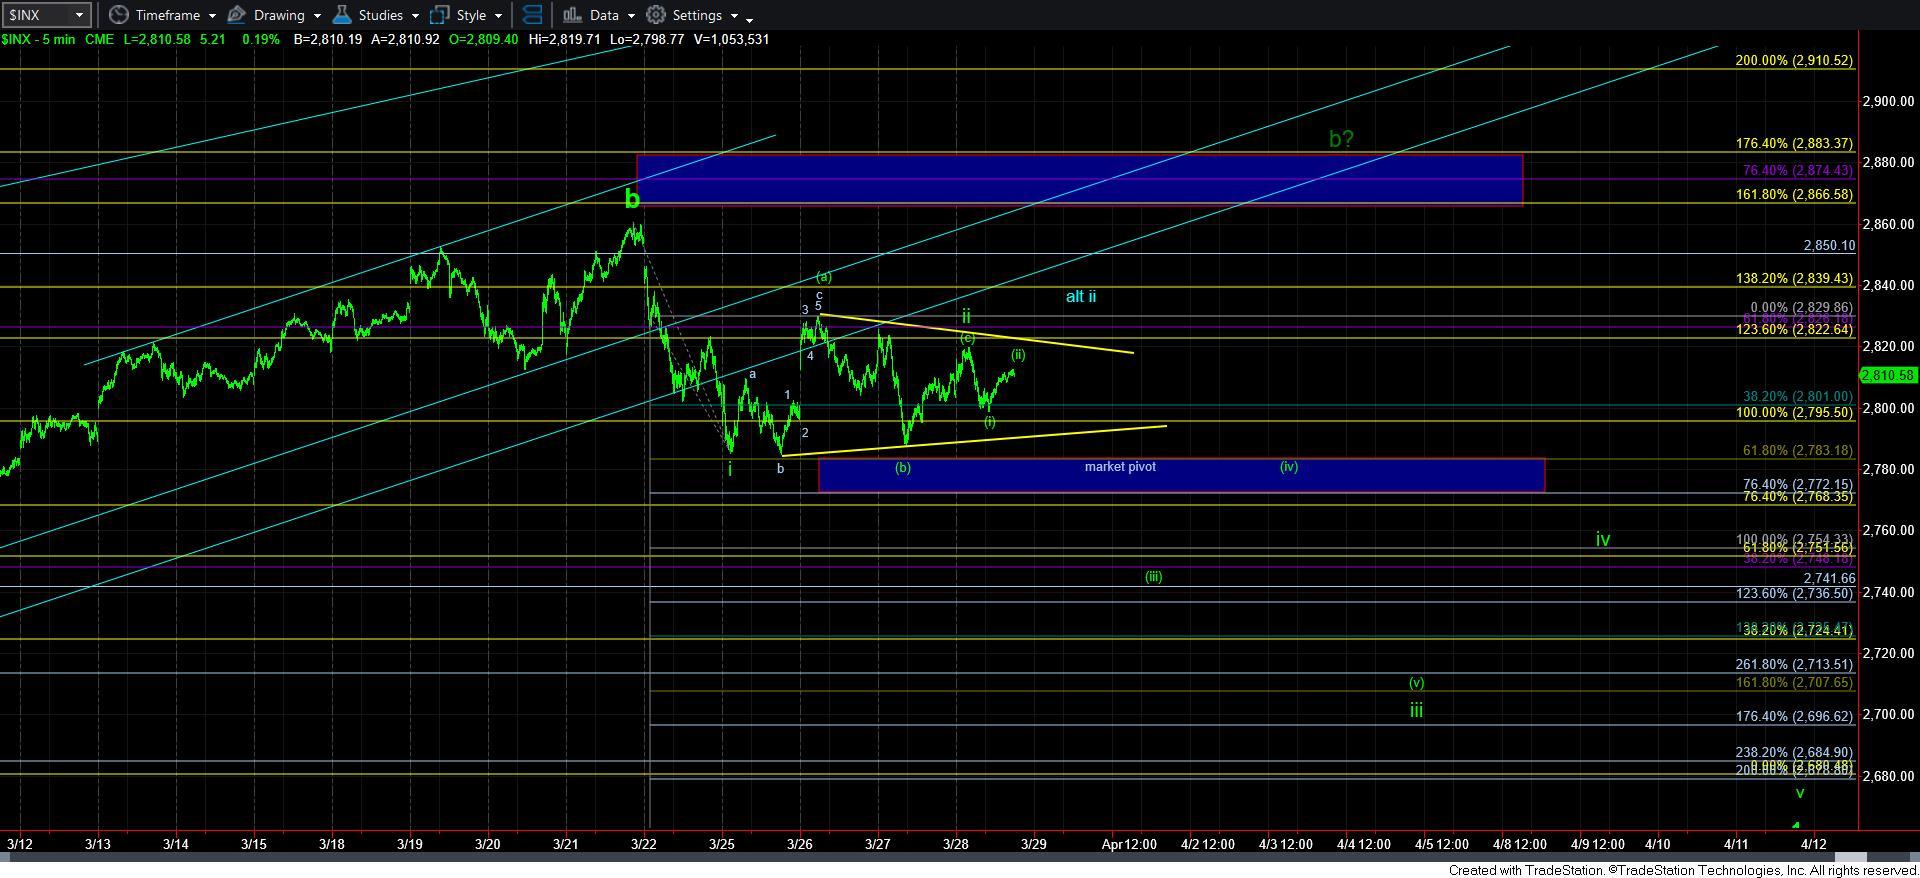
As I mentioned in yesterday’s update, based upon yesterday’s action it looked less likely that the market was ready to immediately break down. Rather, I thought we could see a bit more action for wave ii take shape.
Well, today, we rallied up higher, however, the market did not reach standard targets we would normally expect for a [c] wave within a wave ii. Rather, the high we struck today came up even short of the [c]=.764*[a] calculation, when standards ordinarily present us with an [a]=[c] structure for corrective structures. And, when I see the type of structure presented at the .764 ratio, it does make me skeptical about whether we really have a completed wave ii.
While I now have my primary count as the i-ii being in place at this time, I still need the market to prove this to us by breaking down at least below the low we struck this week. While there are still signs that the market wants to push higher before we finally break down, I am reticent to make any count that primarily points higher my primary when we are staring at a potential wave iii coming down at us.
Experience has taught me that it is not healthy to my account to trade into the face of a 3rd wave pointing in the opposite direction. So, while I still do see potential for this market still pushing higher before we are ready to break support, I am not going to post that as my primary count due to the risks presented by this current break down potential structure.
I also want to disagree for a “teaching moment.” When I see consolidations present me with .764 ratios between waves, I automatically consider triangles. Most often, you see those ratios within triangles, so seeing this .764 ratio within today’s action has triggered at least a consideration of a triangle. However, the triangle in this region would be a b-wave triangle, and is bounded by the yellow triangle structure on the 5-minute chart.
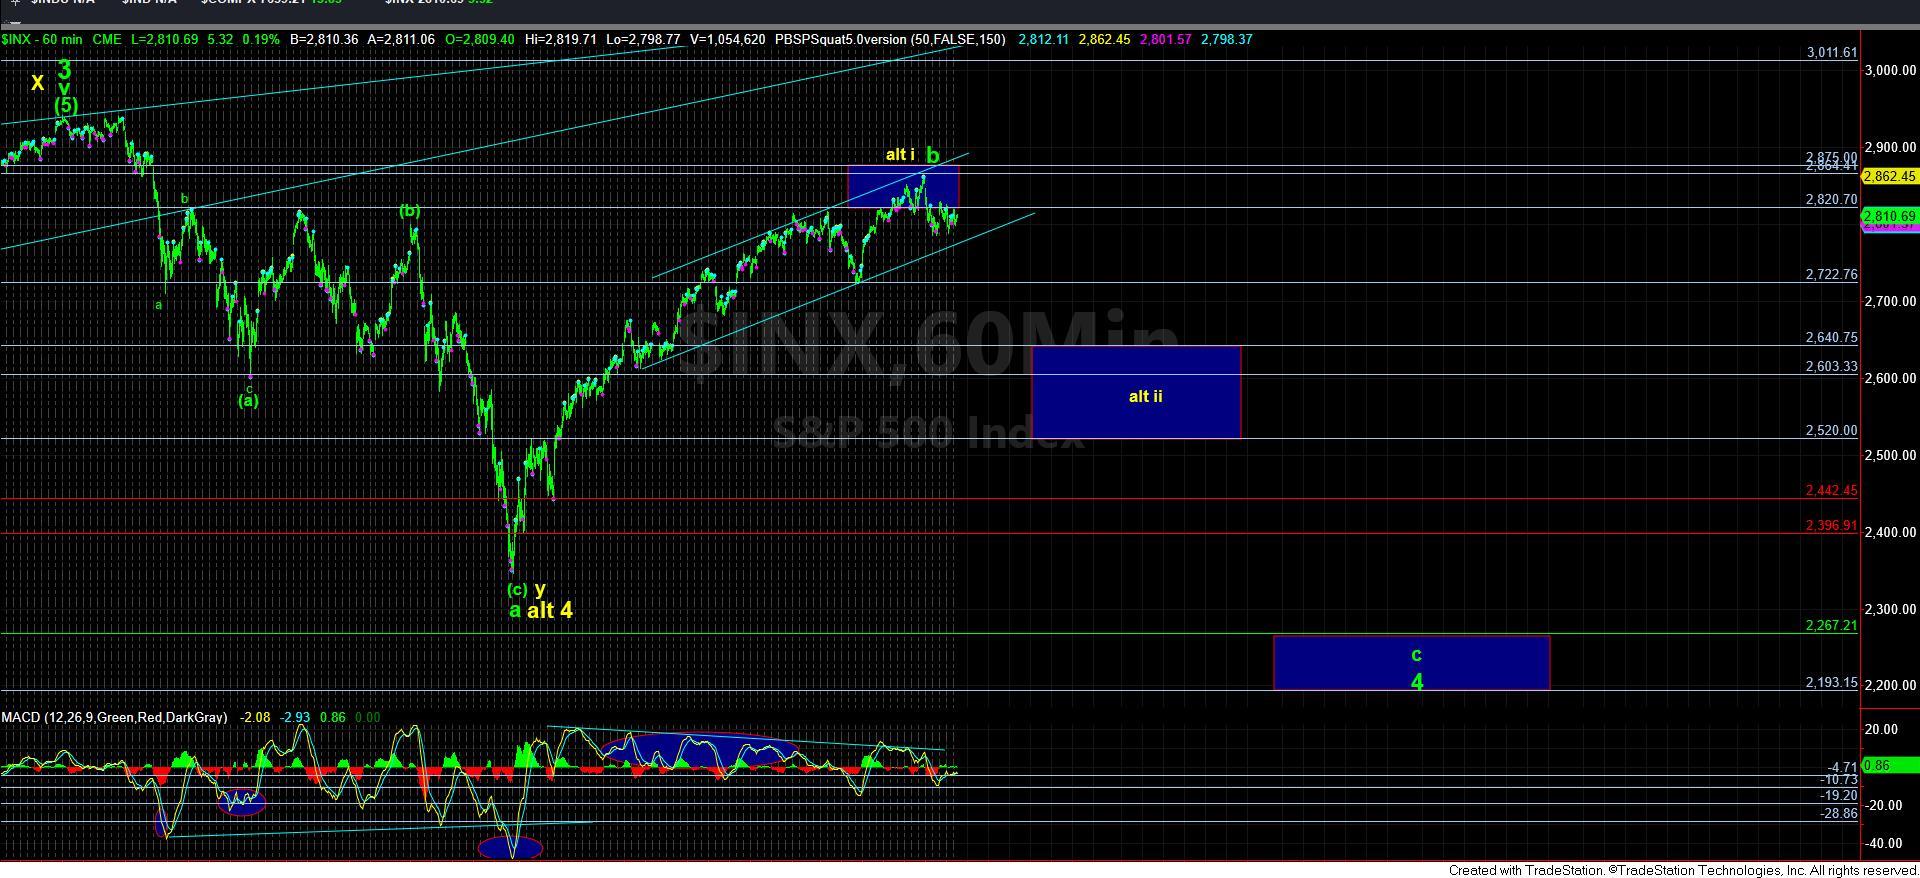
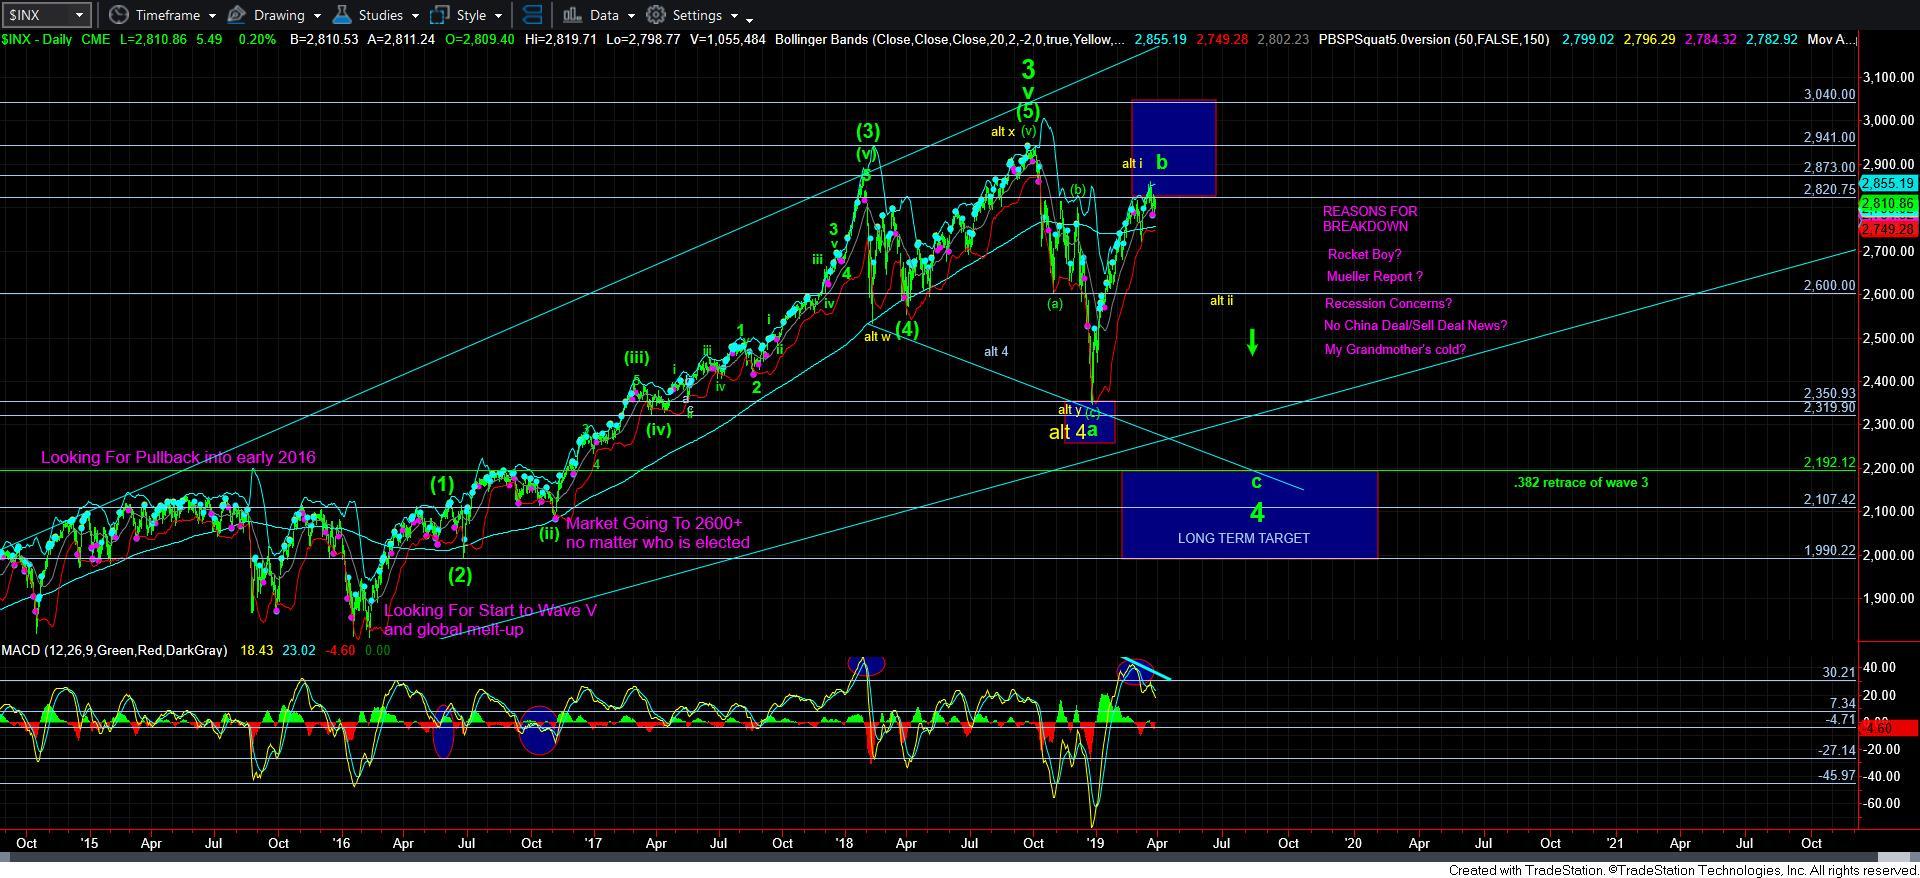
Yet, such a triangle would not be seen within an impulsive c-wave to the downside, as we only see triangles in 4th waves and b-waves. So, if a triangle does take shape over the next day or so, then I will have to give much stronger consideration to the larger degree yellow count on the 60-minute and daily charts. A b-wave triangle taking shape here would suggest this is a b-wave within an [a] wave within the yellow wave ii, and we would still likely see the c-wave down to complete the [a] wave of wave ii into the 2740/50SPX region, followed by a [b] wave corrective rally, and a [c] wave down towards the 2600-40SPX region to complete wave ii.
For now, I am simply using this ratio analysis as a teaching moment, and it is not something I am strongly considering until the market proves to me that I need to do so. But, I wanted to at least highlight this potential on the chart.
As far as the micro structure, clearly, today’s high is our initial point of resistance, and through that, 2832SPX can present us with a w-x-y structure for wave ii. Over 2832, we still have resistance in the 2850-55SPX region as well.
Until the market can begin to prove that the heart of a wave iii to the downside is taking hold by breaking below this week’s low, it still retains potential for more consolidation/retracement. But, my primary count is presented as more protective at this point in time for all the reasons noted above. And, lastly, as noted several times this week, we need to break down below the market pivot, and then successfully test it as resistance from below to point us down towards the 2700SPX region to complete wave 1 of the c-wave to the downside.


