How Much Gas Is Left in the Tank?
 By
By
Today, we saw the SPX push to new highs while the NDX continued to lag. The RUT also managed to notch a new local high, though it remains well below its prior all-time high. With this continued grind higher, the real question remains: how much more upside can this market squeeze out before we see any meaningful pullback?
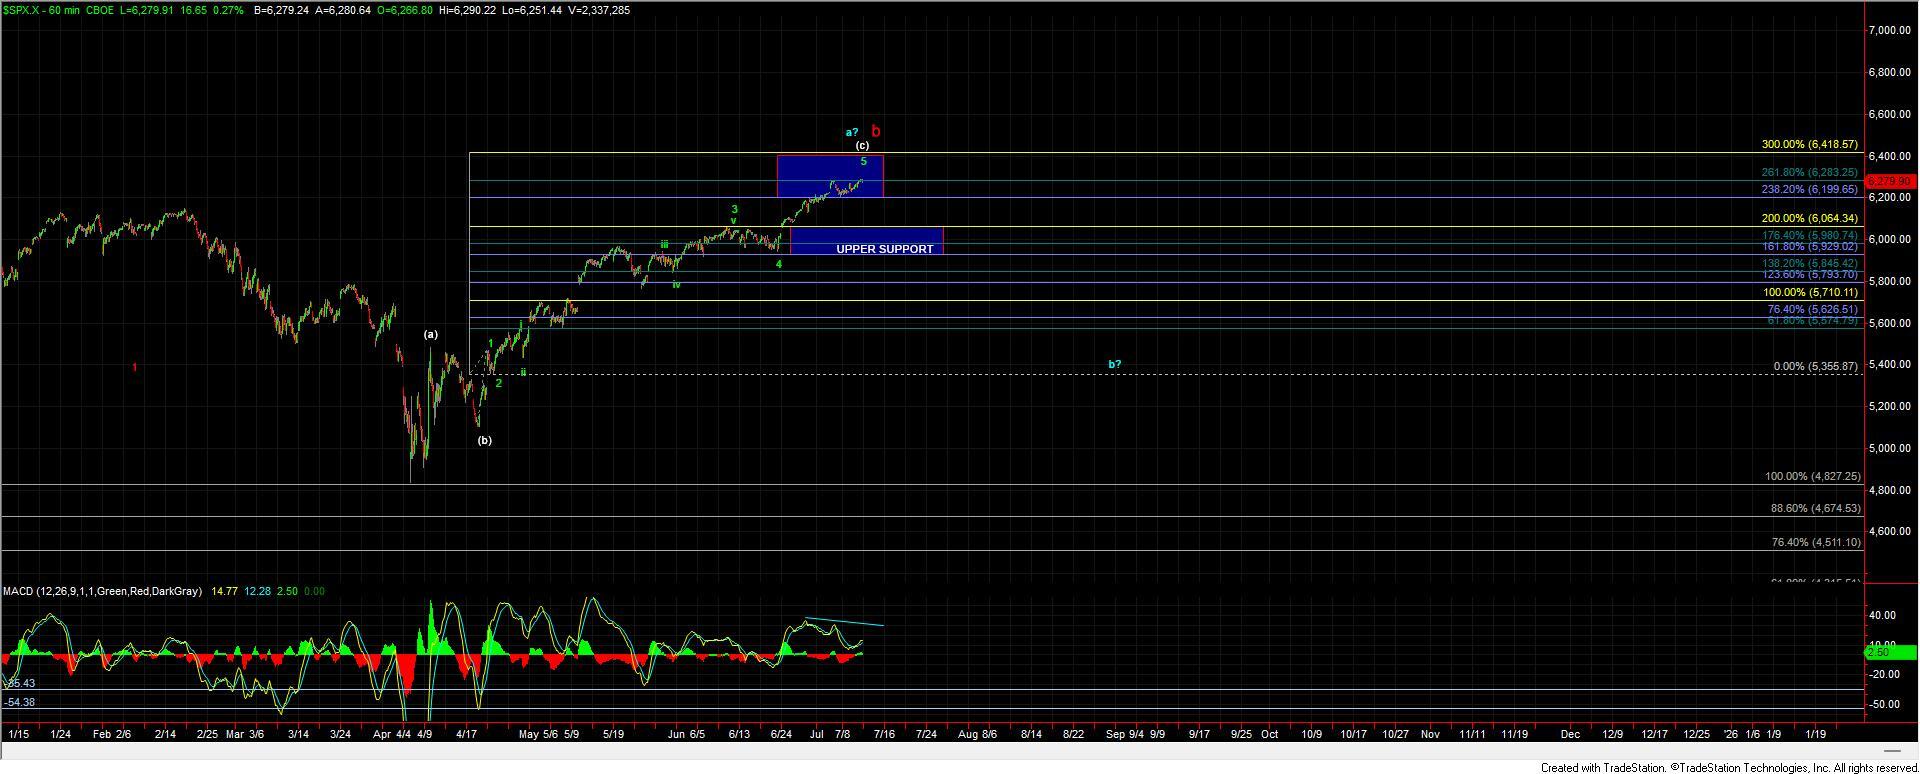
As we've highlighted previously, the count in this region is quite full and increasingly extended across multiple timeframes. That said, until we see a confirmed break of support and/or a clear five-wave move to the downside, we simply do not have confirmation of a top just yet.
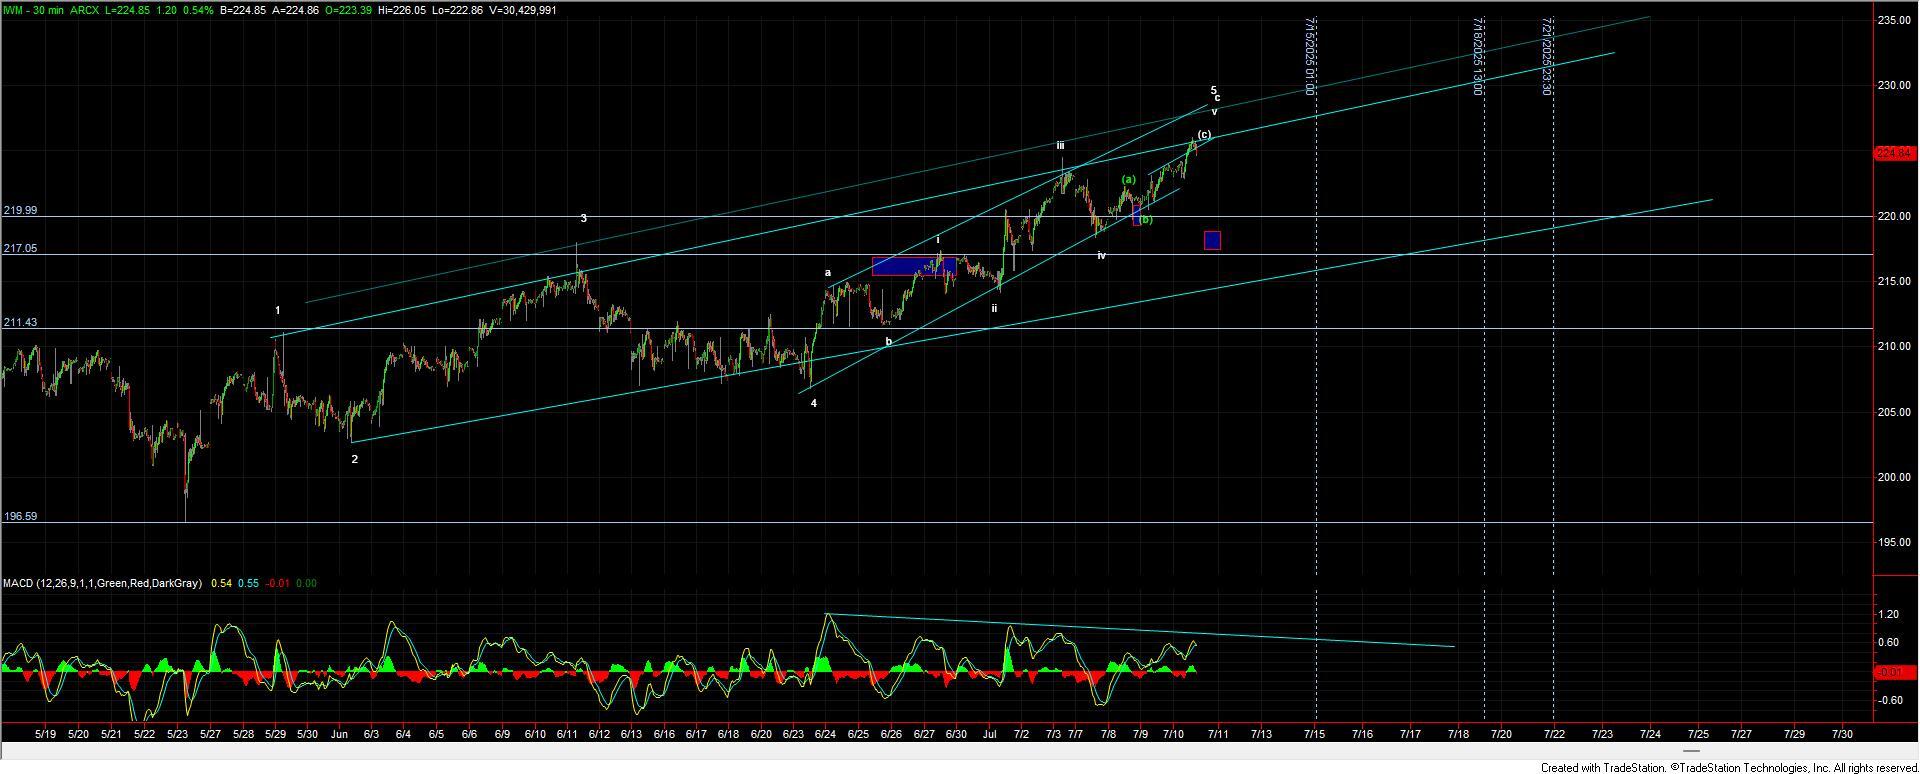
What does have my attention here is the structure unfolding in the RUT. It is now developing a fairly clean ending diagonal off the May 23rd low, and even more interesting is the appearance of a smaller-degree ending diagonal forming within the subwaves of that larger pattern off the June 25th low. While we still need confirmation via a break of support, this dual-diagonal setup has me on high alert. As we know, once an ED completes, the resulting reversal tends to be swift and decisive.
So while the market continues to grind higher, this setup leaves the region increasingly precarious. We still require confirmation of even a local top, but the current pattern here warrants caution.
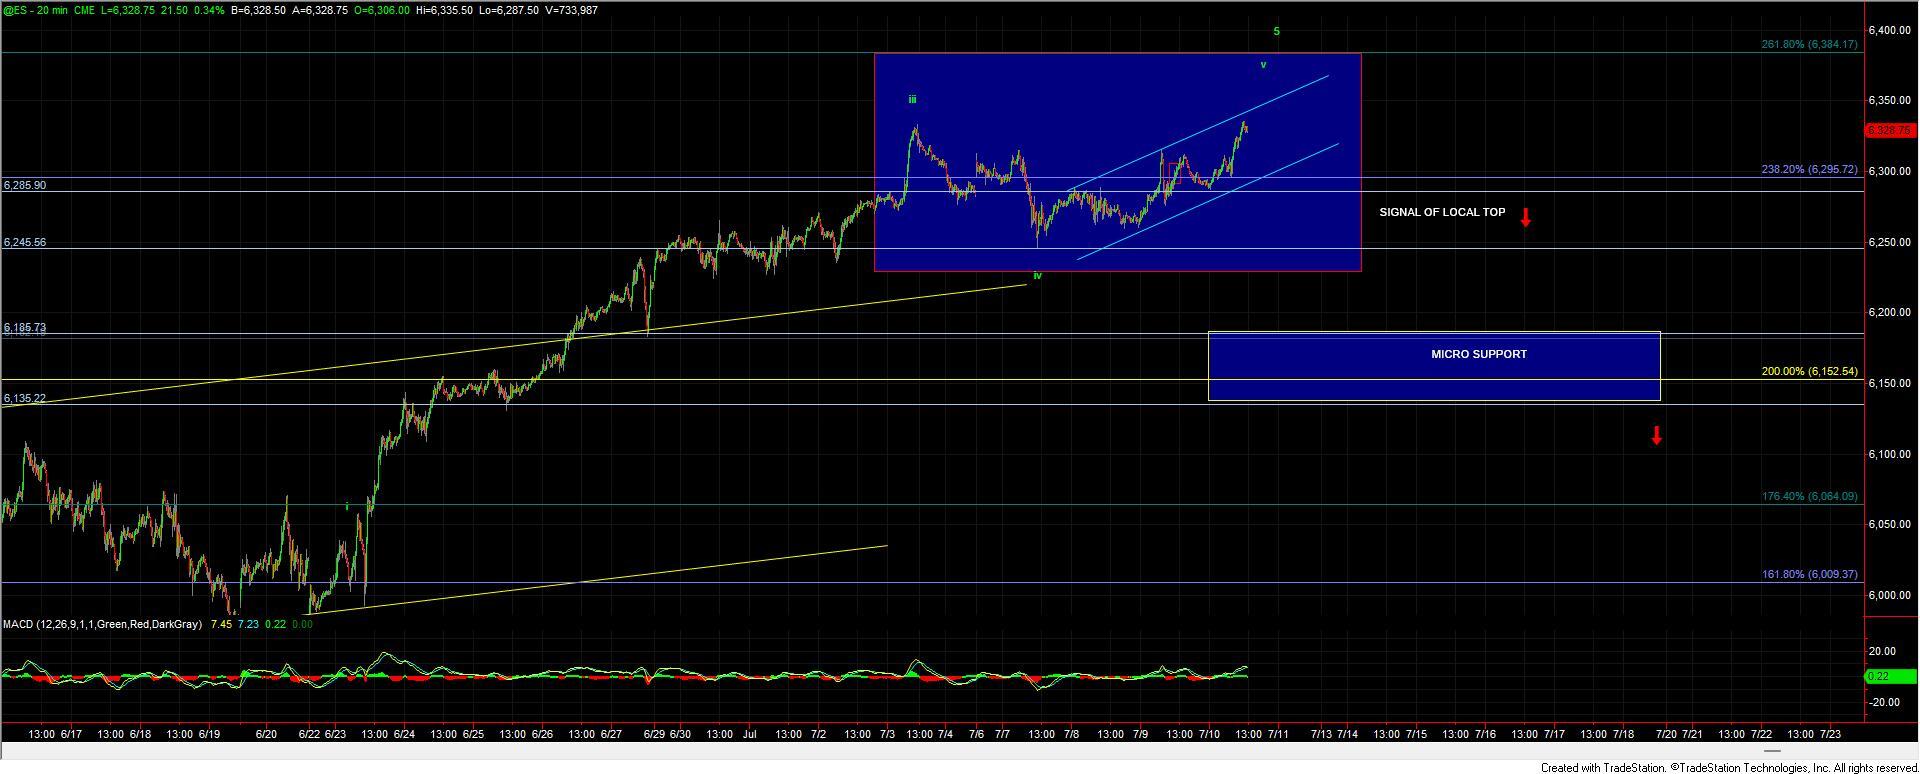
From a smaller-degree perspective, I’ll be watching the 6285 level on ES as an early signal of a potential local top. The first meaningful micro support remains in the 6185–6135 zone. A break of that area would be our initial indication that a larger degree top may be forming. Below that, upper support on the SPX comes in at the 6064–5929 zone. A move back beneath that region would offer the first real confirmation that we've likely topped in either the blue wave a or red wave b.
The structure of the next move down, if and when support breaks, will be key to distinguishing whether we're following the red or blue count paths we’ve discussed in previous updates.
Stay nimble and watch those key levels closely.