How Much Further Downside?
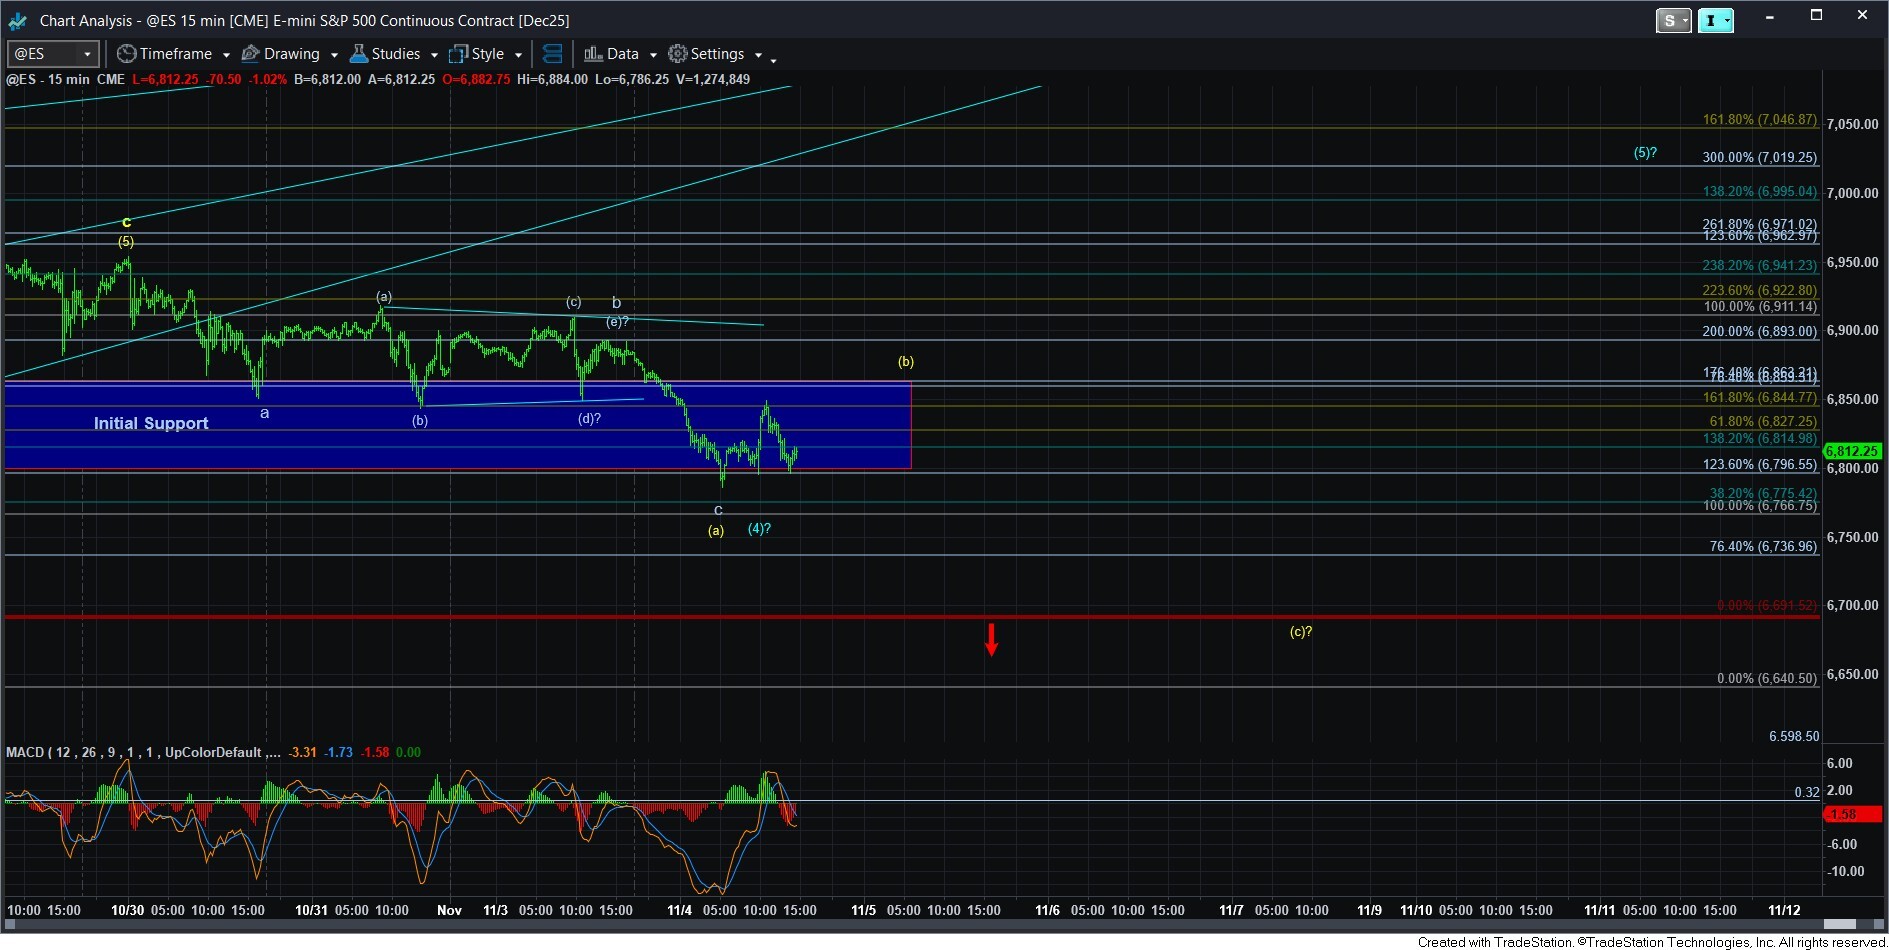
With the market remaining below the high struck yesterday, we completed the b-wave triangle, and have followed through with the downside expectation in the c-wave. The question now is if this decline is done?
At this time, I am still unsure if this current decline has the dreaded one more lower low. But, even if we do see that lower low, the bigger picture remains the same. It still centers around the lack of evidence that a top has indeed been struck. We have no strong reversal indicating a diagonal has completed, nor have we broken support. In fact, this current decline is still holding the initial support region outlined on the ES chart.
Moreover, even if we do hold this region without a lower low, we can still see a corrective (b) wave bounce as per the yellow count on the 15-minute ES chart and see another decline in a (c) wave and still hold the lower level of support in the 6691ES region.
So, without a strong reversal indicating a diagonal has completed, and without any break of support, I have added the blue wave (5) on the ES chart. In fact, we can still get the (a)(b)(c) in yellow to take shape in the coming days and that can also be the blue wave (4) with a blue wave (5) pointing to a higher high.
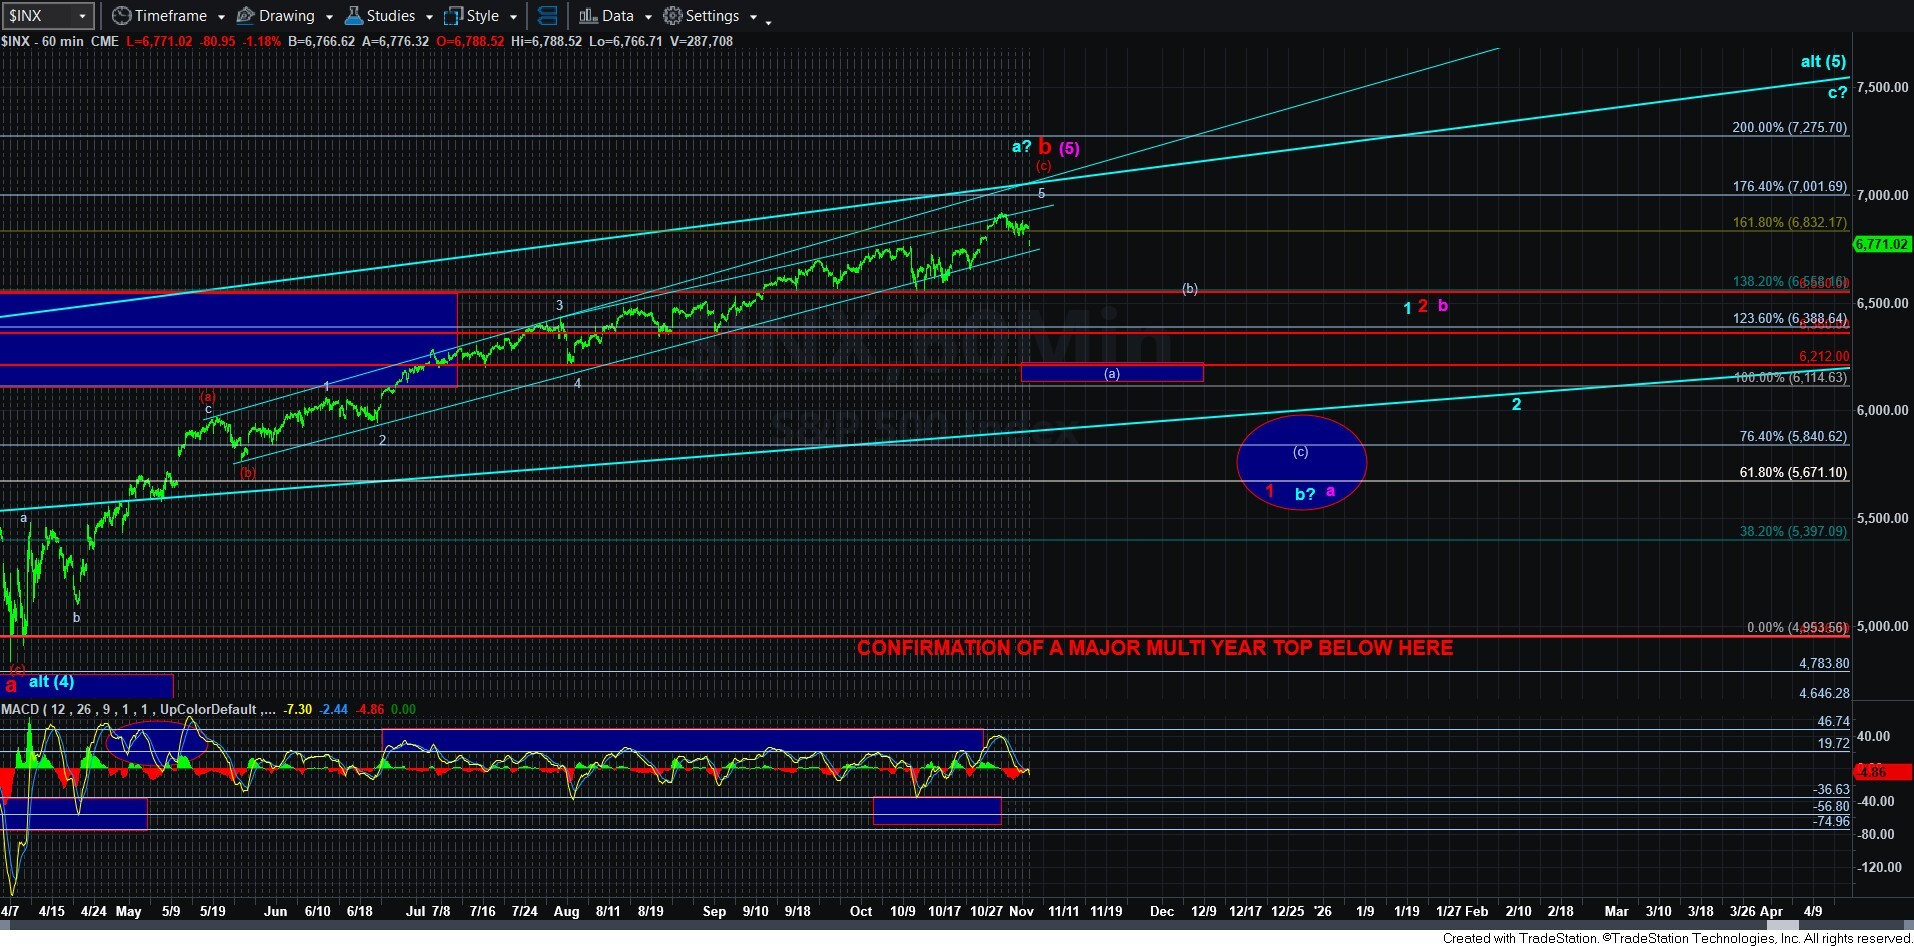
Another technical point I would like to make is that the 60-minute MACD is approaching support once again.
This still means that any major bearish expectations must remain off the table until we see some initial signals that a top has indeed been struck. Therefore, it leaves the door wide open for a rally towards that highly sought after 7000 region.