How Far Do We Drop?
Now, THAT is the most important question that we need answered over the coming days.
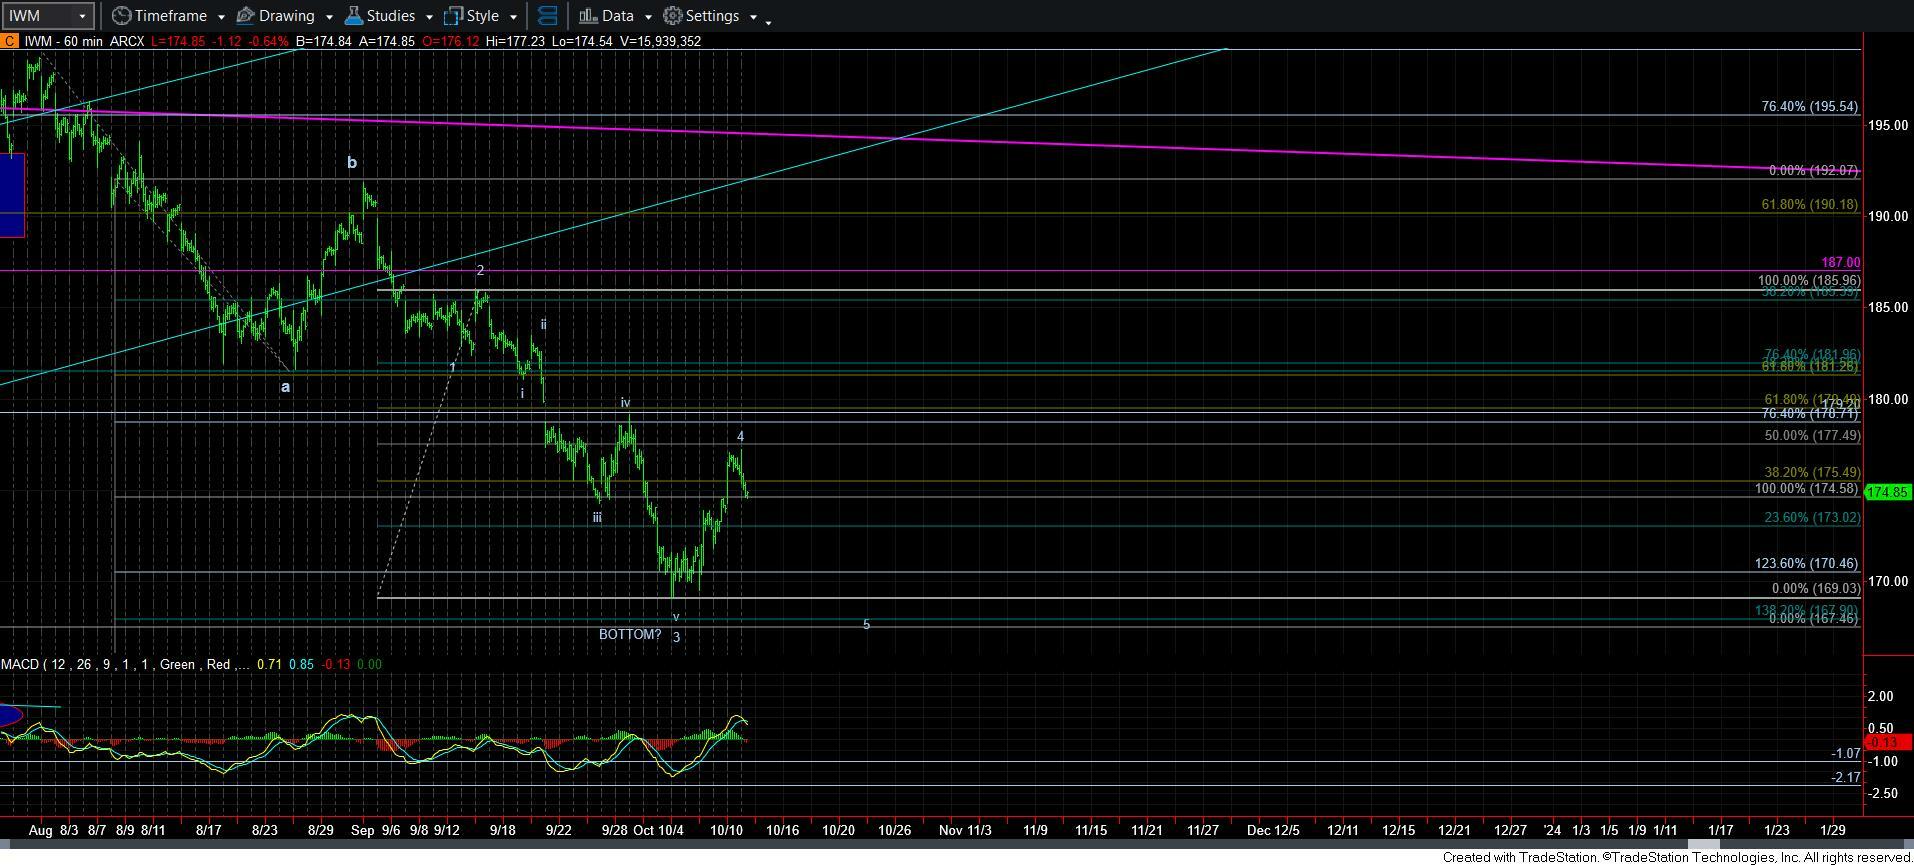
I want to again focus for a moment on the IWM chart. We have a completed a potential 4th wave rally now, assuming the market wants a lower low. Consider that the potential 4th wave rallied to just below the .500 retracement of wave 3. That is a very large retracement, as the standard is the .382 retracement of wave 3. So, when I see a retracement that deep, it often means that wave 5 will only provide a marginally lower low or even a double bottom.
As I have also mentioned before, we often see equality between waves 1 and 5. And, should we see that in this case, it points us to just over the 168 level in the IWM for a bottom in a 5th wave.
Now, should the market be able to take out today’s high and move through 177.50, then I can make out a 5-wave rally structure off the recent low, and it would likely mean that the low is in place for the IWM. So, our parameters are rather clear in IWM at this point in time.
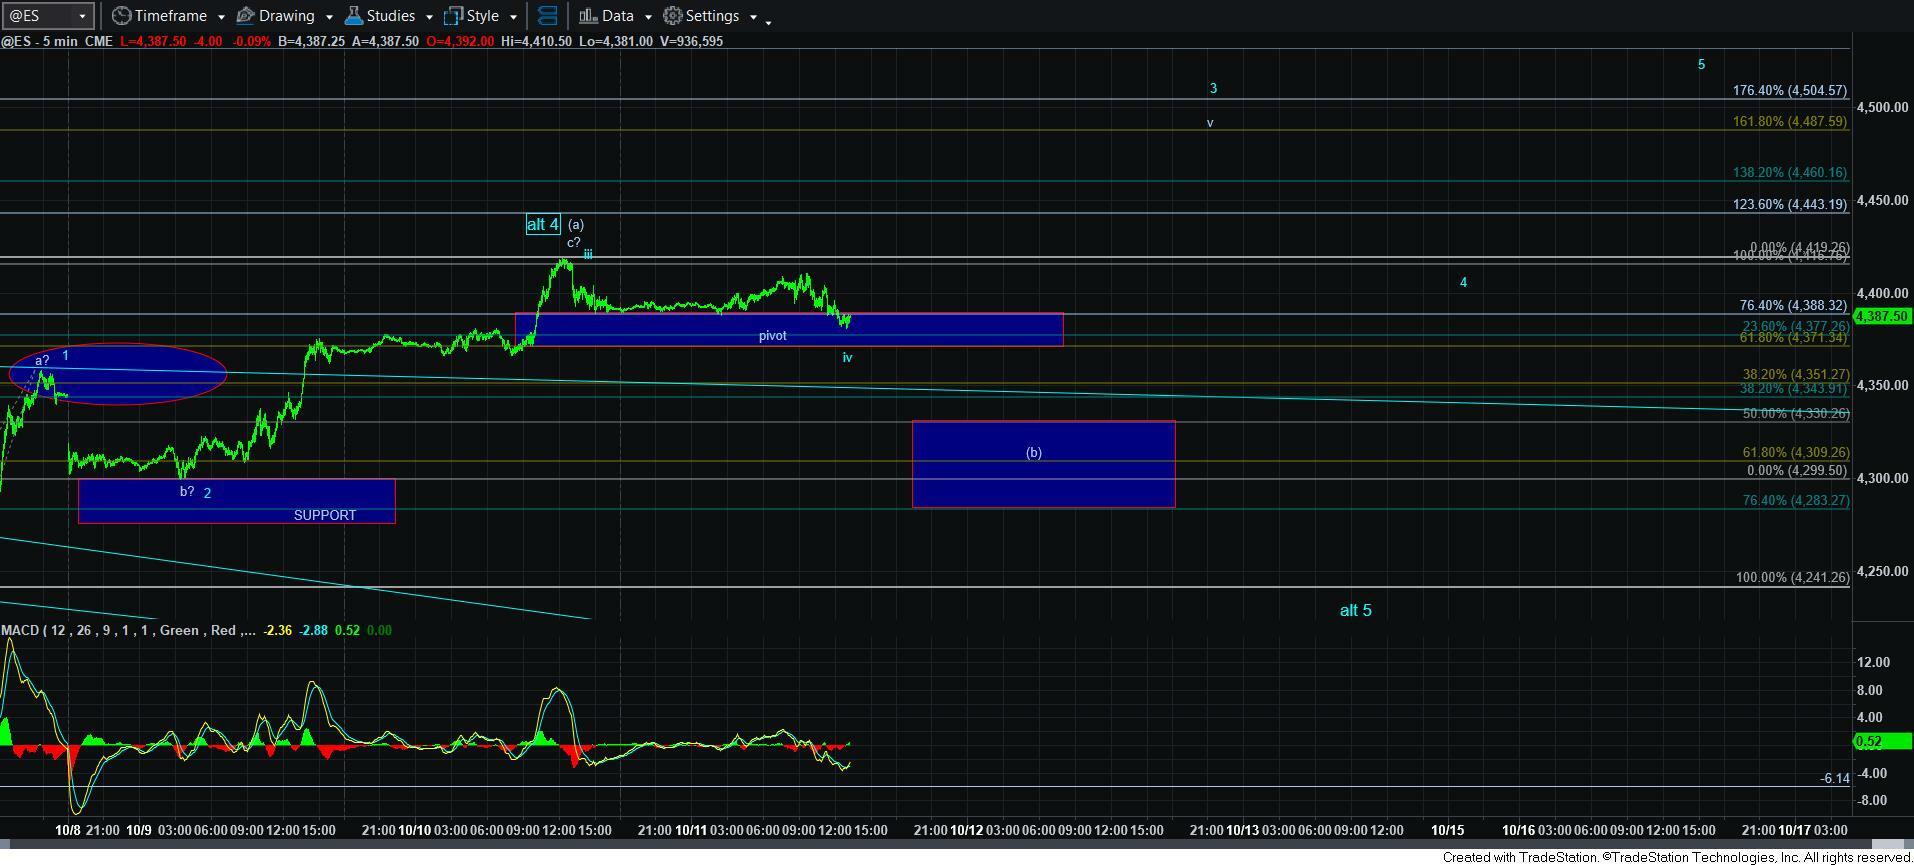
The question then turns to whether the ES/SPX will make a similar lower low. But, I don’t think the likelihood of that occurring is quite as high as it would be in IWM. Therefore, it leaves me with 3 smaller degree paths to track in the ES/SPX.
As you can see on the attached ES chart, I have a pivot noted on the chart. And, if the market is able to hold this pivot, and then rally over today’s high, then we will likely test the all important 4401SPX region off that pivot support. And, that then opens the door for a possible 5-wave rally off the recent lows, which is outlined on the 5 minute ES and SPX charts with the respective waves 3, 4 and 5 noted at higher levels.
But, should that pivot break, then there are two paths that will be left. And, much will depend on how extended the move down begins to develop. If we see strength relative to the IWM, then we may just be seeing a [b] wave pullback in ES/SPX. And, allow me to take a moment to explain why I am considering this potential.
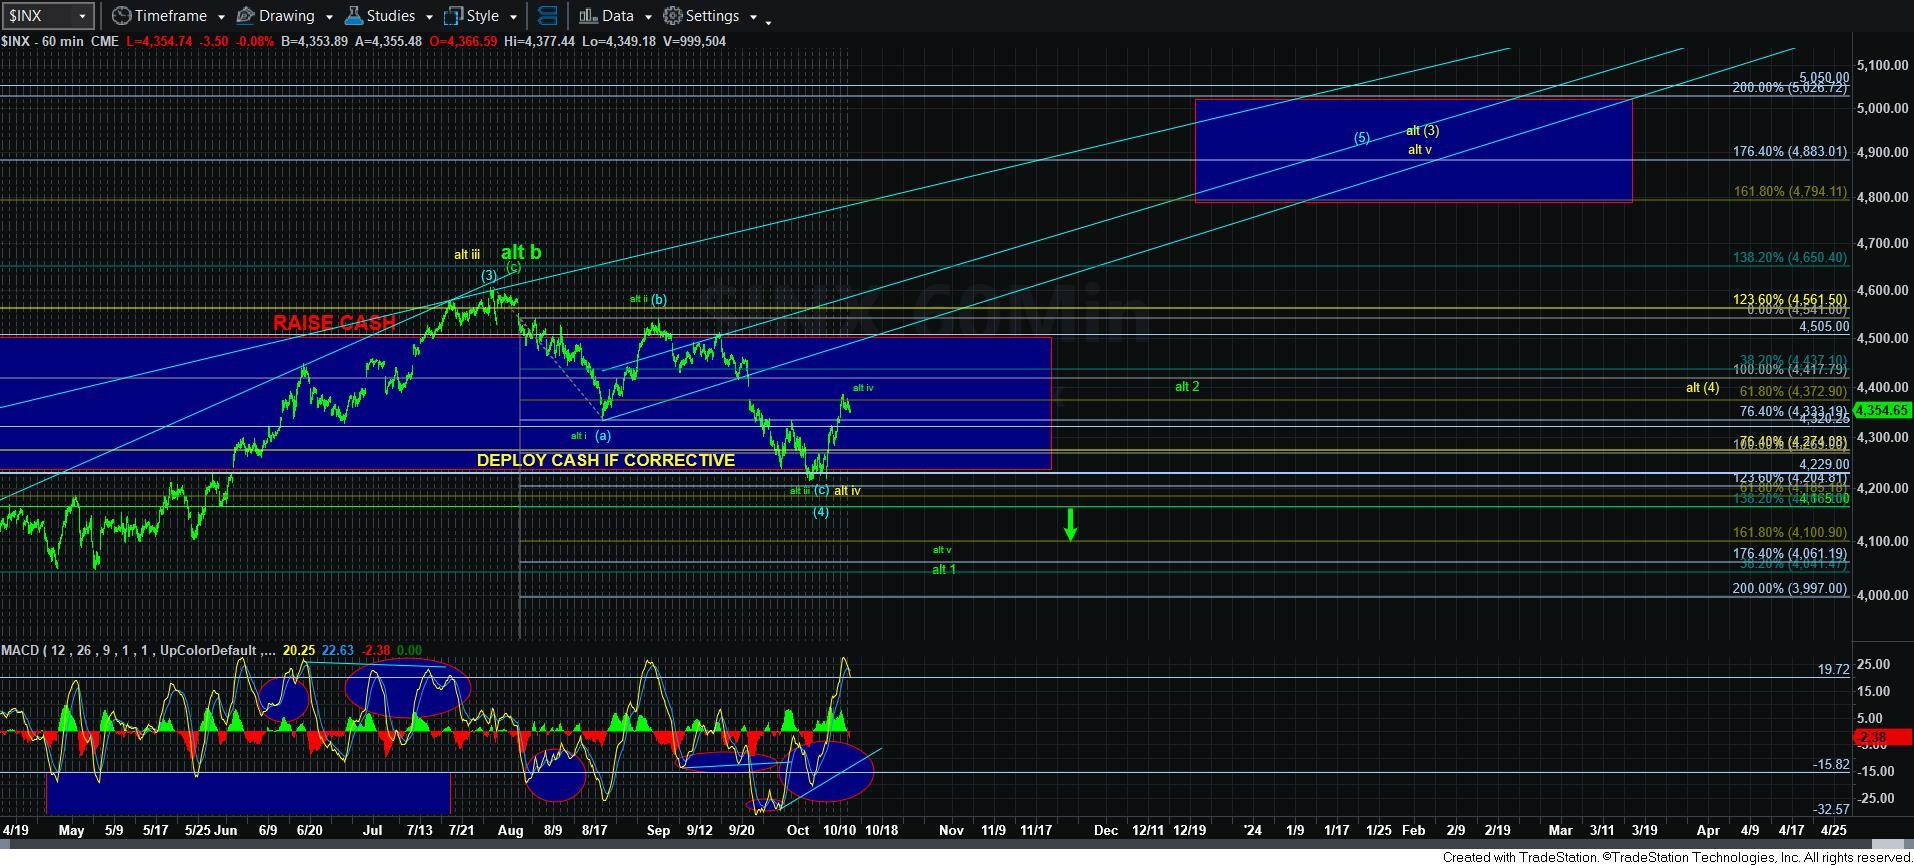
The rally off the October 2022 low has been quite overlapping and can count well as rallying in 3-wave structures. Therefore, I have to strongly consider that the rally to the 4800SPX region may be also taking shape as a 3-wave structure. That is why I am tracking a potential (b) wave pullback.
And, of course, the other potential is a lower low for the blue count, which would align with the potential structure in the IWM.
Unfortunately, when the market tracks in 3-wave structures, it makes the analysis of a bottom being in place much more difficult until you actually break out over resistance. You see, a 3-wave rally for an a-wave in rally structure looks no different than a 3-wave corrective structure. And, this causes the additional difficulty about making a firm call about a bottom being in place. Moreover, the potential that IWM has for a 5th wave lower low adds to that question.
So, at this time, I am still being cautious until the market is able to take out resistance and tell us that a low is likely in place. We have our resistance points noted clearly in IWM and SPX.
Lastly, I am going to reiterate that I still do not see the green count as a strong likelihood, especially relative to the potential of first going to 4800SPX. Yet, I need to know where I am going to be wrong in my assessment, as I have clearly stated many times, a sustained break down below 4165SPX will tell me that we will have to shift gears over the coming months.