How Does Wave 4 End?
With today’s move directly lower, I have now taken off the yellow alt b-wave from all the charts since we have more than a simple 3-wave decline off the recent high. The potential for that yellow path to develop has now dropped to a low enough level of probability for me to take it off the chart.
This leaves us with two main paths as to how the SPX can complete wave 4.
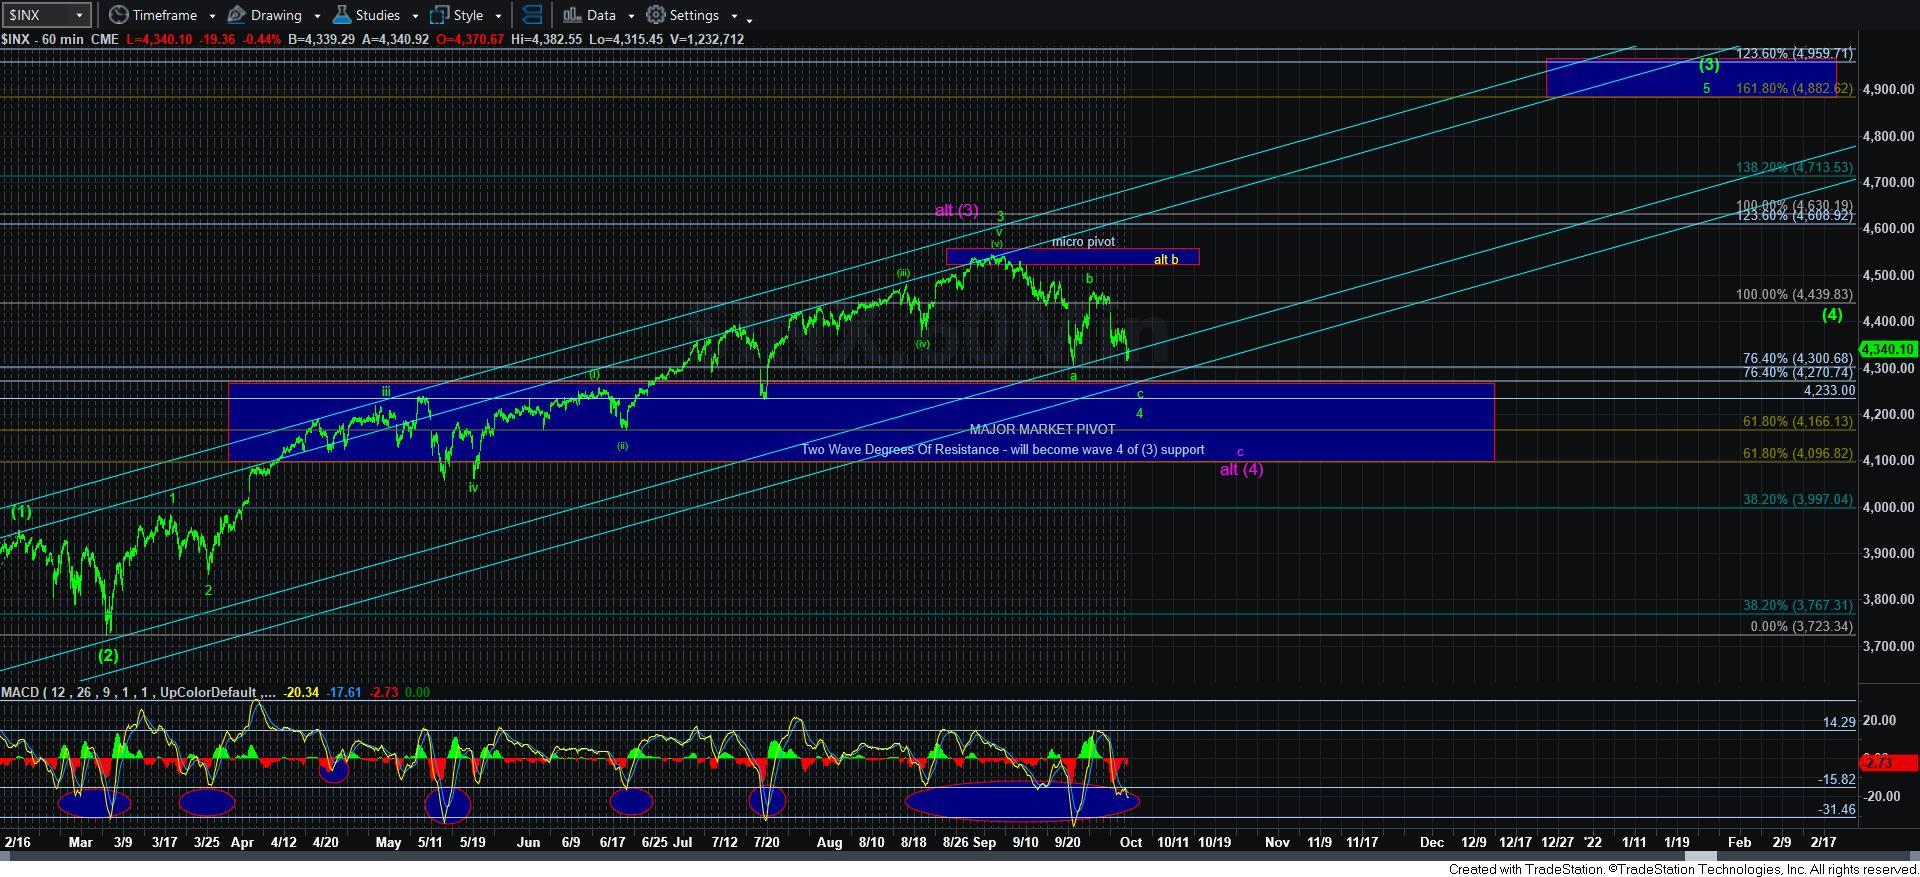
One path has been outlined by Garrett while I was out during the religious holiday earlier this week. This structure would take shape as an ending diagonal for the c-wave of 4, and can target the 4165SPX lower support region for wave 4, which is the .618 extension of waves [1][2] and a typical target for wave 4 of [3] (and is shown on the 60-minute SPX chart). We have discussed many times how the typical retracement for wave 4 of [3] is the .618-.764 extension of waves [1][2], which in our case is the 4165-4270SPX region.
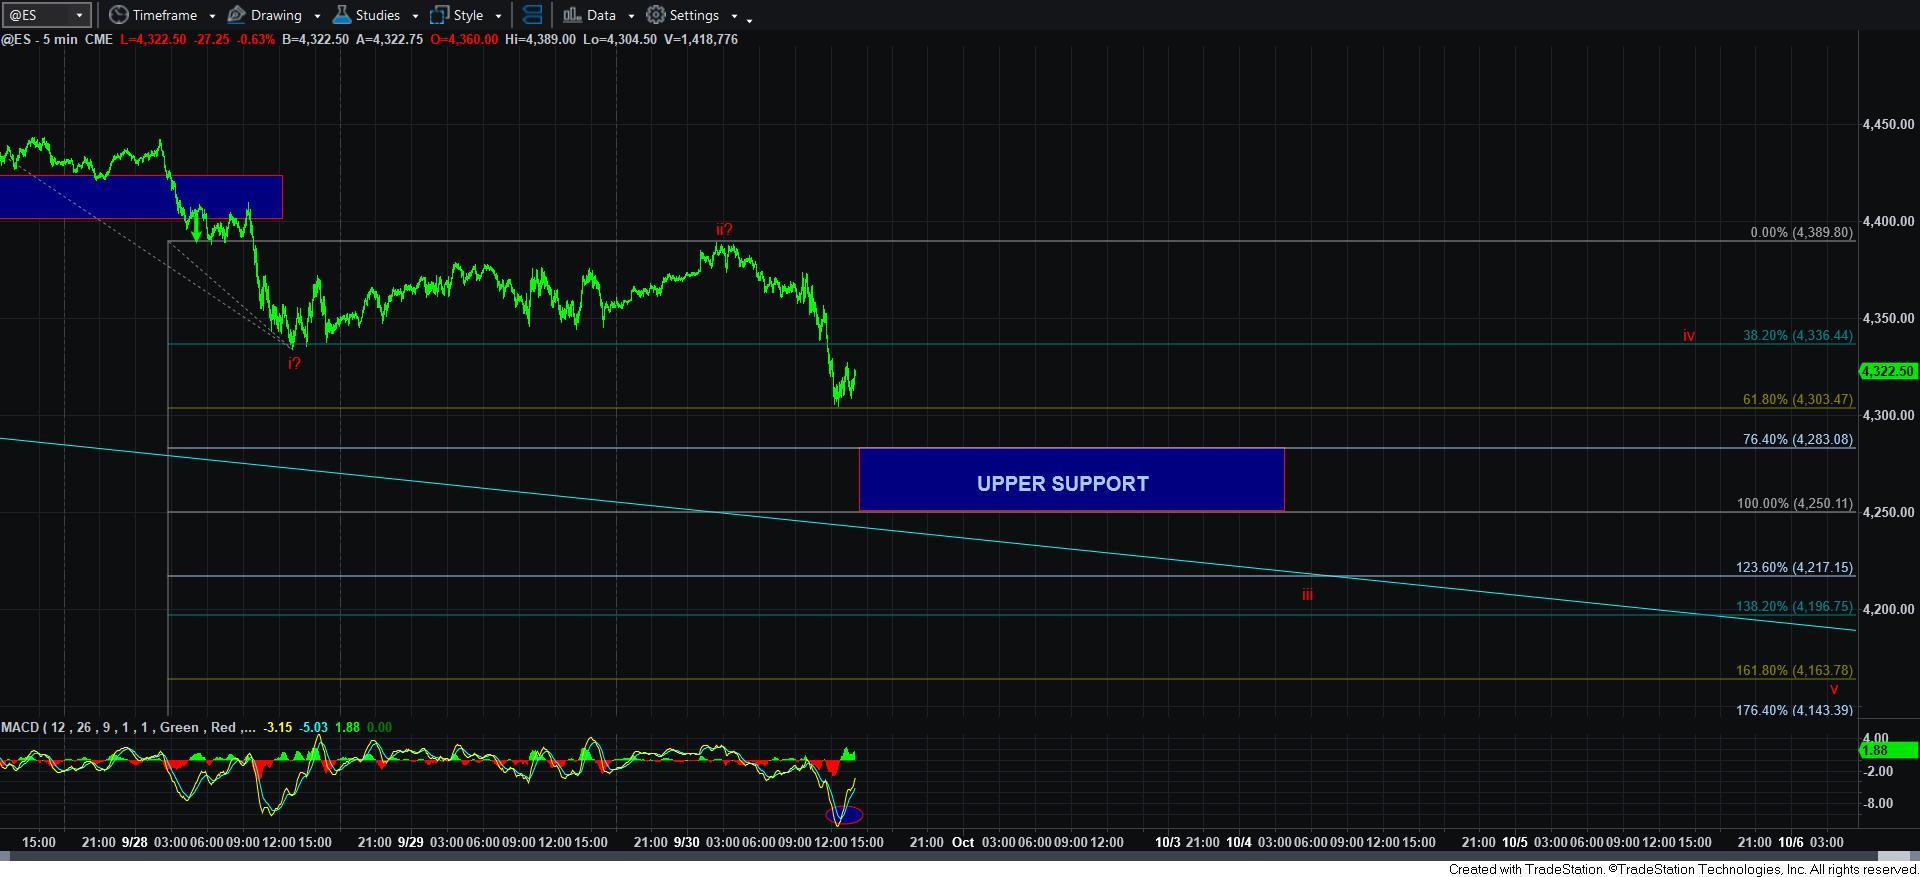
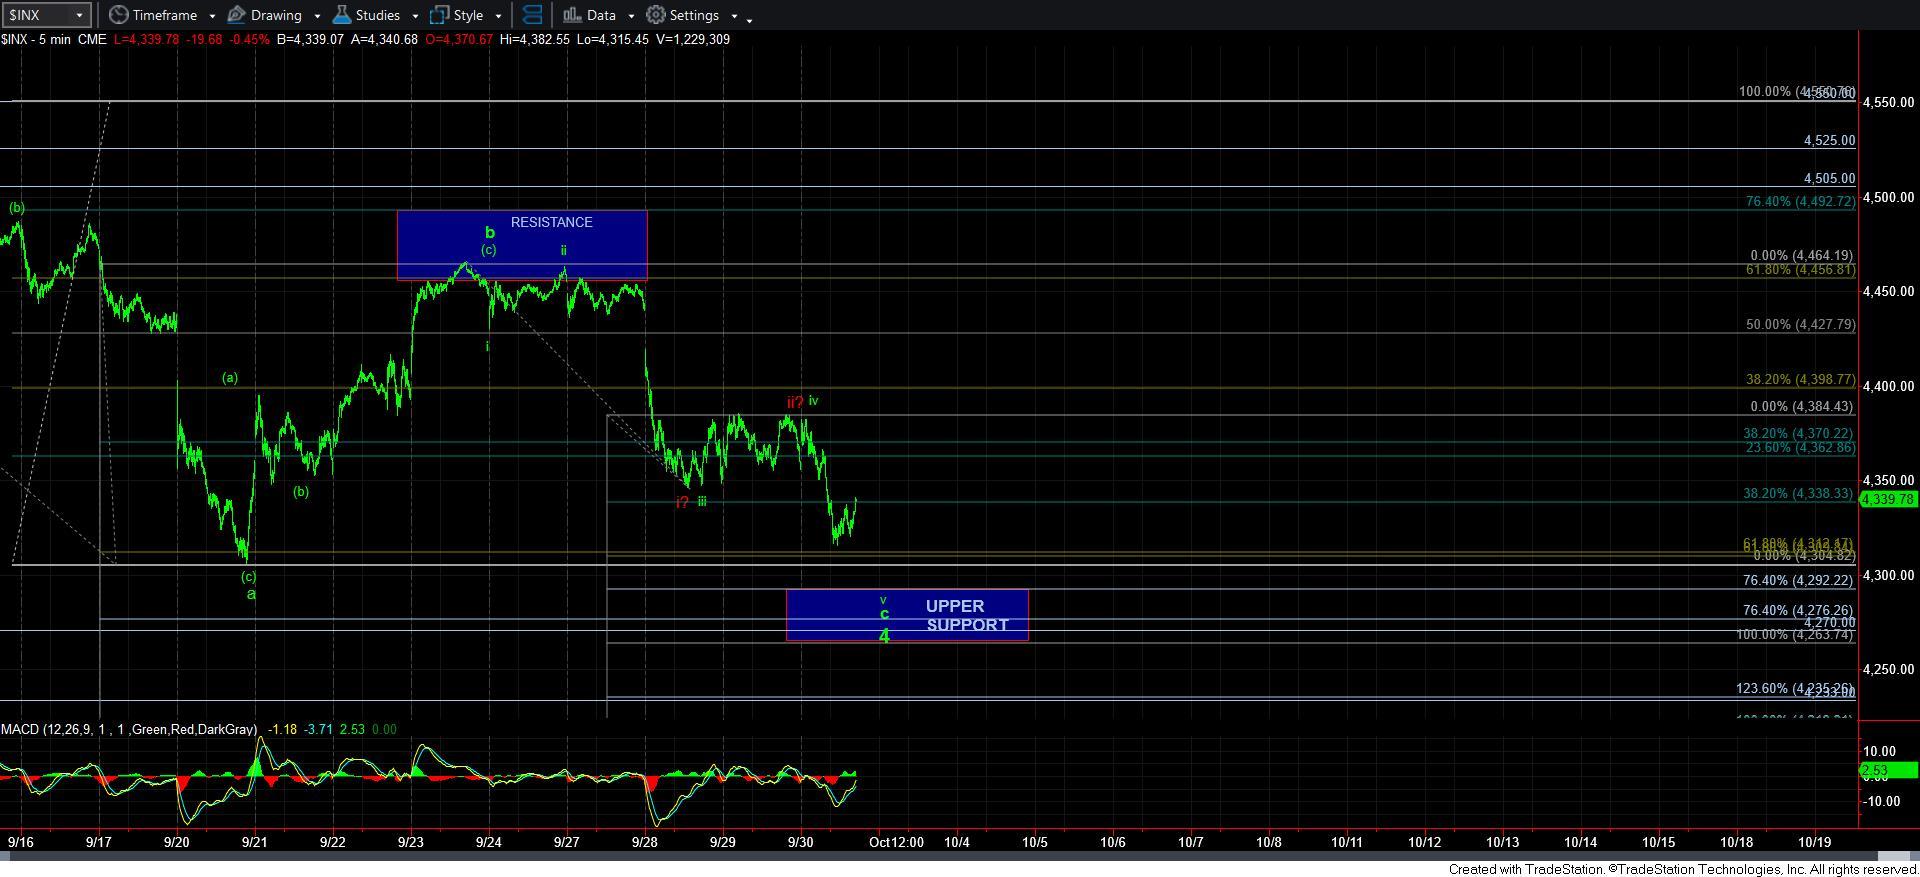
However, we will need to break down below the upper support region on the 5-minute charts to suggest this bigger c-wave decline is in progress within the ending diagonal pattern. After doing a bit of work on various calculations, I have modified this support to the 4260-90SPX region. This support region also takes into account the potential that the 4th wave takes shape as a w-x-y pattern, wherein the w=y. So, it is entirely feasible for this 4th wave to complete as early as tomorrow within that support region. That is the count presented in green. And, an impulsive rally off that support through the 4400SPX region will signal that the market has begun the wave 5 rally to the 4900+ region.
In the meantime, I have added the deeper ending diagonal path to the ES chart. Keep in mind that wave iv is quite high since we most often see overlap with wave i down within an ending diagonal pattern. Furthermore, I have added waves i-v in representative fashion, and it does not suggest that is the timing that I expect. In fact, this ending diagonal could take as much as several weeks to complete.
Lastly, there is still some potential that we are bottoming right now in a bigger wave 1 of c-wave down. But, we will need to break back over today's high for me to place that on the chart as an alternative. That alternative would also likely target the 4100-4165SPX region for wave 4.
So, in summary, I am trying to distill several potential paths for the market in as simple a manner as I possibly can. The market has support in the 4260-90SPX region. If the market should find a bottom over the coming days within that region, and then provide us with a clearly impulsive 5-wave rally through 4400SPX, then we have our initial signal that wave 4 is done, and wave 5 has begun.
However, if the market breaks that support, then we will likely target wave iii in the ending diagonal in the 4210/20ES region, followed by a large wave iv bounce back over 4300, and then completing the ending diagonal pattern down in the 4165SPX region in the coming weeks.
For those with bigger time frame perspectives, please focus on the 60-minute chart, as we are approaching the MAJOR MARKET PIVOT, which provides us with major support for this bull market run. As long as that support holds, this market is next going to embark on a rally to the 4900+ region. Those are the two regions with which you make your risk/reward assessments for this bull market.