How Do We Get To 3000 SPX?
As the market began its wave (4) correction earlier this year, we have had to deal with a wave (4) which did not provide a clear ending point, as well as an overlapping structure off that wave (4). And, as I have said so many times, all the overlapping structures have clouded the path as to how we will get to the 3000+ region. That is why several of our analysts at Elliottwavetrader.net have presented various reasonable interpretations to how we get to 3000+.
While I have attempted to provide the cleanest and most likely wave count based upon how this structure fits in with the bigger overall structures, the market is testing that wave count with this extended push higher. Should we now break through that resistance, it will certainly open the door to other interpretations as to how we go to 3000+. But, for now, I am not going to add those counts, despite the fact I have been tracking 3 other potential counts to 3000+. I would rather keep it simple for now.
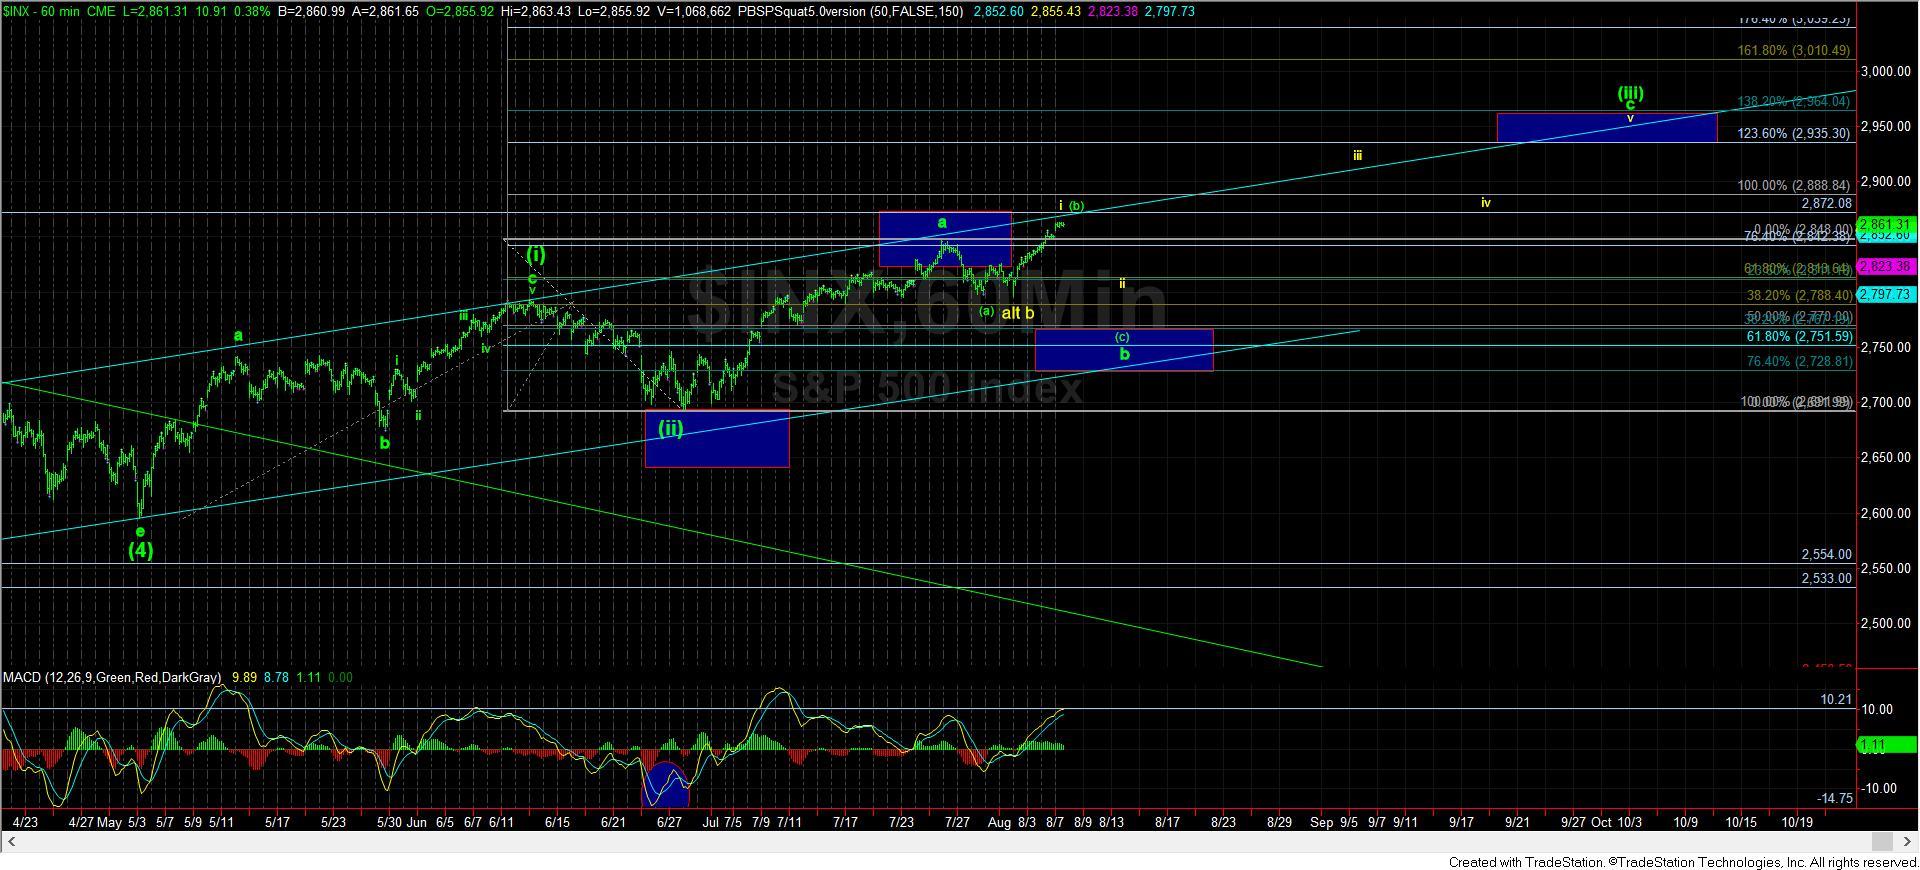
The best wave count that I have would still consider this rally as concluding a (b) wave within a b-wave of wave (iii) in the SPX. However, we are approaching the upper trend channel along with the prior all-time high in the SPX. And, as long as we hold within this region, I can still maintain a reasonable expectation for a (c) wave drop to complete the b-wave of wave (iii).
But, as we all know, surprises in bull markets (and, yes, we have staunchly proclaimed that this bull market has not yet concluded) will come to the upside. For this reason, I have continually reiterated that most of our members should not be attempting to short for lower levels, but, rather, should be planning their buying on the pullbacks.
The alternative count I am now forced to consider is that the b-wave ended at least week’s pullback low, as presented in yellow. But, for all the reasons I highlighted over the last week, I really have a hard time adopting any count that calls that low the bottom of the pullback unless I am forced to do so. But, even in the alternative count in yellow, it would suggest that we still see a corrective pullback down towards the 2810-2830 region for yellow wave ii.
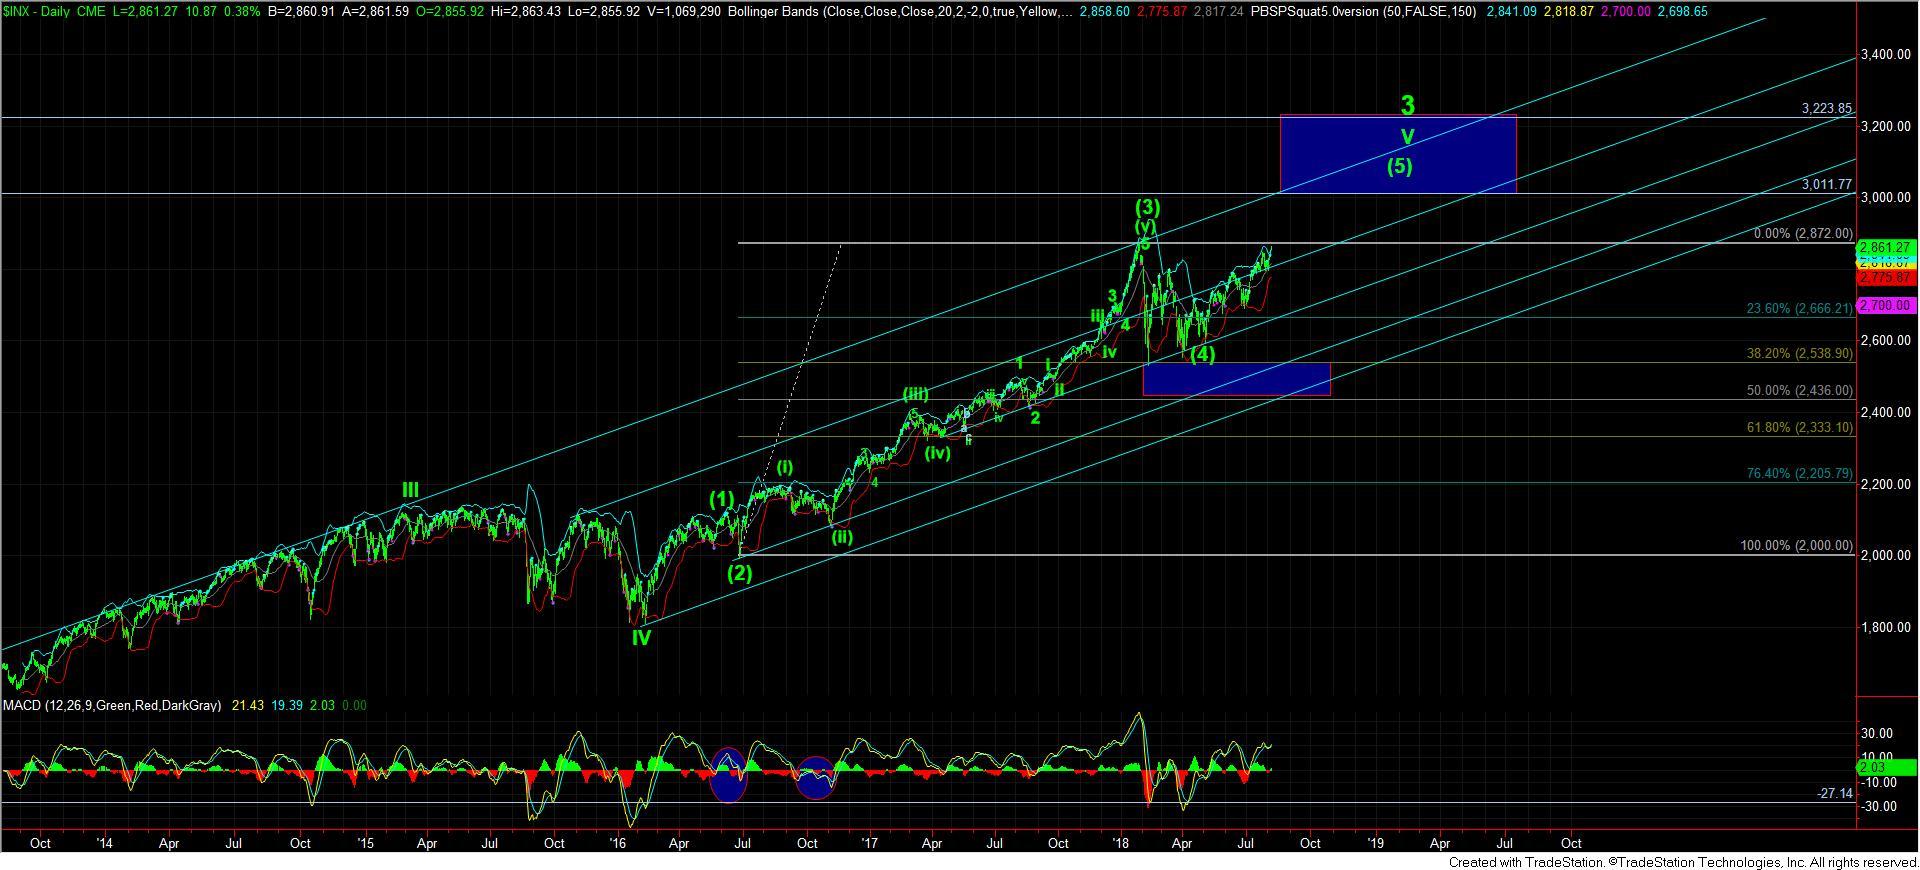
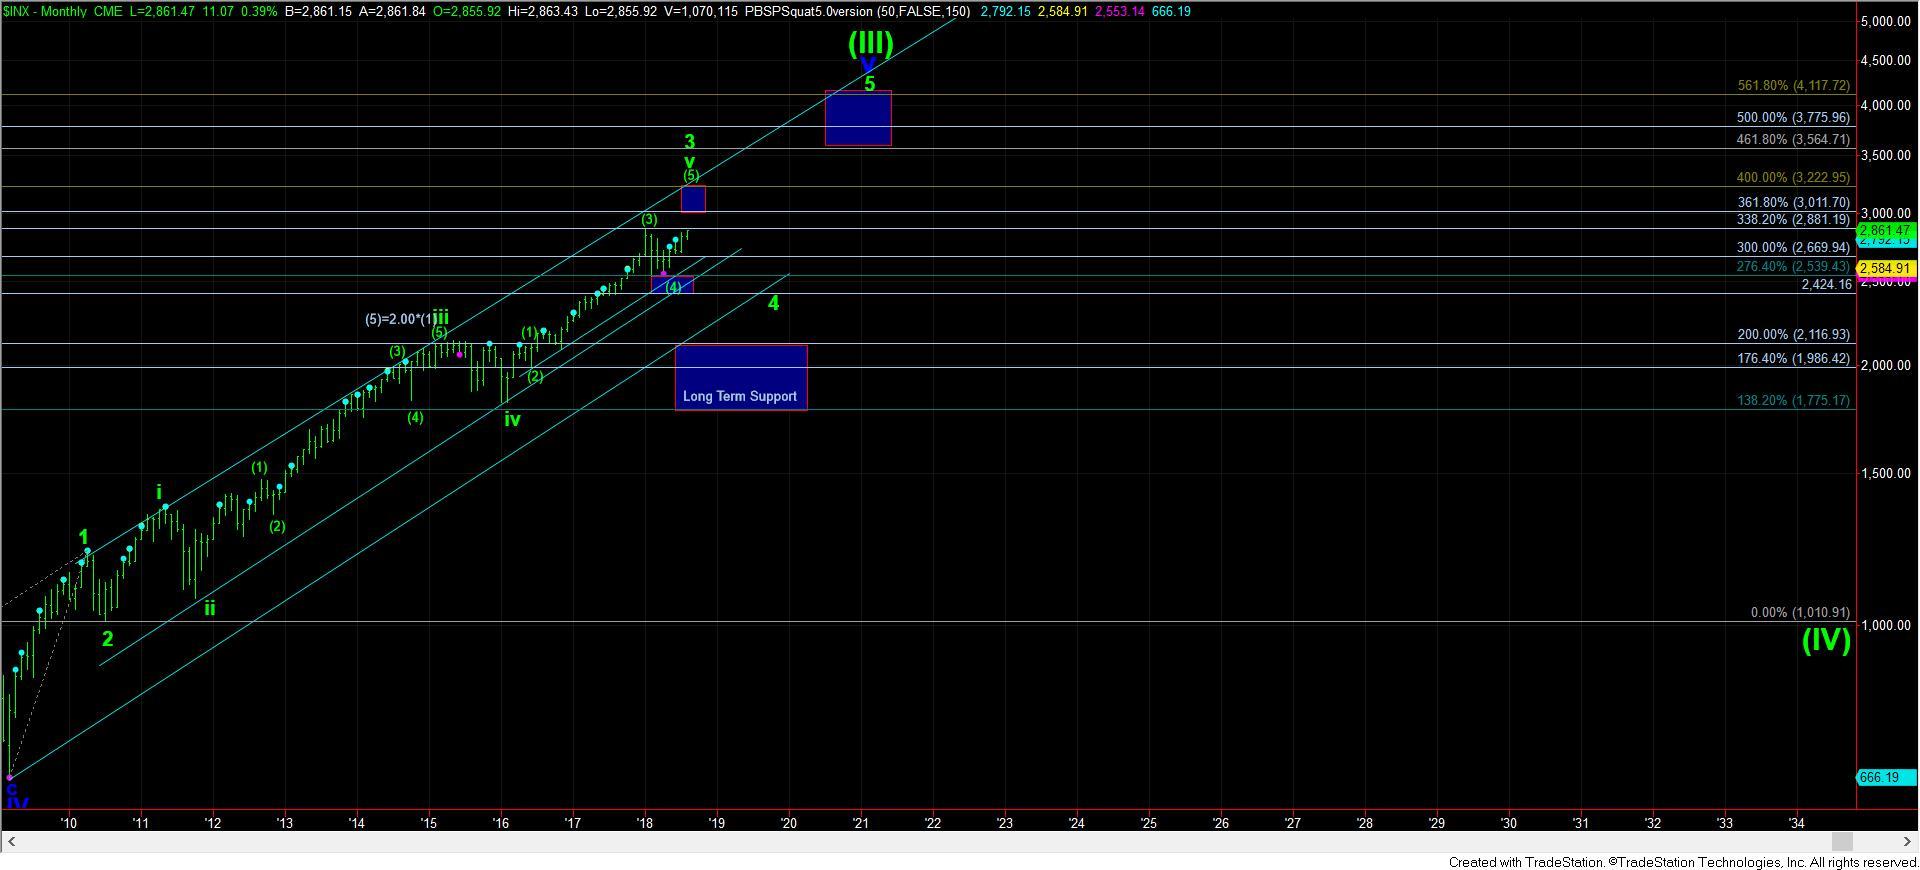
From the bigger time frames, our larger perspective has truly prognosticated this market quite well for years, and has kept us on the right side of the market despite many others in the market looking for the market crash at almost every twist and turn. Our larger pattern kept us strongly bullish in early 2016, strongly bullish into the elections, and strongly bullish after the drop earlier this year. And, we still expect to see 3000+ before the 20-30% correction we expect takes hold in 2019.
However, since we entered wave (4), and then continued into wave (5), the overlap has continued to cloud the path with which we will attain 3000+. And, even though we are still months into wave (5), the pattern has still remained somewhat cloudy, and allows for several possibilities. For now, I am going to maintain my primary perspective, and look for a (c) wave lower. But, if the next pullback is only corrective in nature, and we then break out over the high we develop in the next few days, then I will be forced to adopt the alternative count in yellow.
Lastly, should we see a more direct break out from here, then I will be forced to discuss the other wave counts I have been tracking but have not placed on the chart just yet. Again, the counts I have on the 60-minute chart are still the most likely in my humble opinion. But, I will be quick to change that perspective should we see a more direct break out. For now, that is not my expectation. Yet, my larger expectation also remains the same, and that is that the market is going to attack the 3000+ region before we begin the 20-30% correction we expect in 2019.