How Did We Get Into This Mess?
Since I will not likely have access to my charts this weekend, Mike will be writing the weekend update. But, I still wanted to post a note before the weekend for all our members, while Mike will write the more detailed wave count update in the weekend update.
As I have explained many times before, as we were expecting the market to top out and begin a 4th wave pullback in the first quarter of 2022, the market topped out 60 points shy of the target we set for the rally from the 4270SPX region. My minimum target region for this 4th wave pullback was the 4440SPX region, which I outline for you well before this pullback began, and was the reason I suggested members to raise cash near the highs.
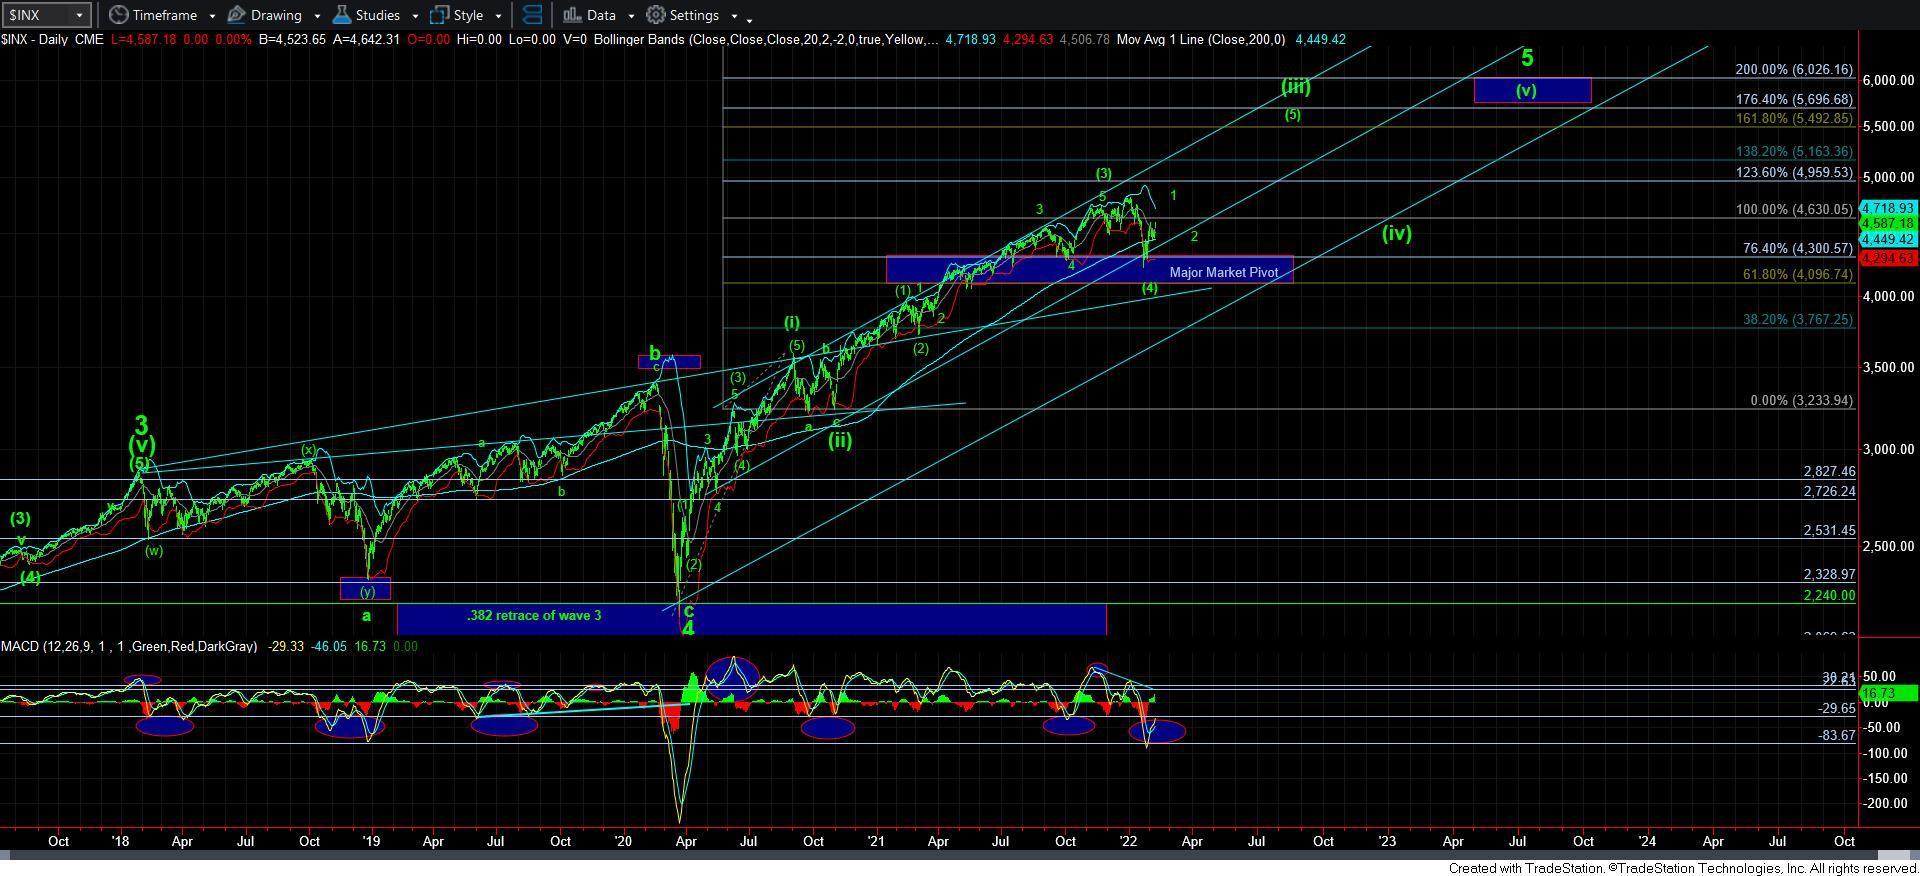
But, when we zoom out to focus upon the larger degree Fibonacci Pinball structure off the March 2020 lows presented on the daily chart, we have a few factors to consider.
Wave [3] of [iii] will usually target the 1.00-1.236 extensions of waves [i] and [ii] off the March 2020 low, and that is where the market topped at the end of last year. We also know that wave [4] of [iii] will usually revisit the .618-.764 extension region of waves [i] and [ii], which is what I have defined as our Major Market Pivot. Thus far, the market has held that pivot on this pullback.
But, these are the issues the market has presented us with which has not allowed greater clarity off the recent lows.
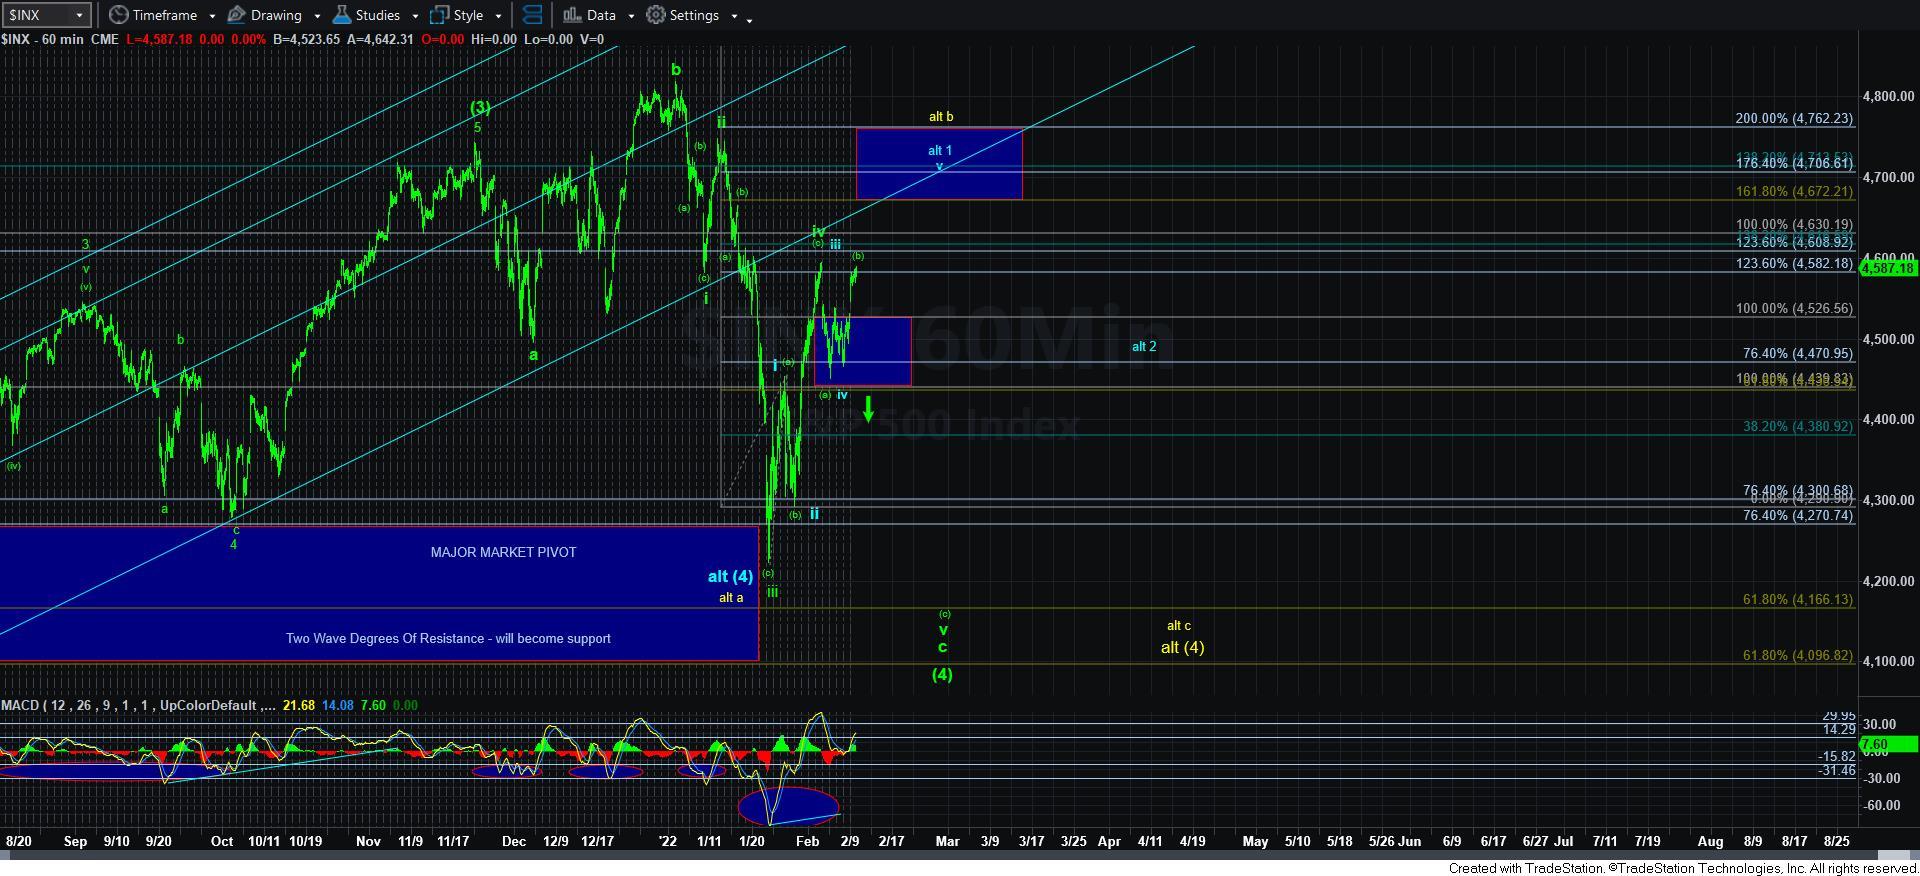
First, when we get a c-wave decline, that c-wave takes shape as a clear 5-wave structure the great majority of the time. In this instance, we really only completed 3-waves down into our recent low. This would provide us with a more unorthodox w-x-y structure, which is a less common bottoming structure. Now, even though I did say it is “normally” a less common structure, I have been noting that each pullback we have seen since the March 2020 low has completed with such an unorthodox structure. So, is this one going to present the same way? This has been one of the issues with which we have been dealing.
Second, to add to the complication, when a wave [4] completes, the market then rallies off the low in a clear 5-wave structure to signal that the next bullish phase has begun. In our instance, the rally off the lows has counted best as an overlapping structure, which is not striking standard Fibonacci Pinball ratios off those lows. This most often suggests that the rally is corrective in nature, and for these two reasons, we have been presenting the corrective counts as our primary view.
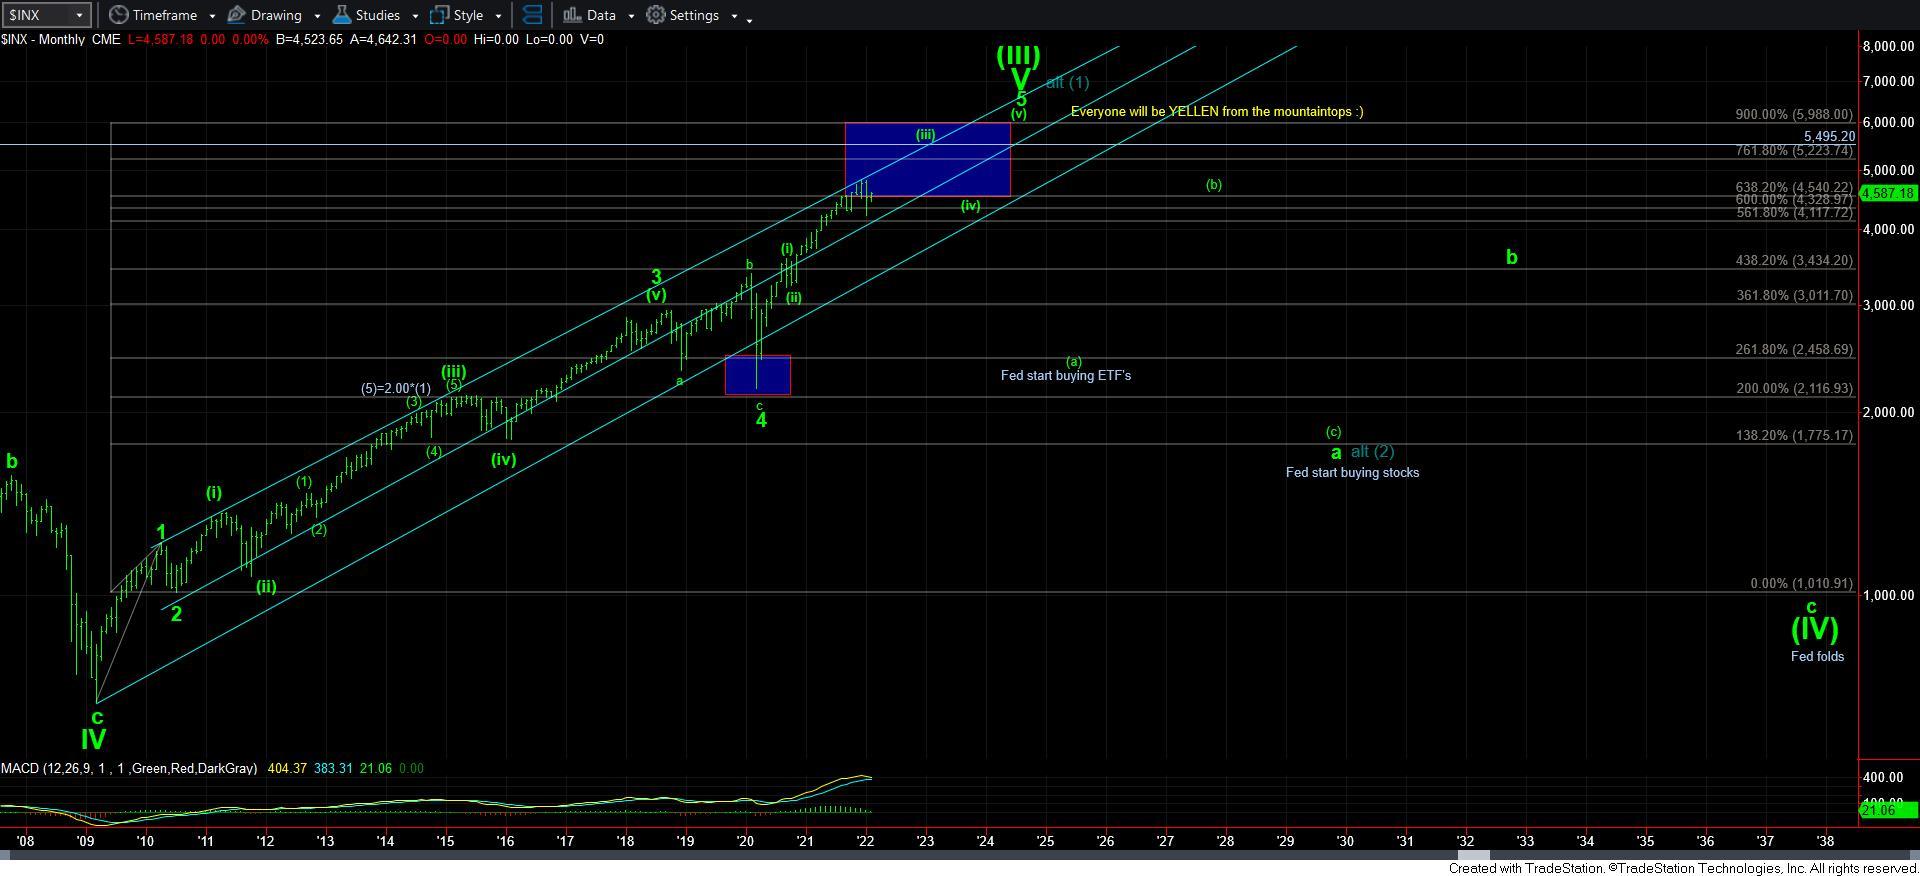
Should the market provide us with a higher high in the coming days, then there is potential that the low has indeed been struck at the recent lows, and this rally is taking shape as a leading diagonal for wave 1 of [5] of [iii]. Again, this is not the most ideal count for the two reasons cited above, nor is it normally a highly reliable structure. But, I think we would have to make the bullish count our primary count at the time since we are still in a bull market with our next ideal target in the 5500SPX region, as I have said many times, and surprises usually come to the upside in bull markets.
If we get a higher high, what would change my mind with regard to the more immediate bullish count?
Well, once we do complete wave 1 of [5] of [iii], then I can calculate a wave 2 pullback level which would project us up towards the 5500SPX region. However, if that level does not hold as support on the next pullback AND the break down below that level counts as a clear 5-wave structure, then I will likely be forced to adopt the bigger a-b-c structure presented in yellow on the 60-minute chart and look for at least a re-test of the recent lows back towards the bottom of our Major Market Pivot.
Now, for those that have been following my work closely, you would know that my normal trading/investing plan has me buying my first tranche of longs once the market is completing what I believe to be the wave iii of the c-wave. I do this to begin to layer into a bottoming structure that I believe we are creating, as it is not always certain that we will be seeing that 5th wave lower low. Therefore, I noted in our trading room that I was deploying some of the money I raised near the market highs as we were striking the lows in the 4222SPX region.
I usually leave the remaining amount of cash that I raised to buy the 5th wave lower low. But, when we do not get that 5th wave lower low, I will usually deploy the rest of that cash in one or two additional tranches. Either I will deploy the remaining cash at the wave 2 pullback, or I will split it between the wave 2 pullback and the wave ii of 3 pullback after we complete wave i of wave 3. I do the latter layering in when the initial 5-wave structure off the low is unclear. So, that will likely be my course of action in this case if we see a higher high. The reason I do so is to still leave some cash available for the potential of a lower low when there still remains questions about the structure.
I think this is also a good time for everyone to recognize just how sentiment works, and why having a plan laid out well before you need to effectuate it is so important. At the lows, when I normally begin layering into long positions, many were questioning me as to how wise that really is as it “looked” to many that the market was certainly heading much lower. In fact, many were telling me that were going to see the 3000’s in the market again, at which I chuckled.
And, now, many are beginning to fear they missed their opportunity to go long. But, the market will usually provide you with several opportunities to prepare for the rally we expect to the 5500SPX region. So, making a plan and maintaining that plan is quite crucial to success in buying low and selling high, especially when your emotions would be driving you to do the exact opposite. That is why we use our Fibonacci Pinball method of Elliott Wave analysis to provide us market context to allow us to create those plans.
At the end of the day, I wish the market gave us a much clearer wave structure upon which we can rely to be more certain that wave [4] was over and that wave [5] has indeed begun so that we can more confidently deploy the cash we raised near the highs. Unfortunately, that is not what we have been provided. But, I wanted you to at least understand the reasons this region has been providing us the uncertainty with which we have been outlining since the low has indeed been struck, and my plans going forward.