How Bullish Is This Market?
As I noted earlier today, this market is doing a masterful job of still hiding its near-term intentions. And, it leaves me quite torn.
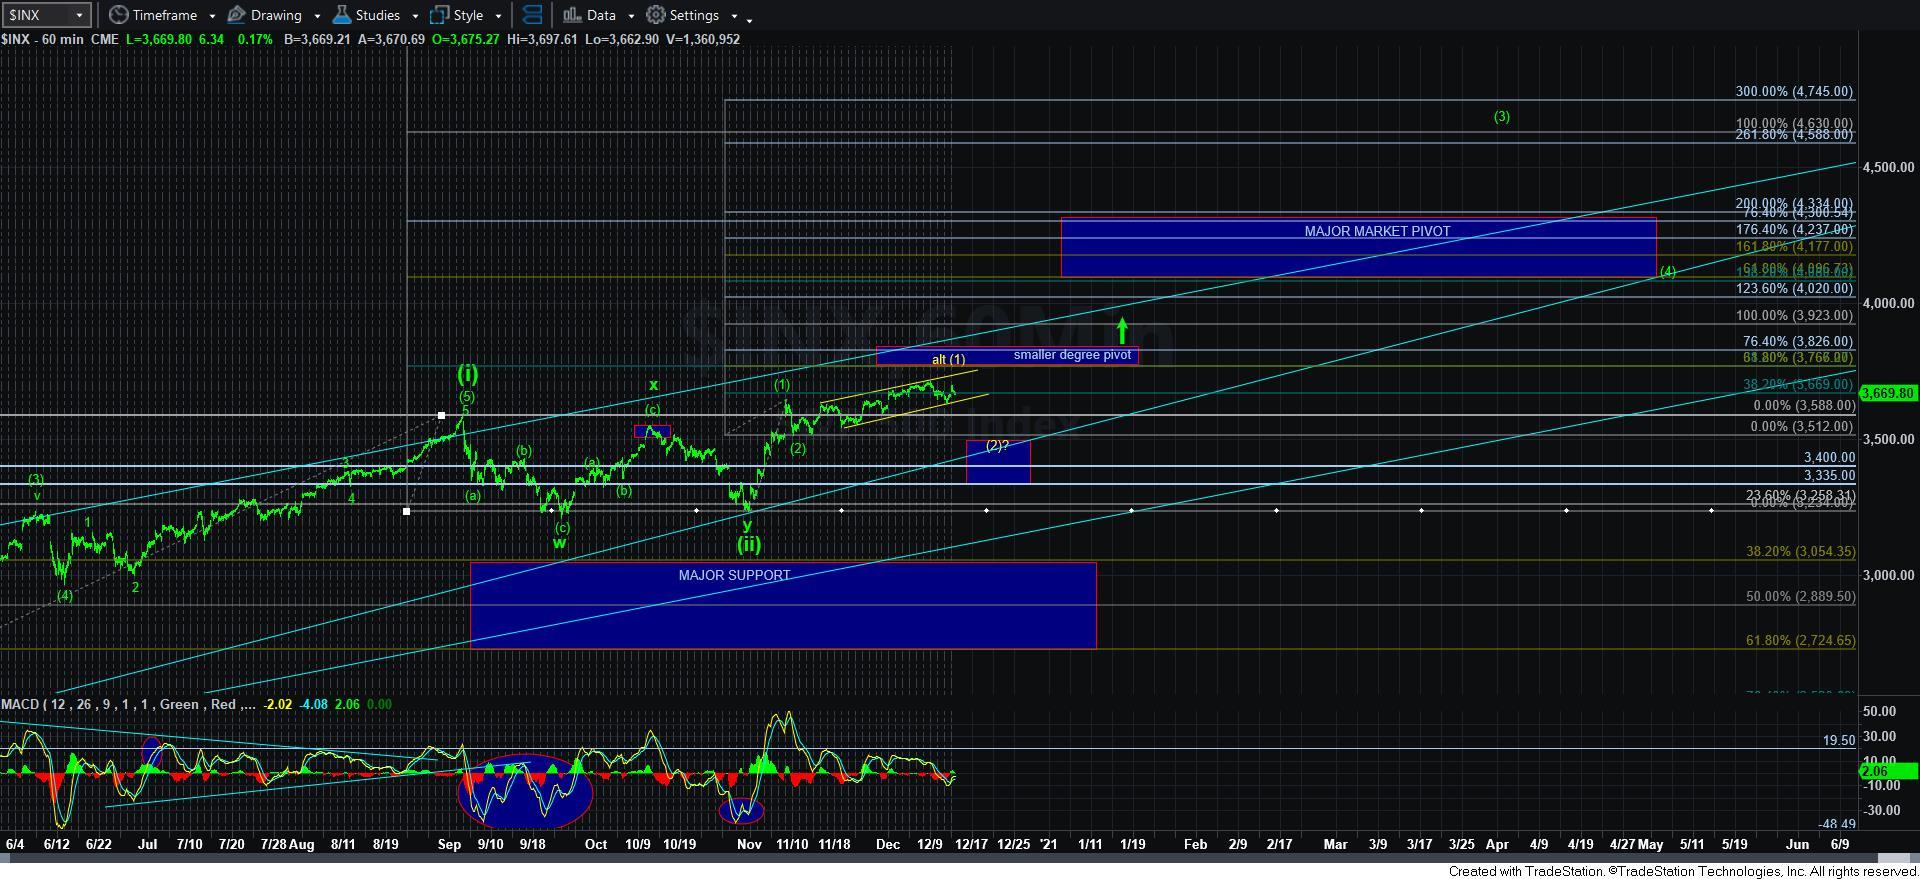
We have two potentials we have been tracking in the market of late. The “primary” count is presented in green, and represents the most aggressive bullish count on the charts. It relies on a wave [2] that was quite miniscule in relative size. And, the only reason I am even considering this potential is because the underlying market is quite bullish as we look towards 2021, and can break out at any point in time in the heart of a 3rd wave.
You see, when a chart is set up for a heart of a 3rd wave, it is not advisable to be strongly looking down, as the 3rd wave can trigger at any point in time. And, with the underlying stocks within the market breaking out one after another, it is only a matter of time before the SPX follows along.
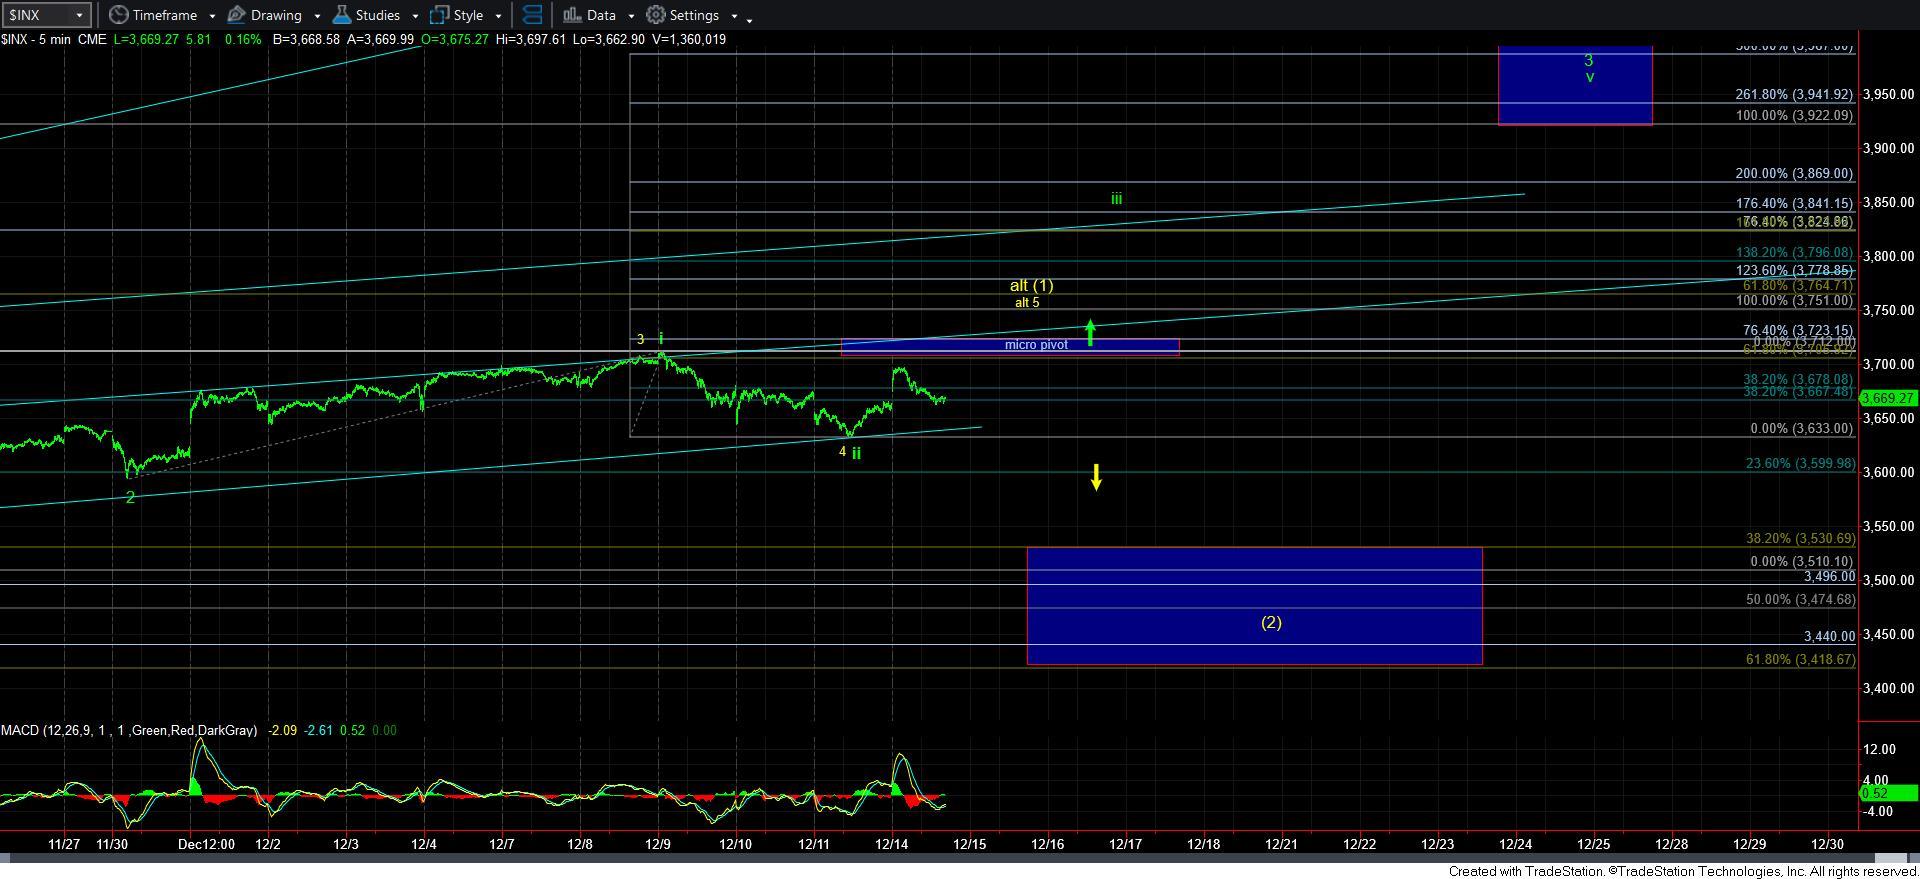
However, as I have said many times, the wave [2] within this aggressive bullish green count is just so small, it is not ordinarily reasonable to expect the market to be able to rally to 4000+ off such a small base. For this reason, I have still preferred to see more of a wave [2] pullback. Yet, we would need to break down below last week’s low to invalidate the immediate bullish micro set up presented as waves [i][ii] in green, and point us down to our yellow wave [2] target.
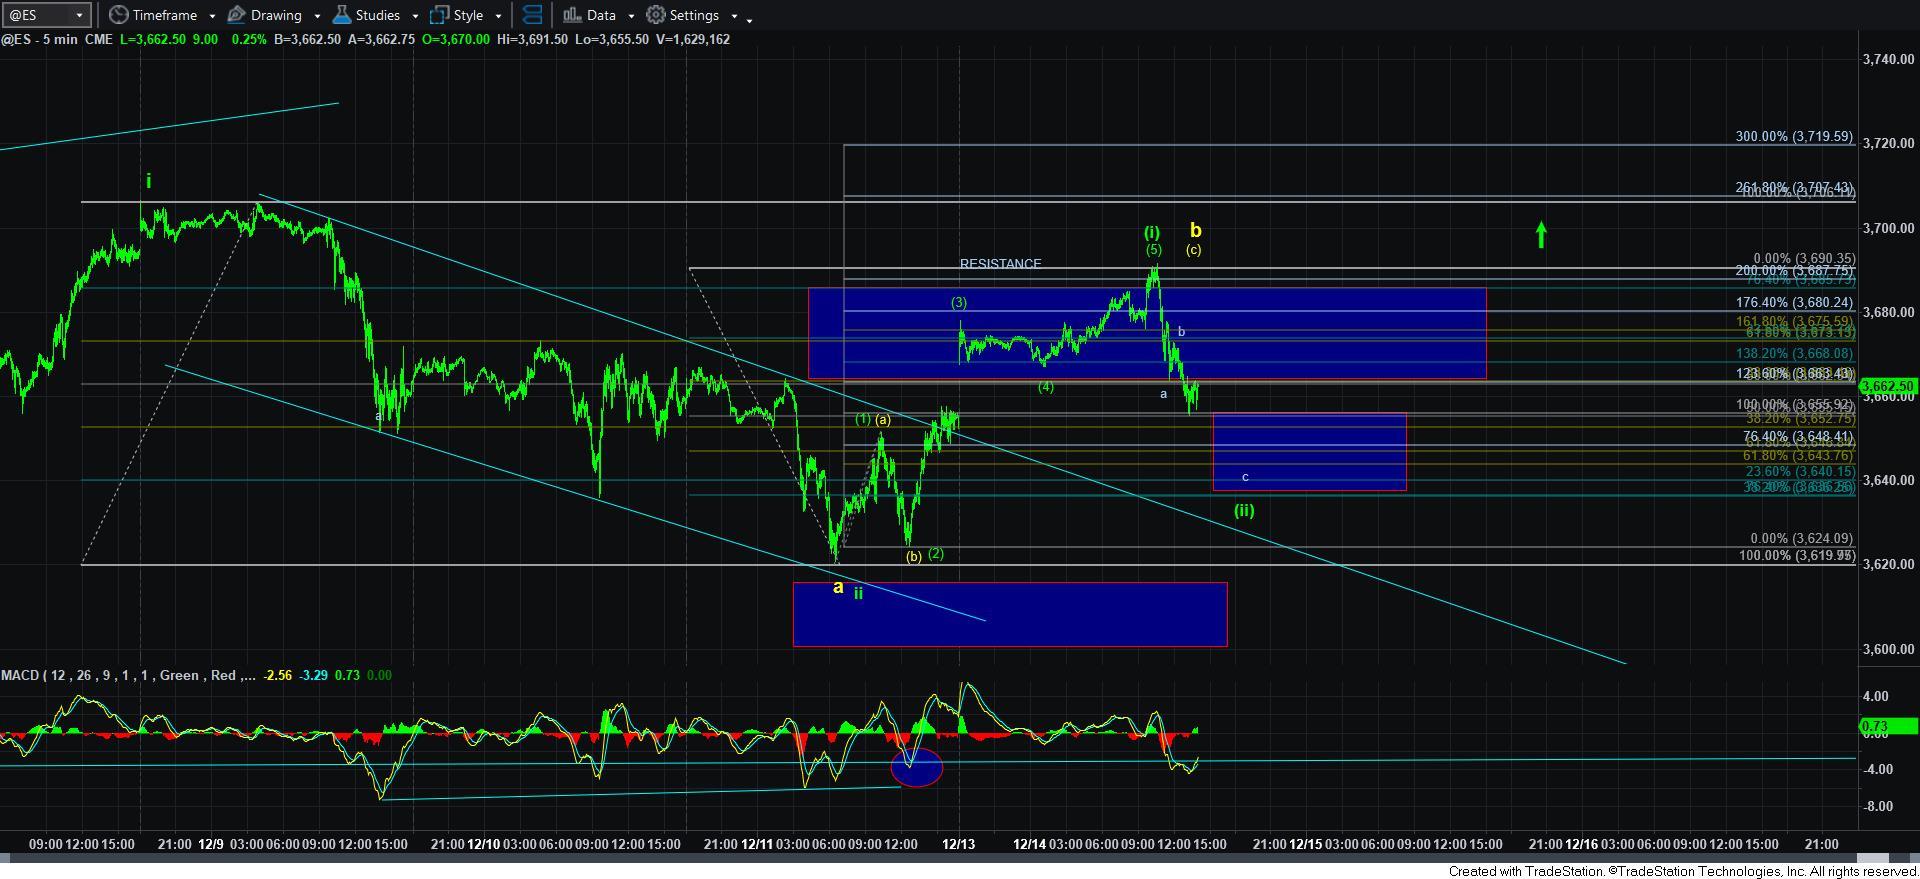
Moreover, the action off last week’s low can also be viewed as an initial 5-wave structure into today’s high based upon the structure presented in the ES chart. So, again, despite the misgivings I have for such a small potential wave [2], I cannot completely disregard the bulls ability to break out in a more immediate fashion.
If you look closely on the 5-minute SPX chart, I have added a new micro-pivot, which is now based upon the smaller wave degree represented by waves i and ii. If the market is able to break out through that pivot this week, that will be our main support to keep pressure higher. That region is the .618-.764 extension of waves i and ii, as they present right now, and that region is the 3705-3723SPX region. Should we break out over that region, then that will be our bullish support for the market to continue to extend higher to the 3900+ region sooner rather than later.
However, if we break out over that pivot, and then break back below the pivot thereafter, it would bolster the yellow wave [1] potential, and suggest that we are likely in a bigger wave [2] pullback.
So, in summary, it is no surprise to anyone who has read my analysis for the last 6 months to know that I am quite bullish as we look towards 2021. However, I am still attempting to maintain a door open for the market to provide us with a more reasonable wave [2] pullback before we begin that rally over 4000 in earnest.
While I am not sure how much longer the market is going to bide its time until it makes the wave [2] placement clear, it has certainly been doing a masterful job of maintaining both potentials at this time. While I still prefer more of a wave [2] pullback, should we break out over the 5-minute chart pivot, the bears are going to have to pull us back below it in order to prove that a larger wave [2] is still in the cards – or to more immediately break down below last week’s low.
Lastly, near term resistance is today’s high, with micro support in the 3635-55ES region. Should we break out over today’s high before breaking below last week’s low, the bulls retain the ball and will likely take us to new all time highs.