Hovering Over Support - Market Analysis for Jan 9th, 2020
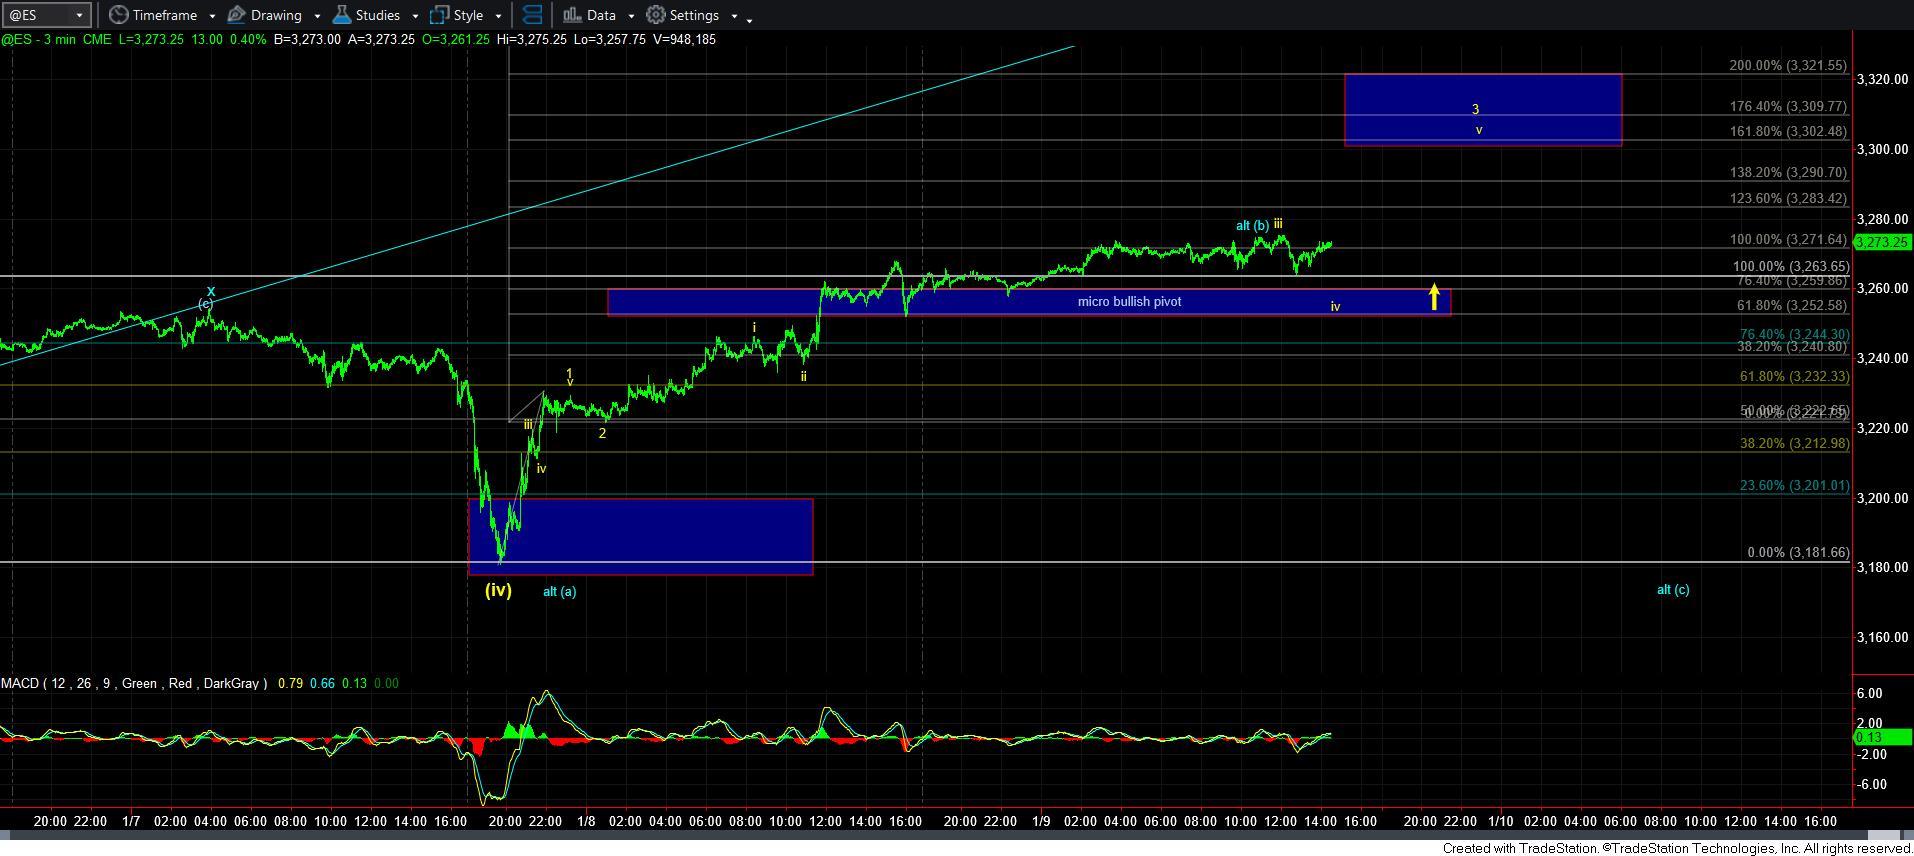
With the ES moving through the micro pivot on the 3-minute chart, we are hovering over the pivot all day today. And, as long as we remain over this pivot, I now have to respect the yellow count much more so. What this means in the near term is that as long as we remain over this micro pivot, I am looking to target the 3338SPX region.
Moreover, should the market continue higher over 3284ES, I will move the micro pivot up to the 3260-3271ES region.
Alternatively, should the market break down below the pivot in the coming day, then I will again, have to apply the blue count, as shown on the 3-minute chart as well.
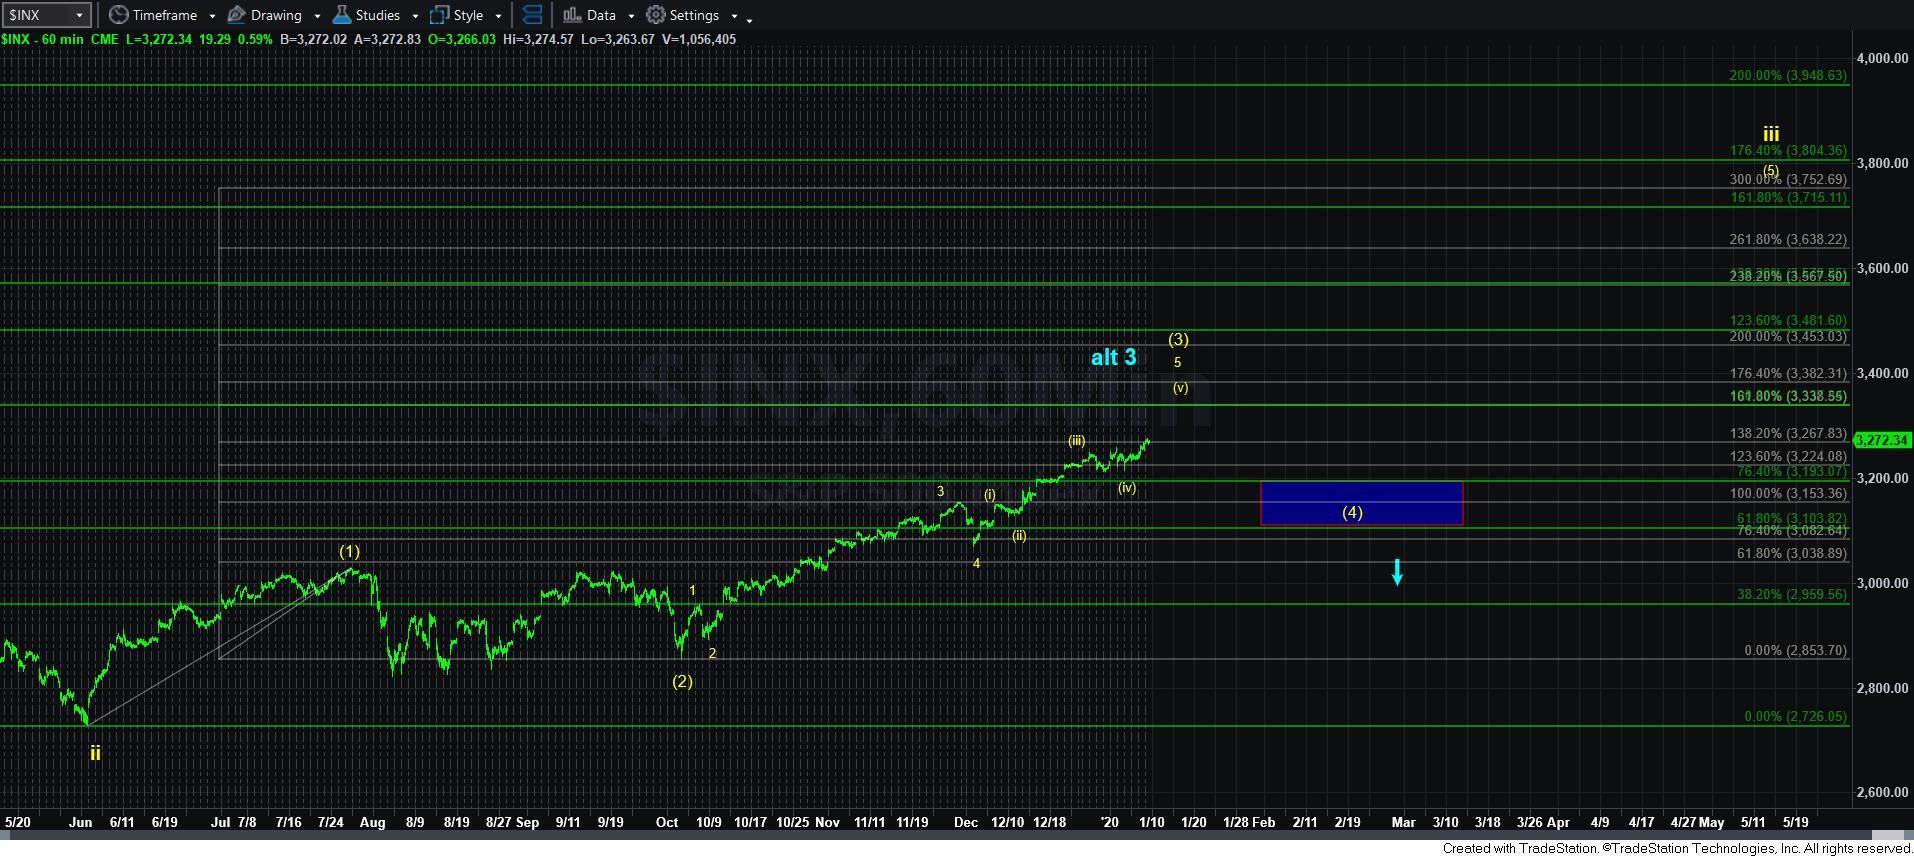
In the bigger perspective, I think it to be important for the market to continue to the 3338SPX region if I am going to view the yellow count as a high probability. That means that if we do move up towards that target, and then pullback to the wave [4] target box below (with an ideal pullback target in the 3150SPX region), then I will view that as a buying opportunity for a 500-700 point rally in wave [5] of iii.
However, if the market should break down below the larger degree wave [4] support box after moving up towards that 3338 region, I would apply a different alternative count which would suggest that wave 3 off the 2009 lows is actually ending here, and the 4th wave towards 2200SPX is yet to be seen. But, again, we would need a break down below 3100SPX from the 3338SPX region for me to consider that alternative. As long as the market is able to continue its march to the 3338SPX region in the current micro set up, then I will have to make the yellow count my primary count until proven otherwise.