Hitting Resistance - Market Analysis for Aug 12th, 2025
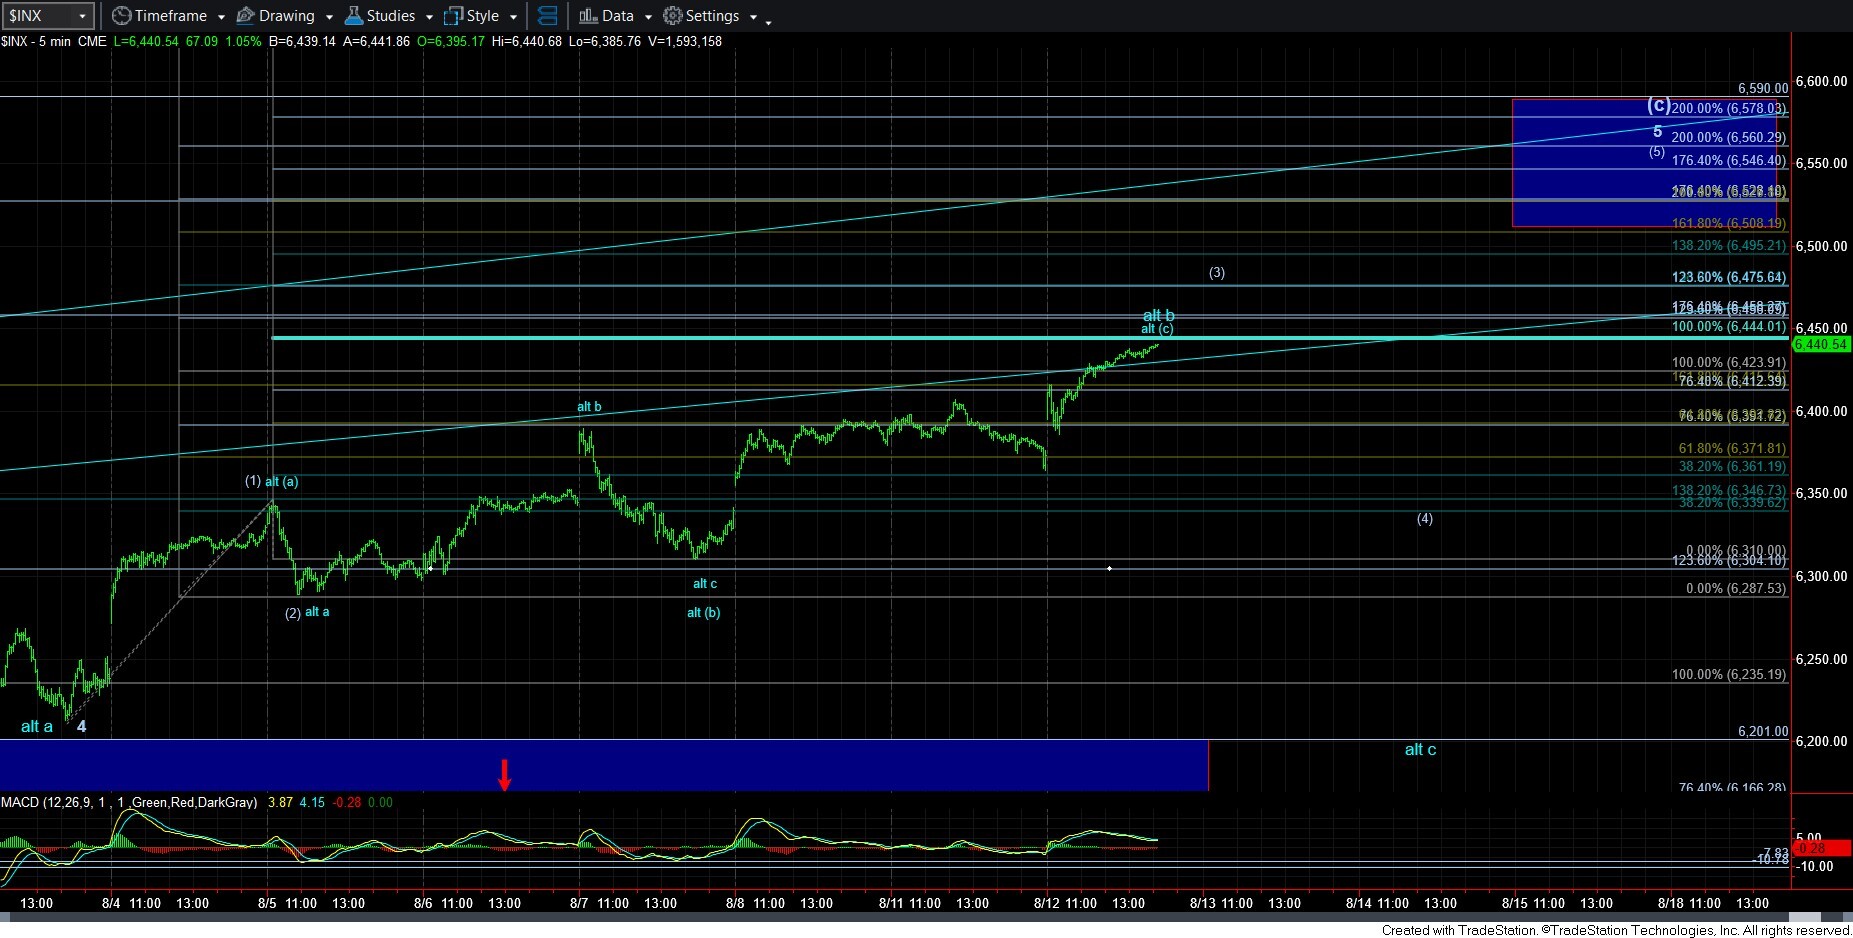
With the continuation move higher today, the market is now pushing on the all-time high struck in the futures market at the end of August. Moreover, since the manner in which we have rallied off the 6212SPX low is rather corrective and overlapping, there is even potential we are striking an [a][b][c] conclusion to a rally, as I have outlined in the alternative blue count.
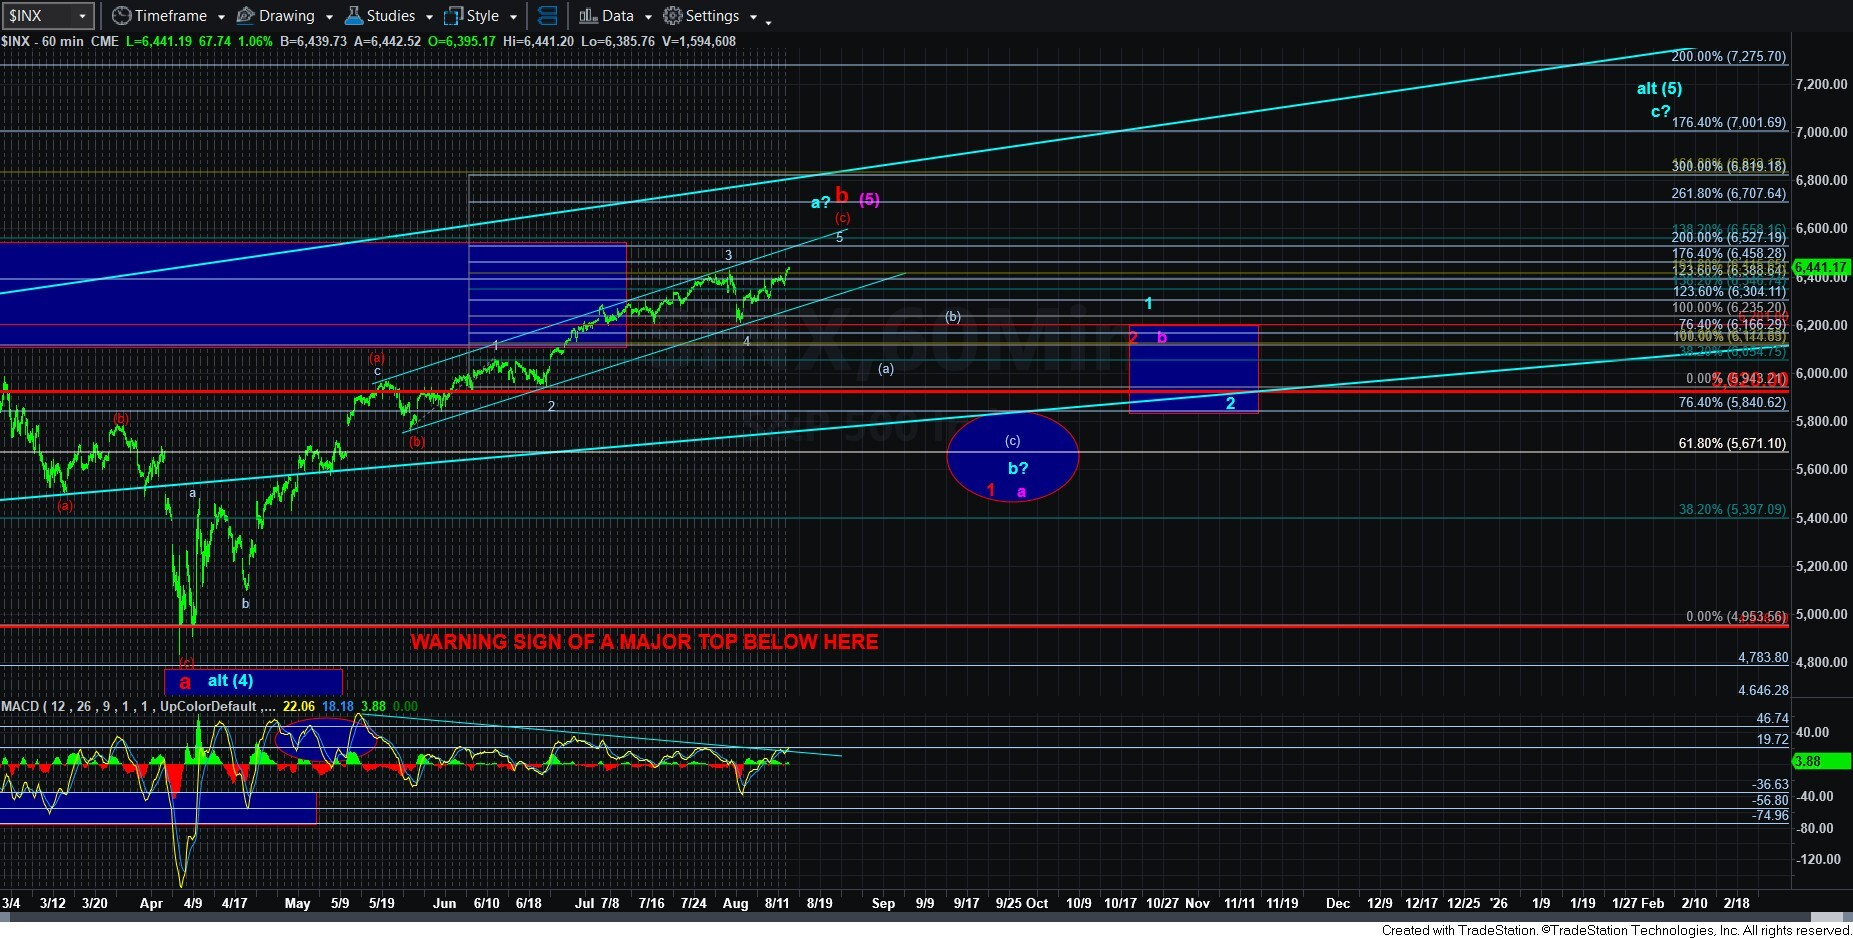
So, where this leaves us is maintaining a view higher towards the next target/resistance box on the 5-minute chart. But, that structure, since it is overlapping, is most likely taking shape as a diagonal. Therefore, the target for wave (3) is in the 1.236 extension of waves (1)(2), which is in the 6475SPX region. Thereafter, we could see a wave (4) that takes us back to the region of wave (1), to be followed by a 5th wave to the target box overhead on the 5-minute SPX chart.
However, we are now coming to a resistance region of the prior all-time high in the futures market, which also coincides with a potential [a]=[c] rally, highlighted by the blue count and blue Fib line at 6444SPX. Should we see the market react from this region in an impulsive downside manner, then it could open the door to a retest of the 6200SPX region with a c-wave down, as outlined by the blue count.
For now, I am leaving the blue count as an alternative, and allowing the market to at least provide to us an initial 5 wave decline from the 6444SPX resistance level. Until I see some evidence such as that, I am going to maintain a view to the target box overhead.