Higher Is Becoming Likely
As I outlined yesterday, if the market is able to take us through the 4351ES region, we have a very reasonable 5-wave rally structure. That means that it is reasonable to assume that we can see higher in the coming week. The question now is a matter of path.
My primary count still remains that this is a 5-wave [a] wave within the b-wave I am tracking. But, in order to confirm this potential, we need to see a [b] wave pullback in the coming days. We need to break down below 4340SPX to suggest that the [b] wave is in progress.
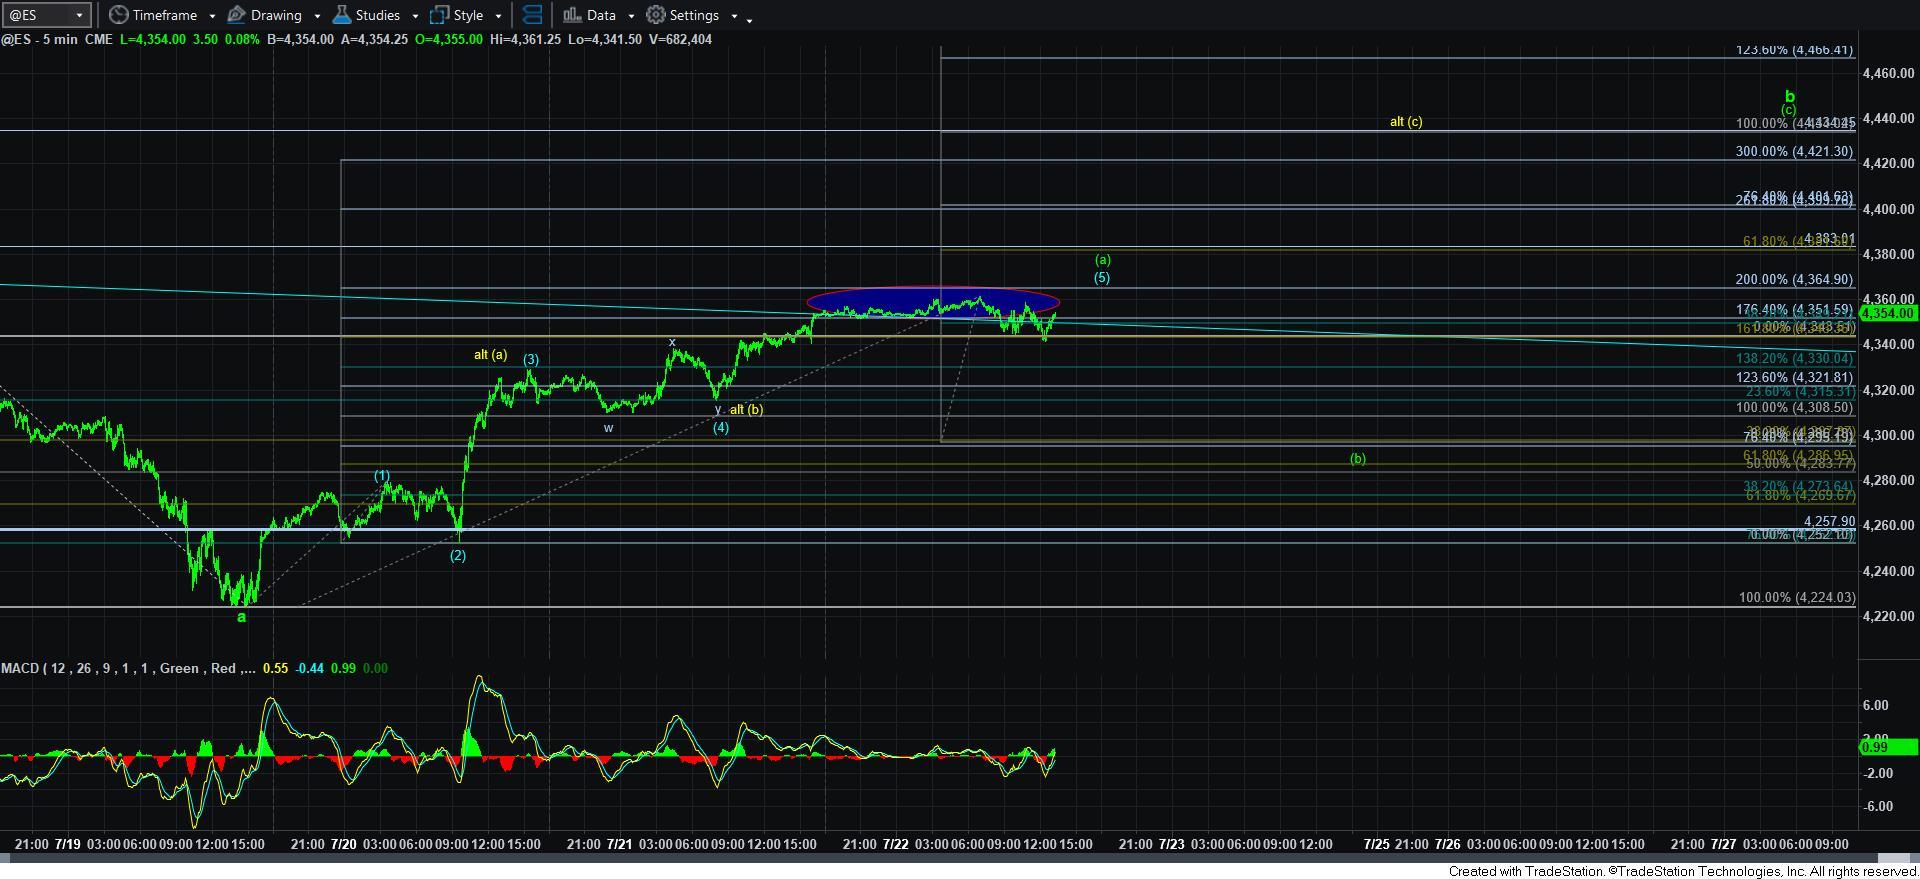
Alternatively, I have added another potential manner in which we rally to the 4421-35ES region, as presented on the 5-minute ES chart attached below. The 4365S region is the 2.00 extension of waves [1] [2] off the low struck earlier this week. That is commonly where a 5-wave structure terminates. Therefore, if we should see a strong move through that resistance, then the probabilities for a more direct attack on the 4420-35ES region becomes much more likely, as presented in the yellow count.
Once the market provided us with that 5th wave near the close yesterday, I posted the following intra-day update, which is still quite applicable today:
“With the ES now extending into the 5-wave target zone, I have to say that the potential for this to be all of a b-wave has been significantly diminished. IF, again, IF the market provides us with a CLEAR 5-wave decline from here, then I will bring back that potential.
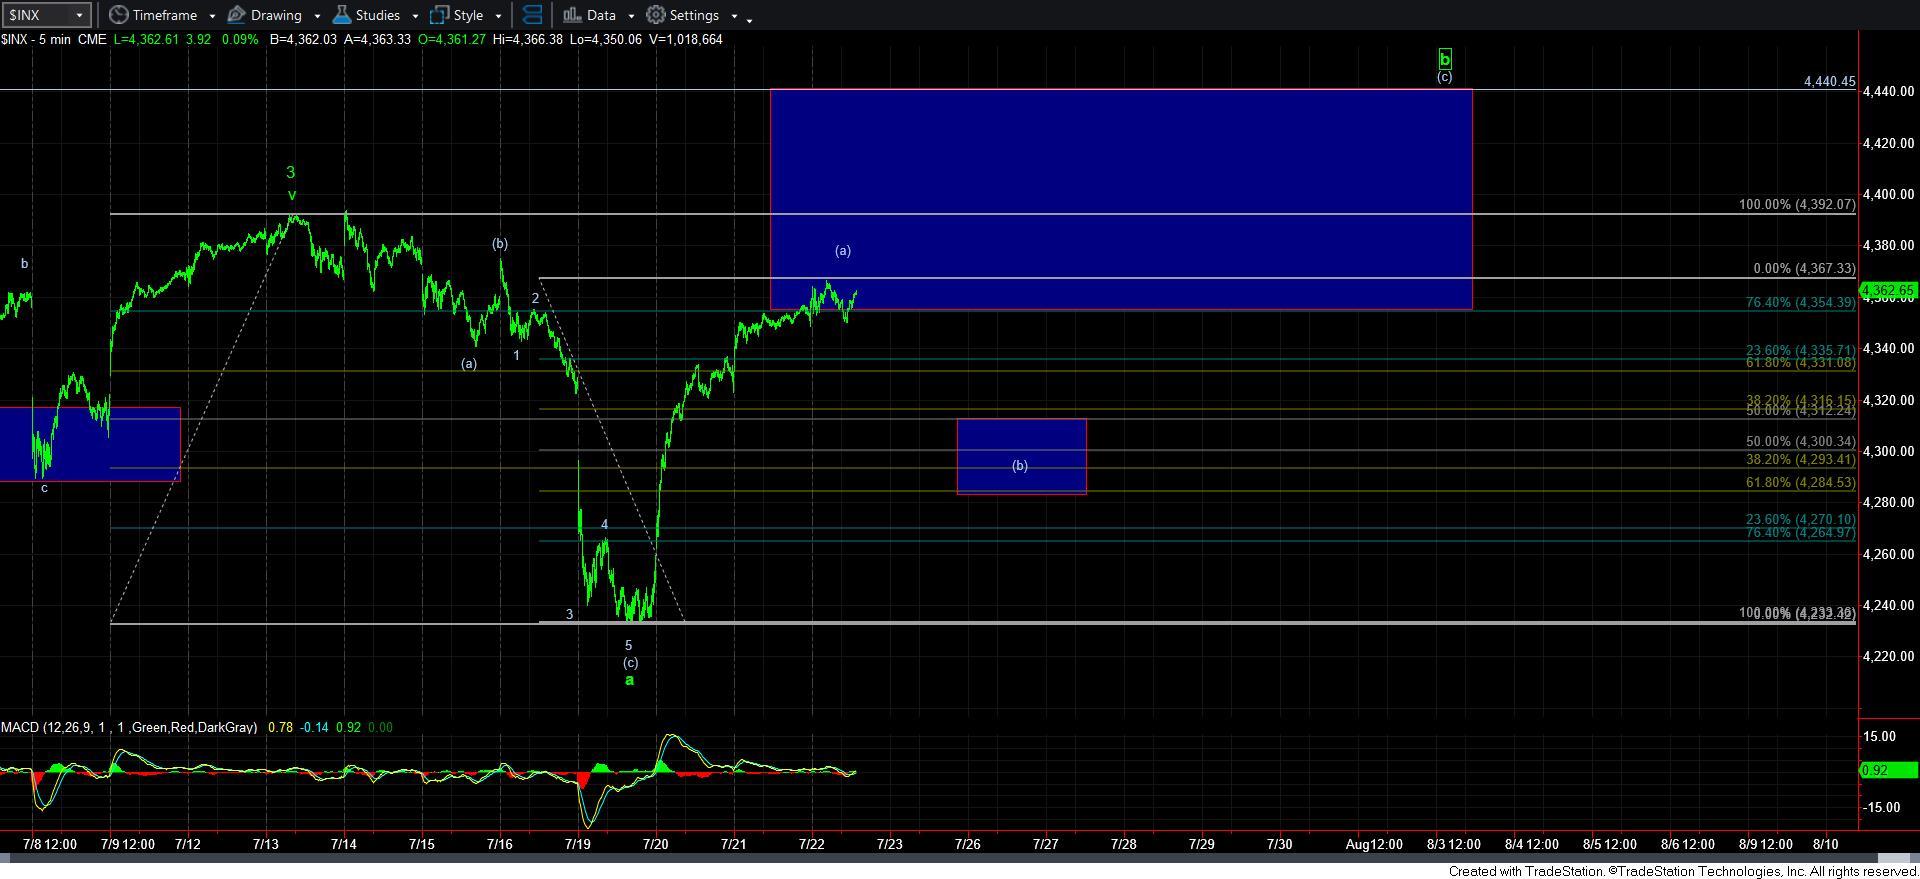
For now, I am still viewing this as the (a) wave of the b-wave, with a (b) wave pullback to come, followed by a (c) wave pointing us towards the 4440SPX region.
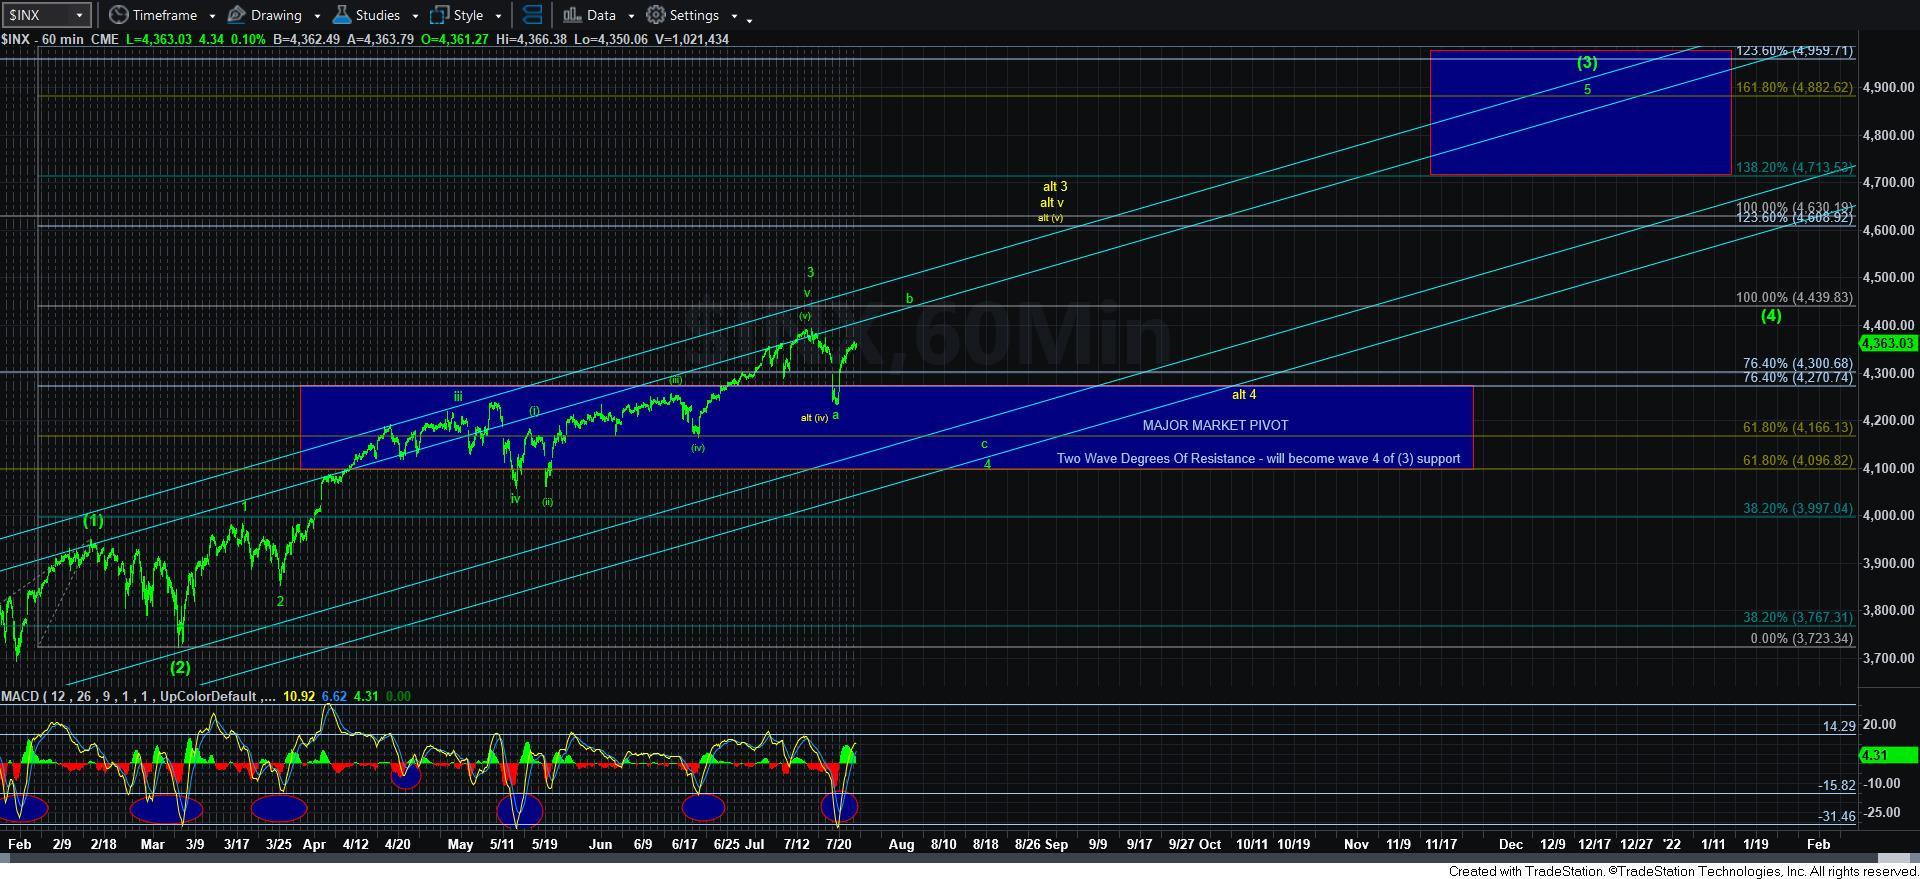
But, this now leaves me searching for a reasonable alternative. So, it brings me back to the overlapping structure we had to deal with in May and June, which can still potentially be completing a bigger ending diagonal for wave V of 3, and it is now in yellow. The only way I would consider this is if we see a strong extension through 4440SPX. This is also not my expectation at this point in time.
So, it still leaves me with the original b-wave I have been outlining this week as the most likely perspective in my humble opinion. Others may certainly disagree with me due to all the overlap, which clearly has made this much more complex. But, for now,. this is how I see the most reasonable path. And, should we see a CLEAR 5-wave decline, then I will adjust, as outlined above.”
As you can also see from the attached 5-minute SPX chart, I have added a support region for a potential [b] wave pullback. And, based upon the structure of the market as outlined above, as long as we remain over that support, I expect us to be hitting new market highs, and potentially target that 4440SPX region that we have had our eyes on for some time.