Here Is What I Know
We came into this week expecting to hit a low and then see a rally. Boy have we seen a rally.
If you remember my updates last week, I outlined how markets can often reach levels in b-waves from which the standard structure that preceded it came up short. This morning, the futures market broke out through our primary resistance region, and rallied right up into that higher resistance region I was highlighting for a potential b-wave.
But, as the market pulled back, I had to track the potential that we see a higher high and complete a relatively nice 5-wave rally off the recent low. Yet, when the market broke down below the standard .382 retracement for a 4th wave, it certainly made it less likely that the market is ready to break out just yet to 4300+.
So, let’ me tell you what I know.
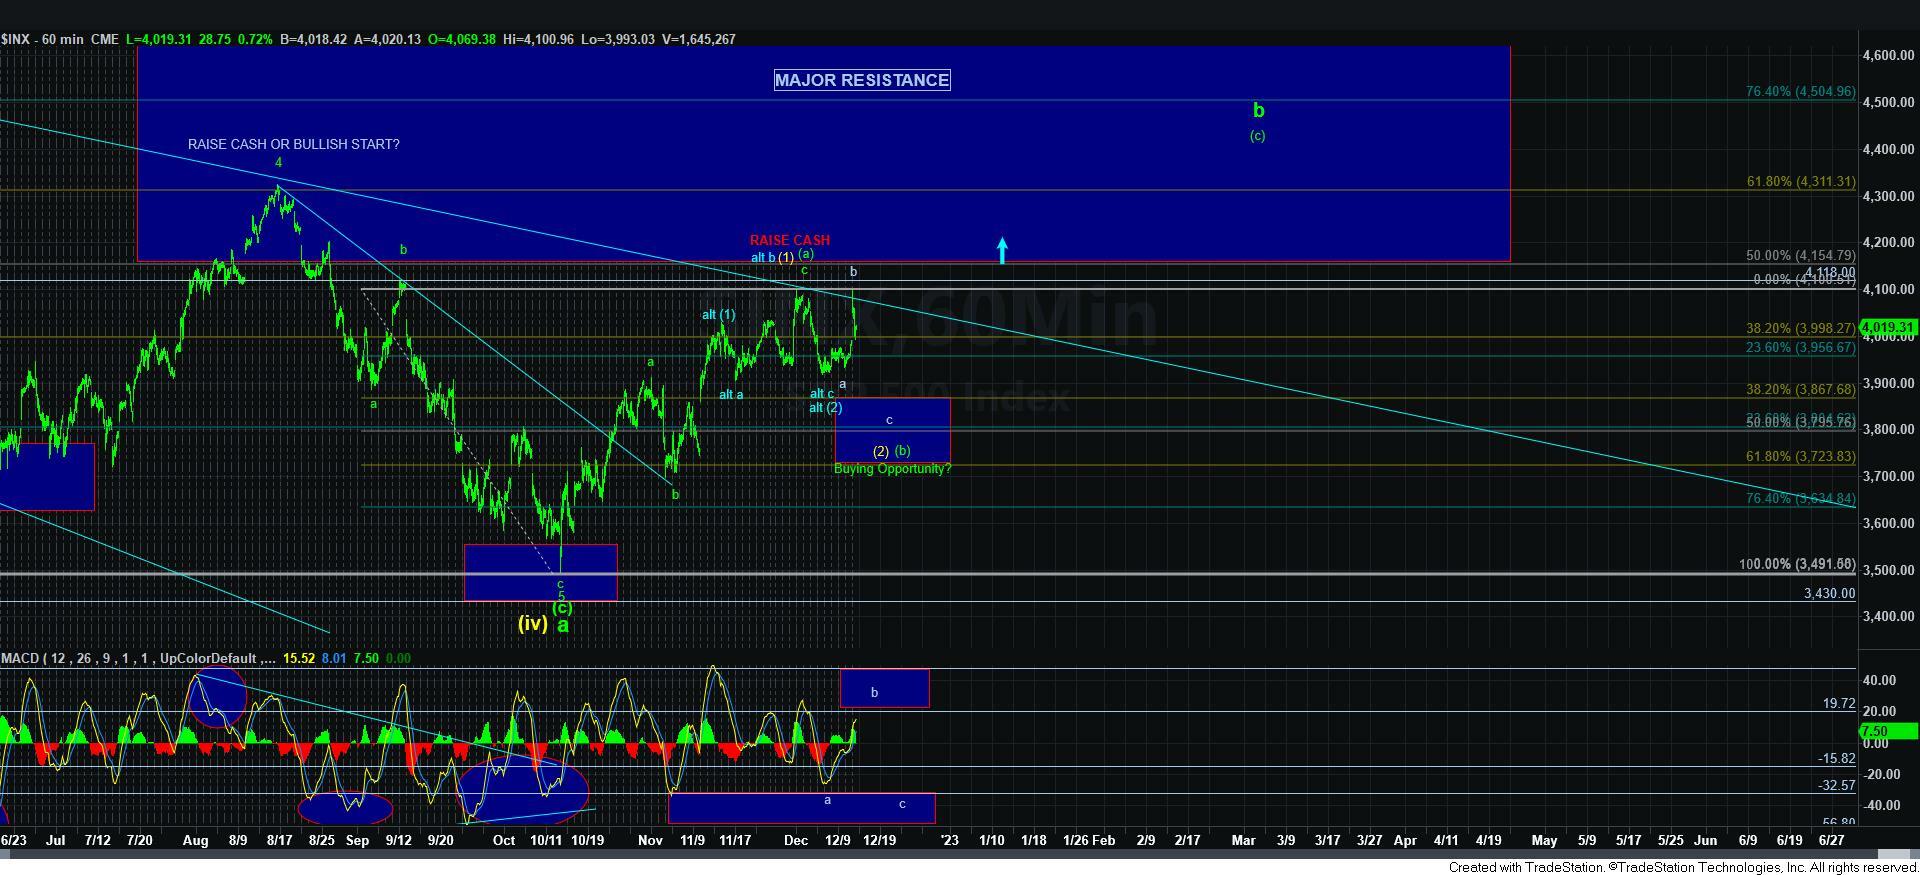
First, I am still very much of the opinion that we will likely rally to 4300SPX+. Yet, the path is still not clarified.
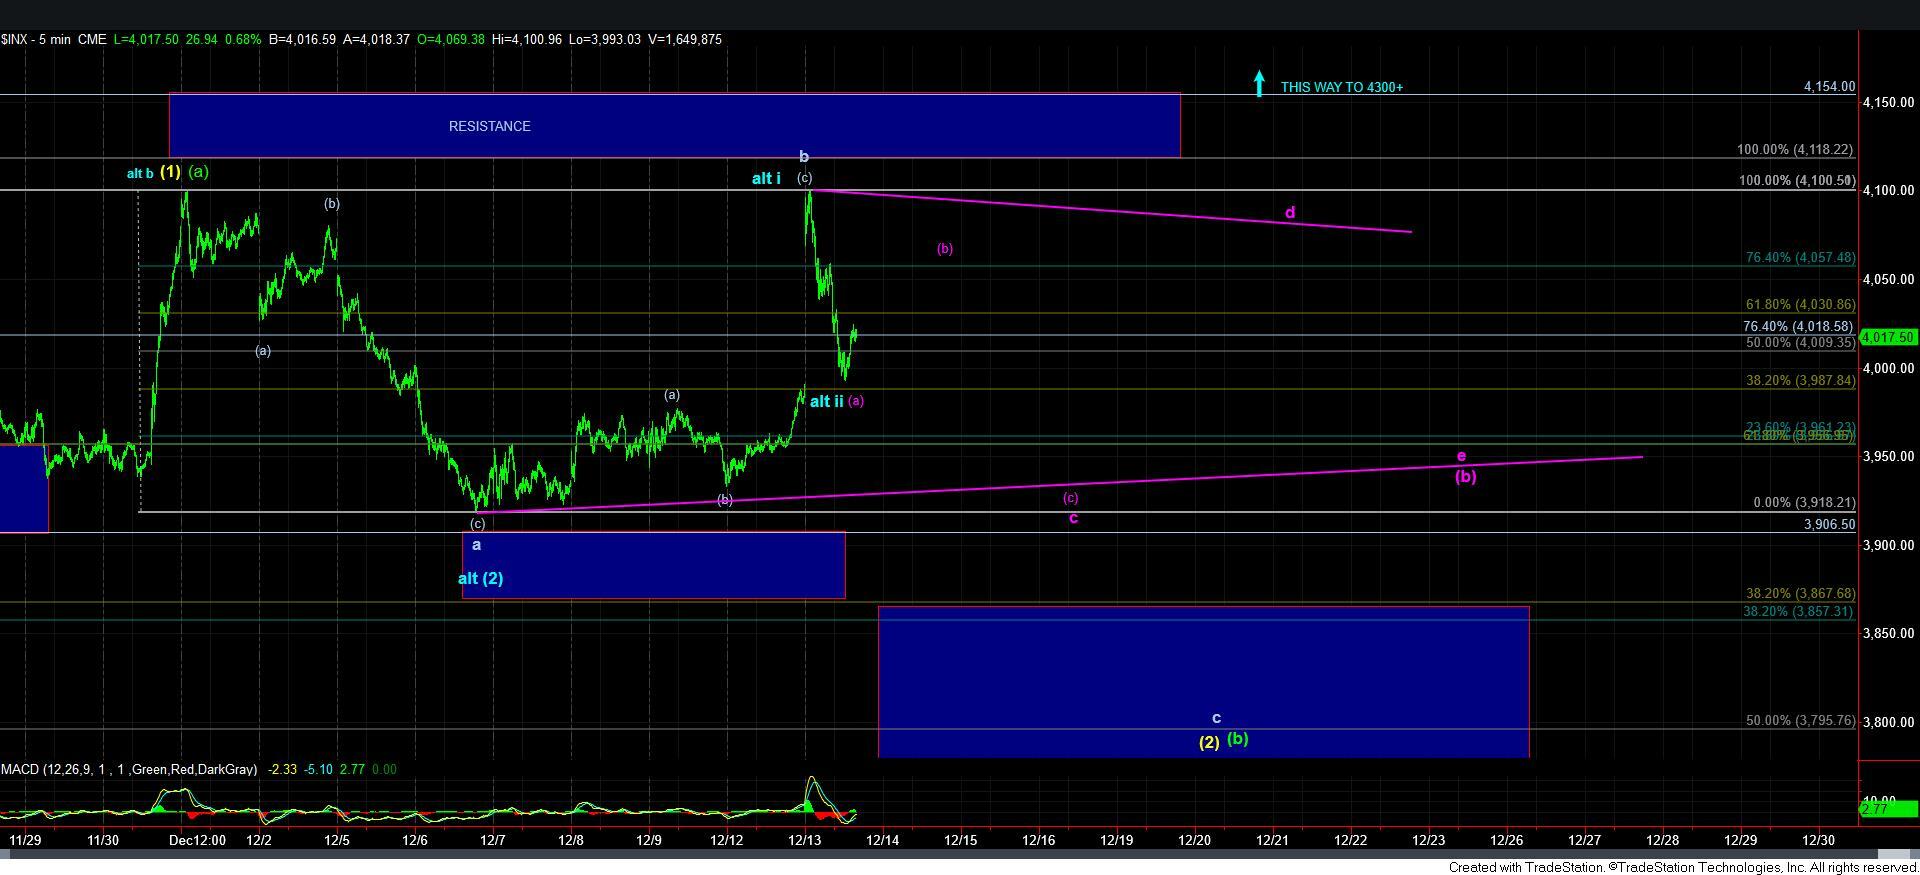
Second, as you can see from the 5-minute SPX chart, I am still leaving the blue alternative count on the chart. But, it still remains 3rd in line for me in terms of probability. The rally today best counted as a 3-wave high, which leaves me with the b-wave top. Of course, should the market break back out over the high we struck today, then I will have no choice but to adopt this count, especially if that break out is with a clear 5-wave structure. What is interesting is that the pullback thus far today has retraced to the .618 retracement of the rally, which is a common target for a 2nd wave. But, again, I struggle to be able to count 5 waves up into the high. So, this remains on the backburner as long as we remain below today’s high.
This brings me to my next point. There are a number of other charts that are strongly suggestive that the market drops in the c-wave we had wanted to take us to our larger degree support below. And, for now, this is my primary count, with today’s high being a b-wave. If you remember, c-waves are often 5-wave structures. However, I simply cannot make out a clear 5-wave decline off today’s high. (And, that is another reason I am forced to still track the blue count). Yet, there is a lot of other evidence that the market wants that c-wave down.
So, this brings me to another potential I have added today – the purple triangle. The structure of the decline points to the potential that we are in the c-wave of the triangle, which means we will not break down below last week’s low. But, if we are in a triangle, then we will likely see much more whispaw as the market attempts to complete the c-d-e waves over the coming week or two.
The other potential is that the c-wave into our target box below takes shape as an ending diagonal. But, I do not have anything I can sink my teeth into right now to suggest this is a high probability.
So, it leaves me sitting on my hands, and allowing the market to tell us how it wants to complete this pullback before we head to the 4300+ region over the coming months. Should I see a better 5-wave decline develop in the SPX, then I will post accordingly in the trading room. But, if we do go lower now to complete a wave 1 of the c-wave, then it likely means the c-wave can be deeper than I would normally expect it at this time, and would likely be pointing to the lower half of the support box below.
Ultimately, I am seeking an appropriate place for me to redeploy some the cash I have raised over the last year for a run to 4300+. Ideally, it will either be in the support box below if we can follow through on the c-wave down into that box. But, if the triangle plays out, then I will likely redeploy some cash during the e-wave of the triangle. I will likely then add more after we get a 1-2 structure off that low.
So, again, in the meantime, I am trying to stay focused on the bigger picture, and stay focused on my goal to deploy some cash for a rally to 4300+. Therefore, I have to wait for the market to clarify its intentions in this current region before I am willing to deploy cash on the long side.
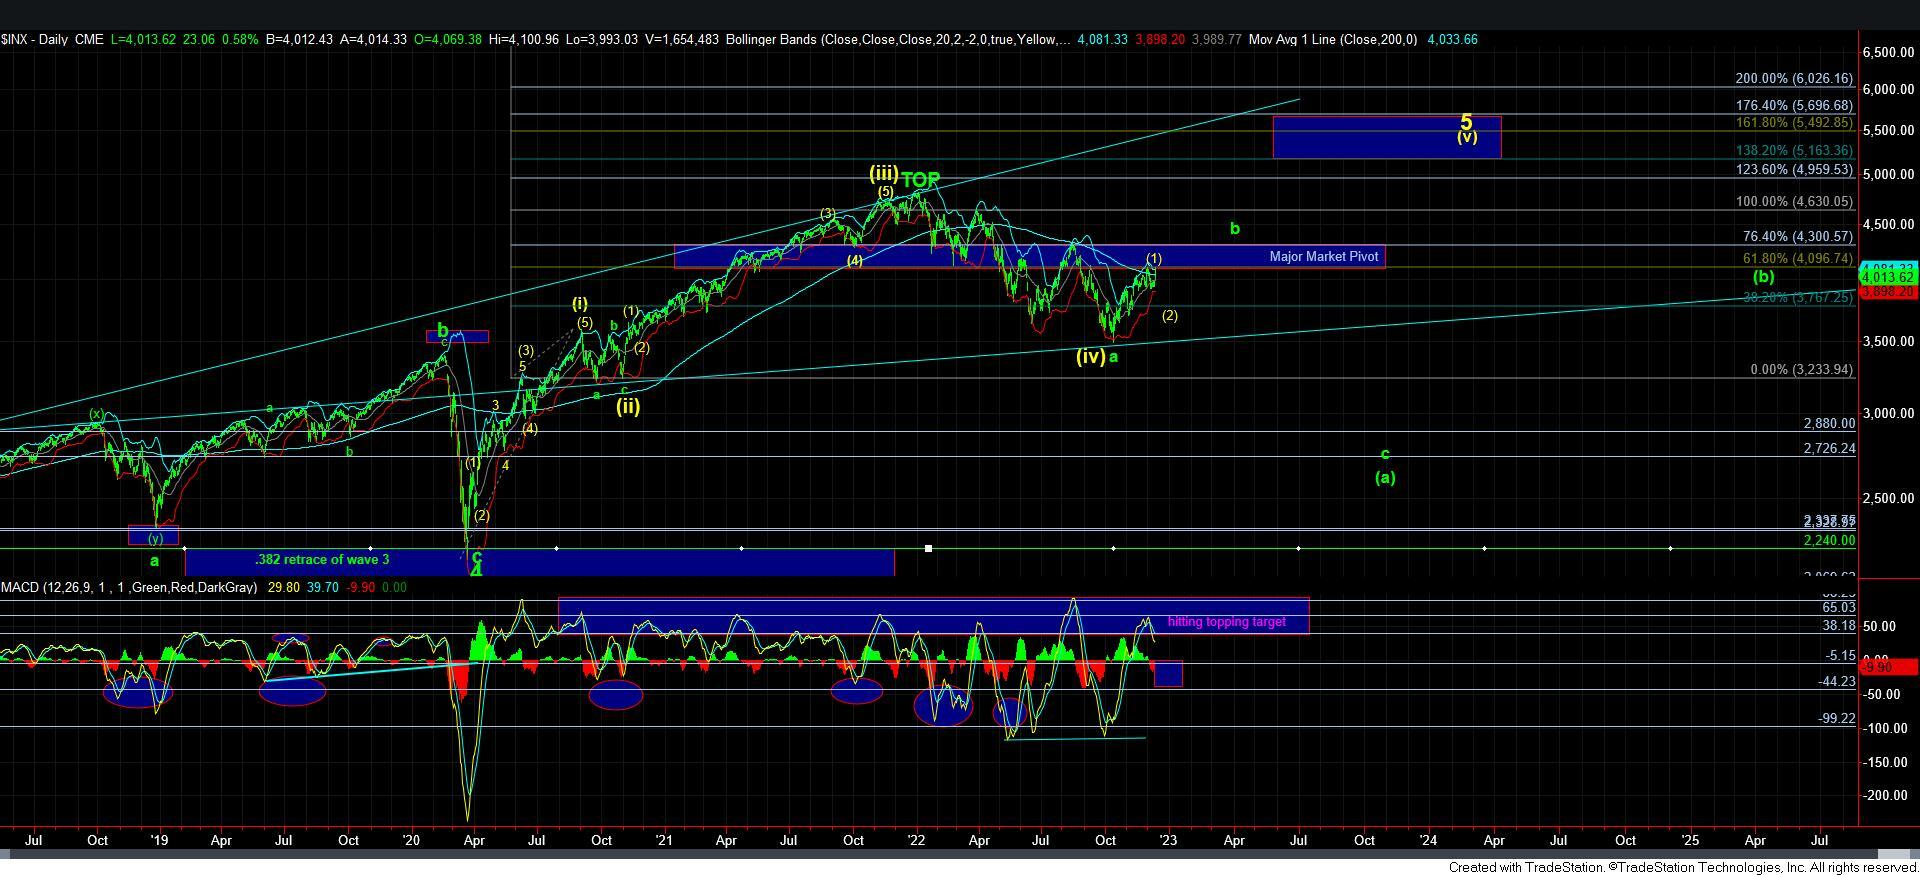
Lastly, I still cannot say that the MACD on the daily chart has pulled back sufficiently to support another larger rally just yet.