Have We Begun The Wave c of 4?
 By
By
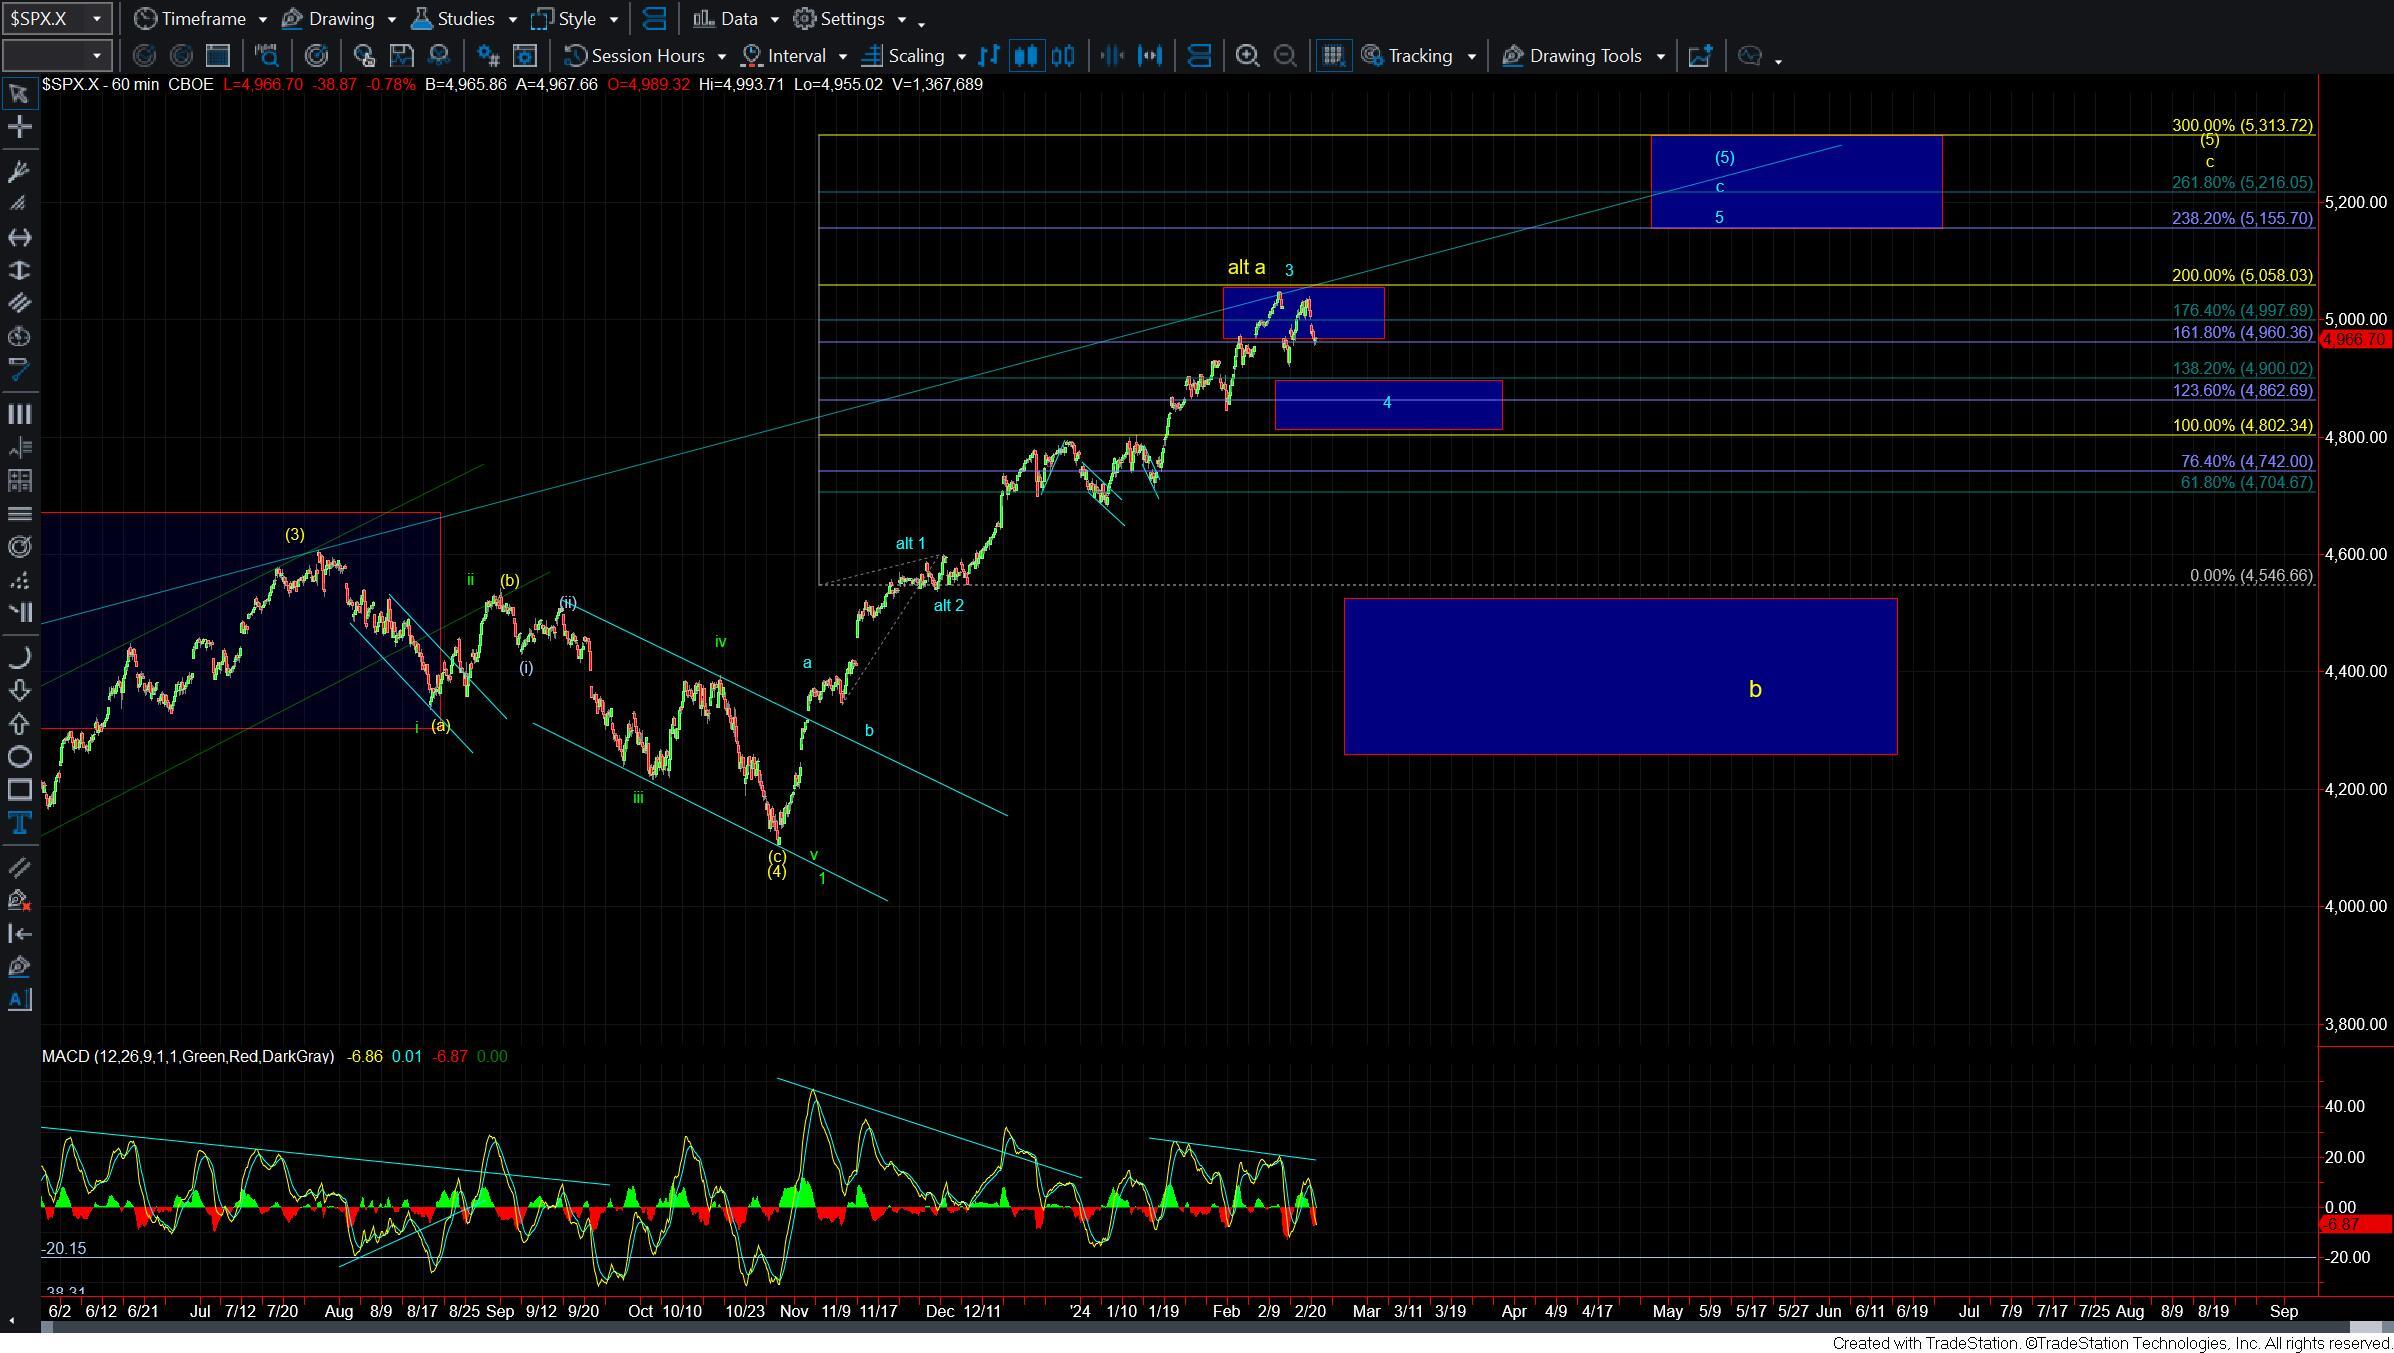
Today we saw the markets move lower across the board after getting a fairly deep retrace higher last week. This move down has given us the initial confirmation that we have indeed begun the wave (c) of 4 down. Now we do still have a bit more work to do to further confirm this and fill out that wave (c) of 4 but with today's action, we do now have initial confirmation that we have indeed begun the wave (c) of 4 down.
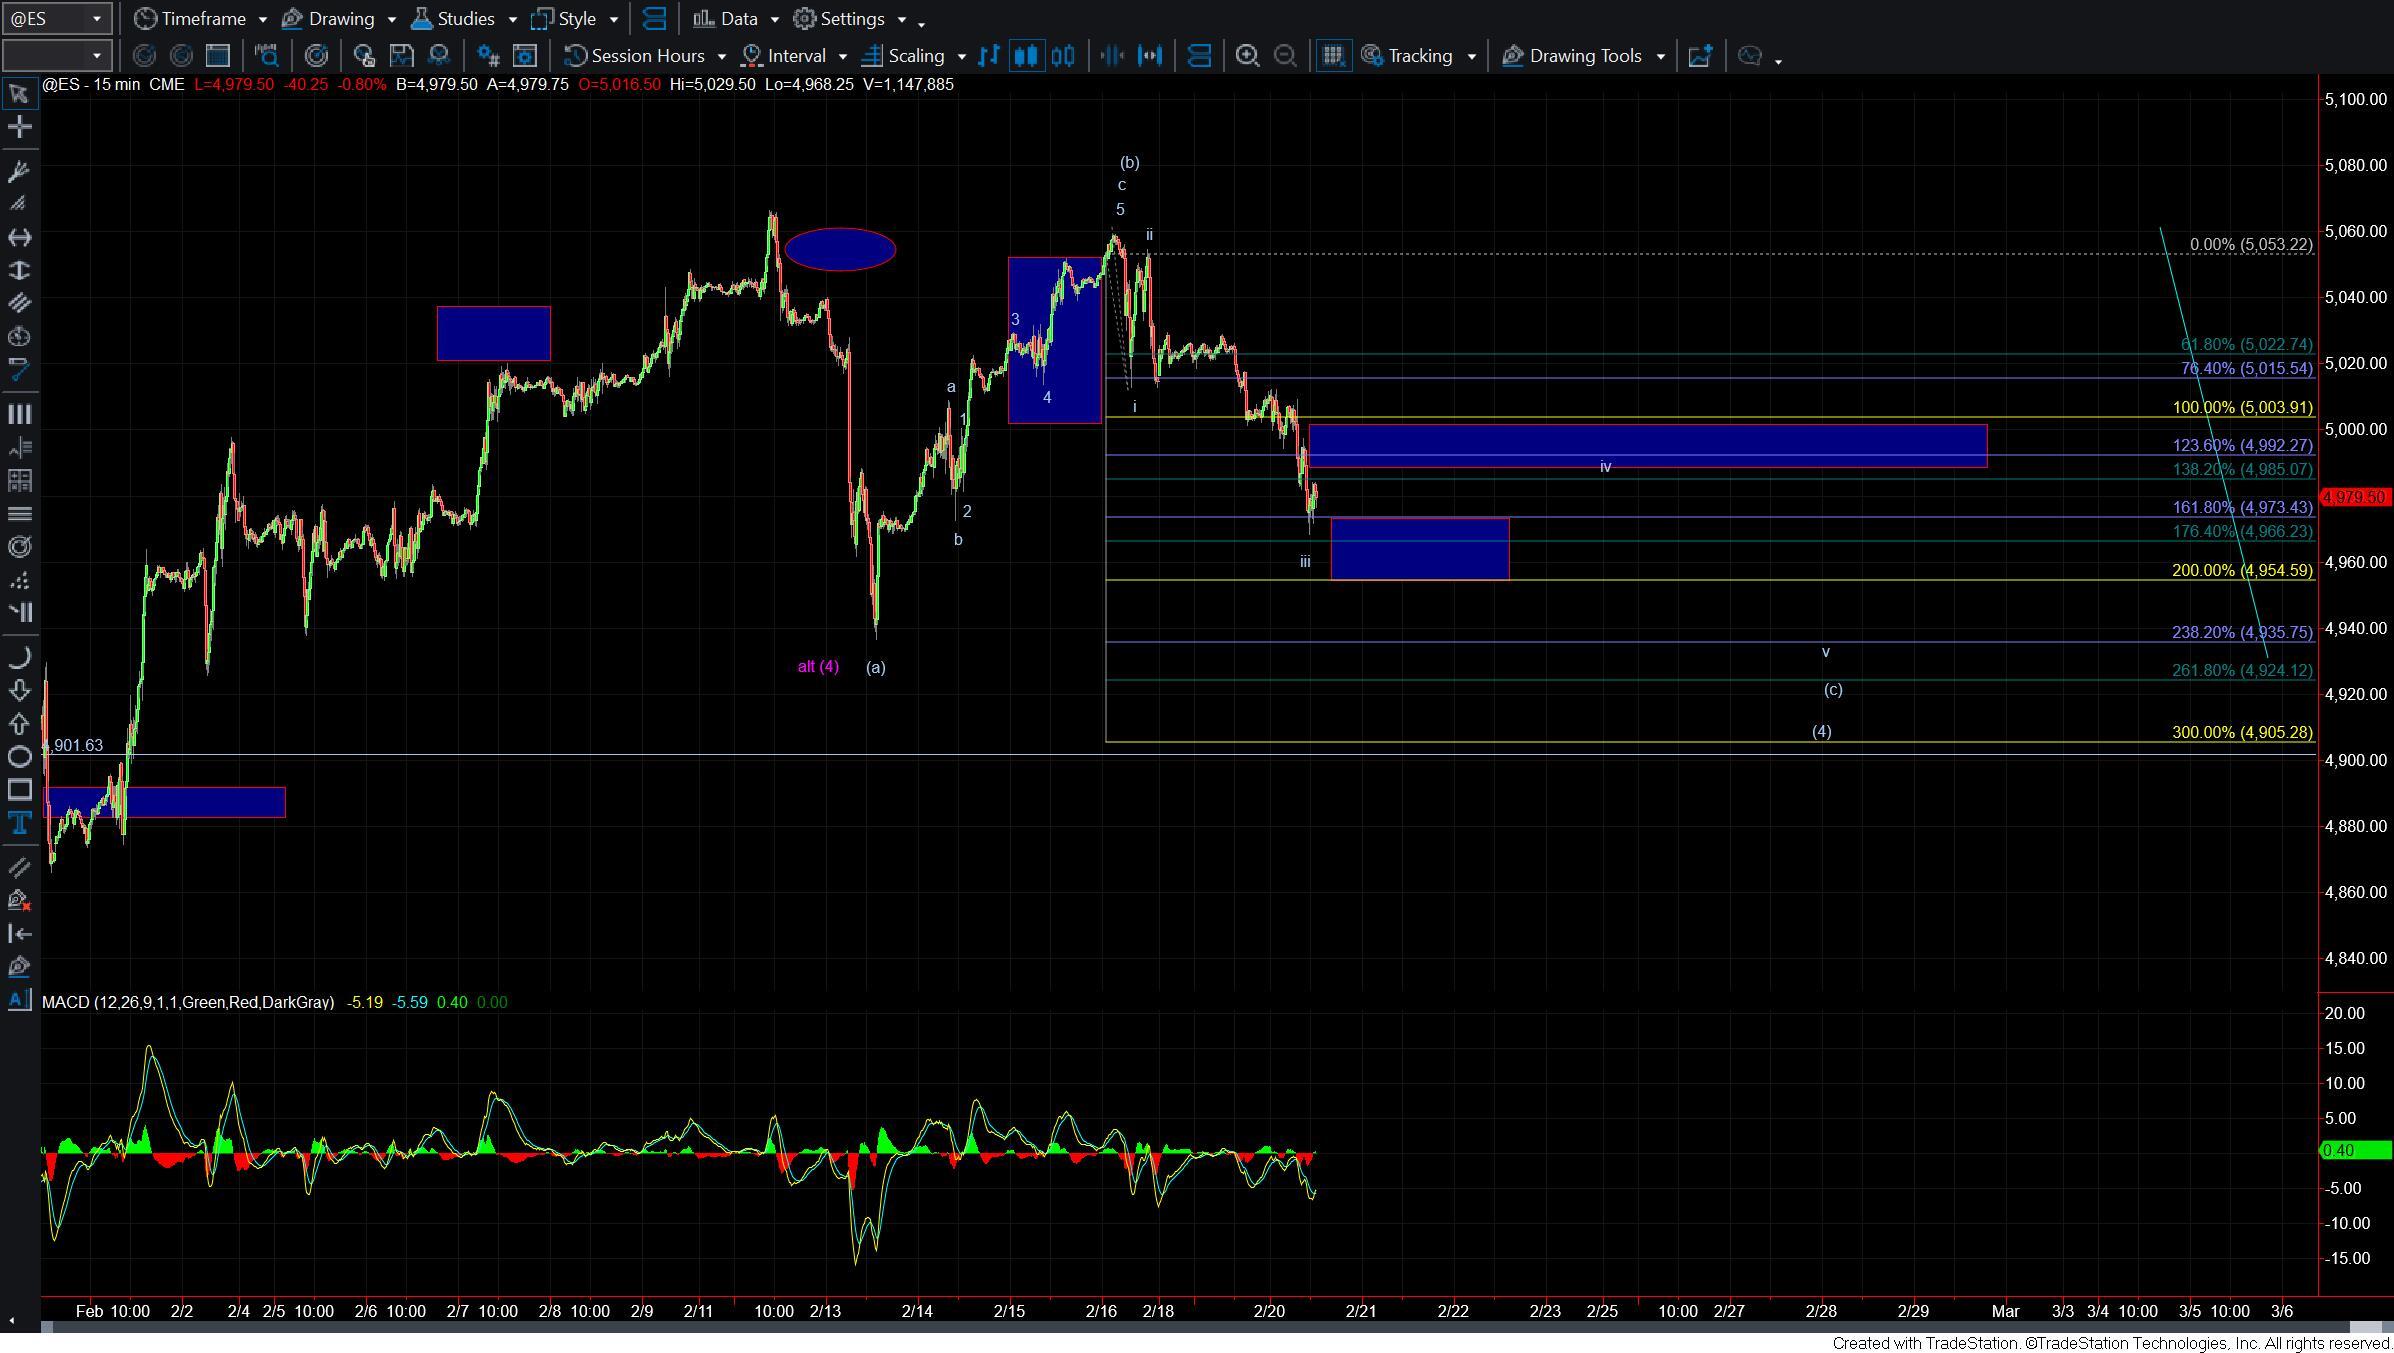
Drilling down to the 5-minute ES chart it does appear that we are in the wave iii of the (c) of (4) down. Under this case, we are entering the wave iii target zone which comes in at the 4973-4954 zone. Overhead resistance comes in at the 4992-5003 zone and as long as we hold under that zone the near-term pressure remains down. The ultimate wave v of (c) targets should reside in the 4935-4924 zone which also has good fib confluence with the 100ext of the wave (a) of (4) down.
If we are unable to hold under the 5003 resistance level then it would open the door for this to still see another higher high before breaking down under the 4936 low. As of right now however and given the structure of the current wave action, I think it is far more likely that we will continue to see lower levels to finish off the wave (c) of (4).
So overall there is nothing too surprising about today's action and as long as we continue to remain under resistance we should see continued lower levels as we attempt to finish off this wave (4) over the next several trading sessions.