Have They Closed The Market?
With the market simply meandering today, there is really one point I need to add to the current analysis, which I made yesterday afternoon.
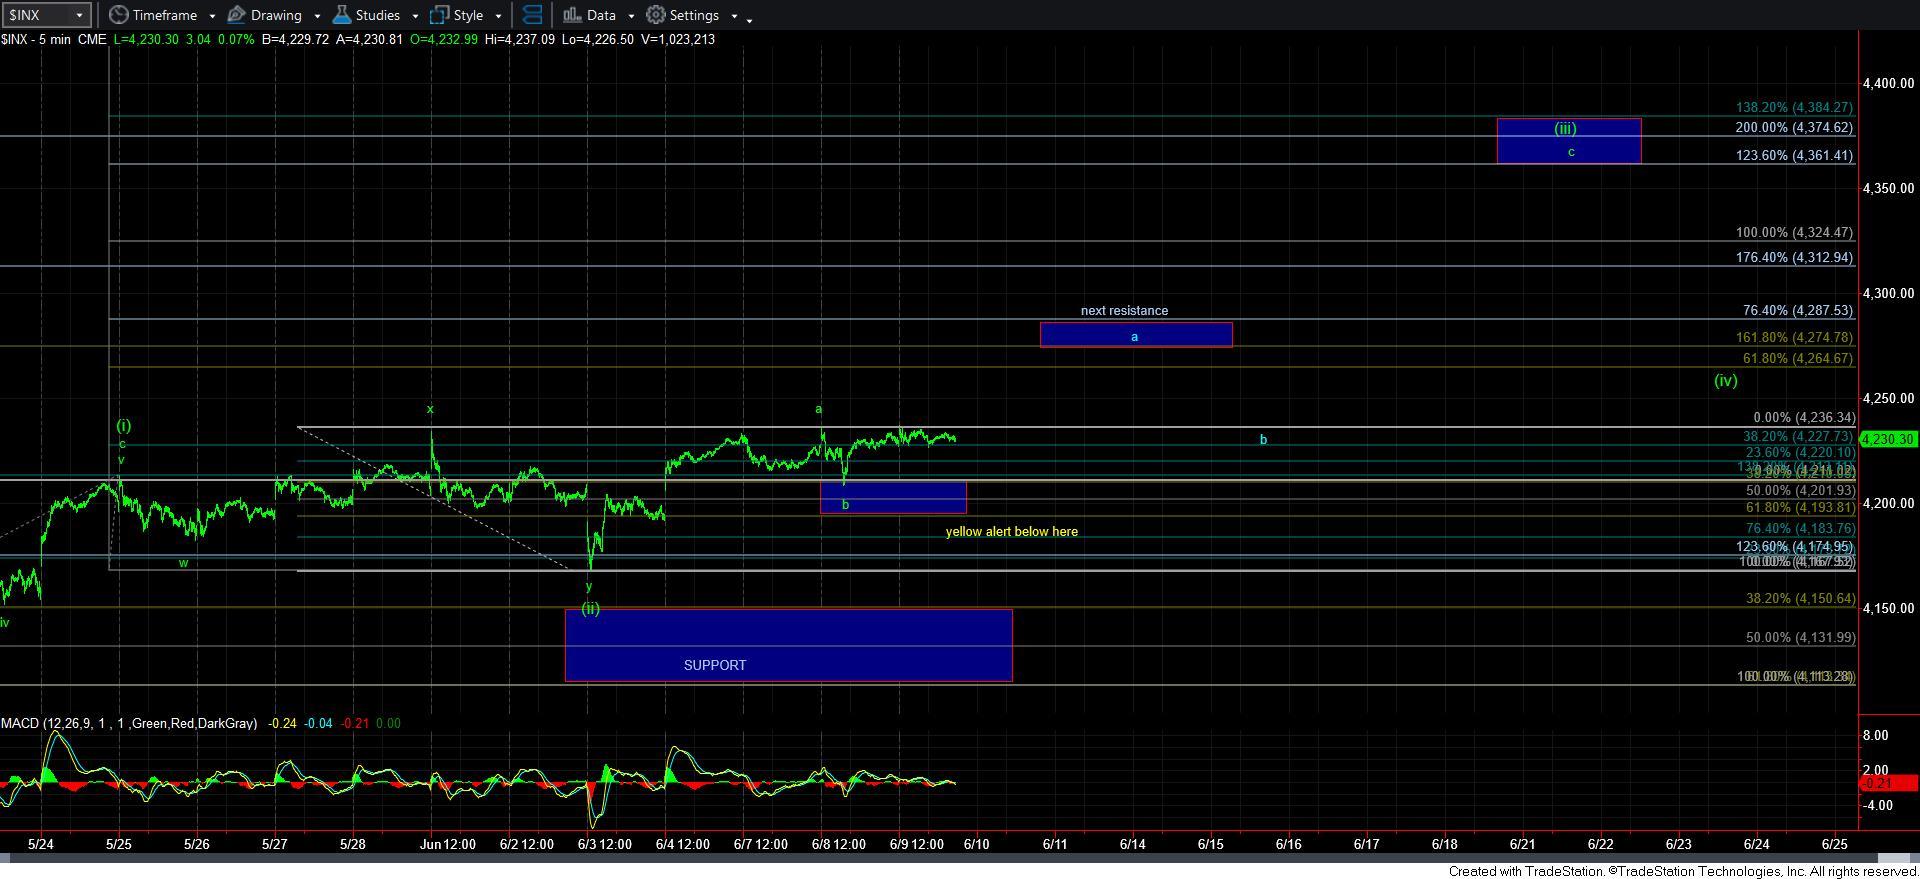
We have enough waves in place to consider a 5-wave rally has begun off yesterday’s low. That would suggest that the spike down may have completed all of the b-wave.
But, as I noted in several recent updates, I am not sure if the market has the juice to make it to the 4360SPX region in a direct fashion, as it would call for a relatively massive c-wave rally as compared to the a-wave. For this reason, I have added in the next resistance region, which can act as the top of a larger a-wave. So, as long as we remain below 4290SPX, it is entirely possible we get another pullback as presented by the blue b-wave, which would take us back to where we are today, and only then would be ready to rally to the 4360SPX region to complete wave [iii] within the ending diagonal I am tracking for wave v of 3.
This brings me to a new alternative count, which I presented this morning on the live video.
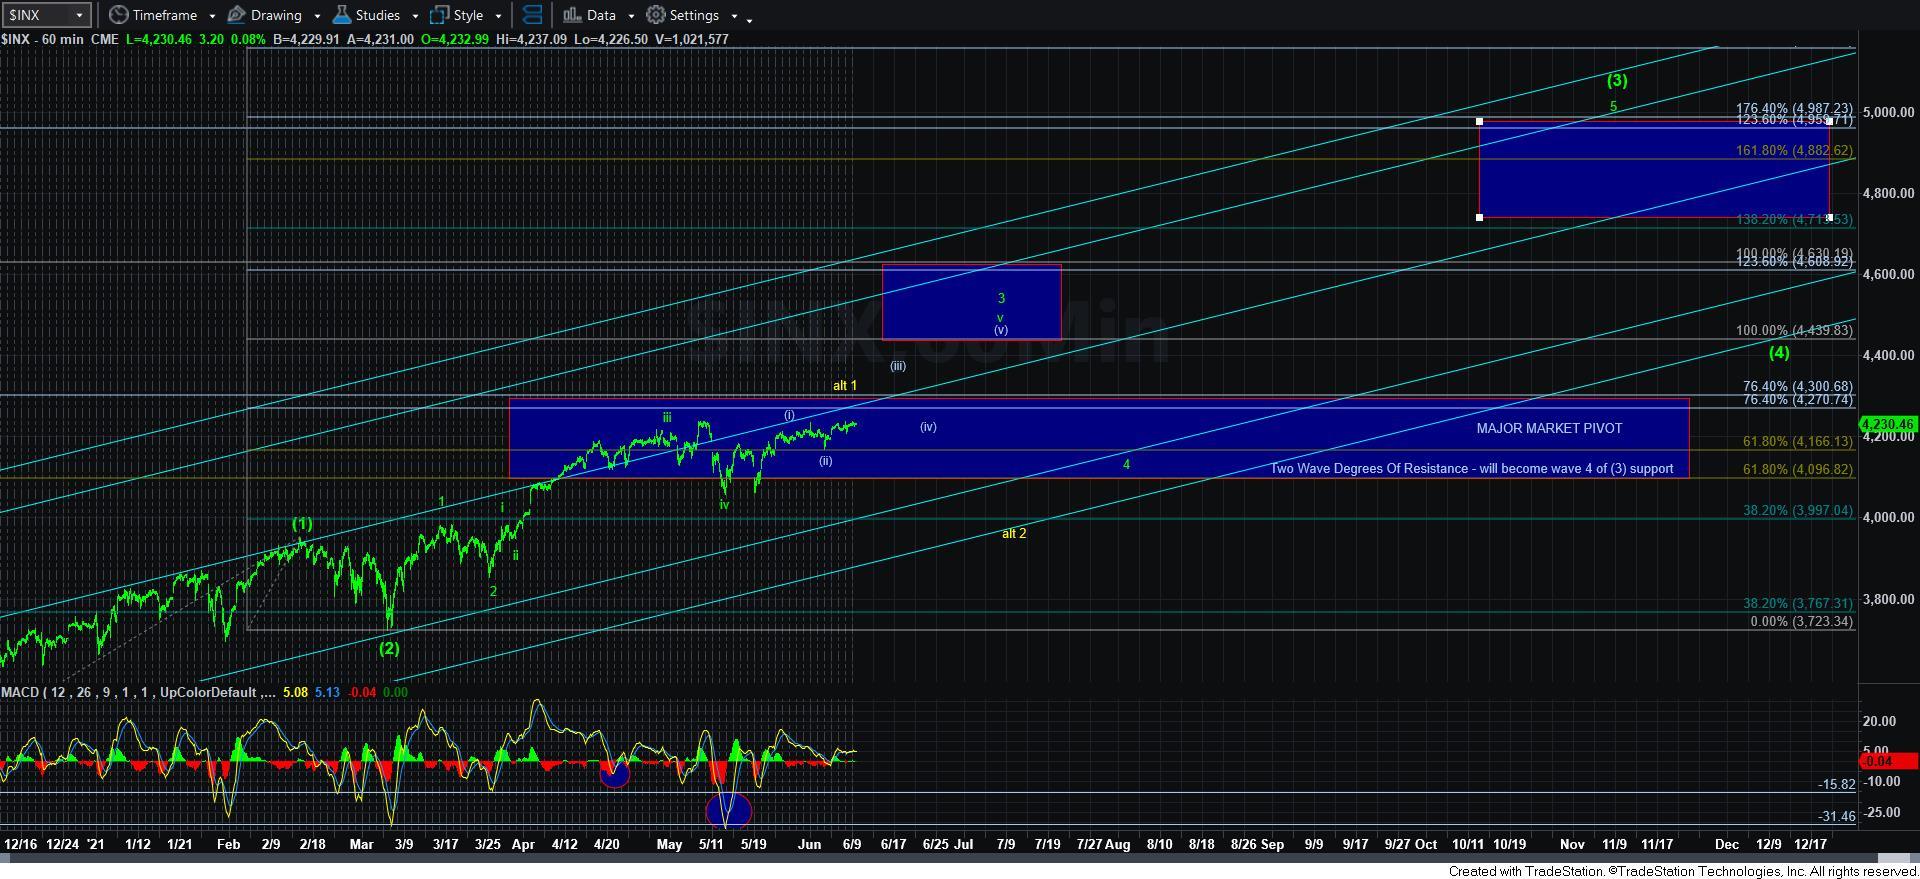
With a bigger wave [ii] now seemingly unlikely, and an alternative wave iv seeming even less likely, I have been struggling to come up with an alternative count. So, I took a look at the daily chart. And, from the “look” of it, it struck me that this looks like it can count as completing 5 waves up off wave [2]. Moreover, we have not yet been able to exceed the market pivot which represents the .618-.764 extension of waves [1] and [2]. Normally, the .764 extension is not often the target for a 1st wave, as we most often see it target the .618 extension. But, it is possible, though less common. And, with potential to count 5 waves up off the wave [2] low, this will now becomes my alternative count.
This alternative would suggest we are only now completing wave 1 of wave [3], with a return to the 4000SPX region being our wave 2. But, this will remain a very remote probability unless we have an issue exceeding 4300SPX in the coming weeks, and then break back down below 4190SPX instead. A break of 4190SPX is a warning shot to the immediate bullish potential.
But, fear not. Even if the alternative does play out, it would project waves 3, 4 and 5 as taking us all the way to the 5000SPX region either later this year or early next year in order to complete wave [3]. In other words, it would place our target for wave [3] right at the top of the target box that I have had for months on the 60-minute chart.
So, for now, as long as the market remains over yesterday’s low, then we have a set up to target our next resistance region in the 4270SPX region. And, how the market develops into that resistance will tell us if we have a larger a-wave top or not.
As I have mentioned many times now, the structure is not incredibly clear with all this overlap up here. So, I am taking this one step at a time. Overall, I am still quite bullish for the latter part of 2021. The only issue I have right now is if our next big pullback will be wave 4 of [3] potentially seen next month, or if we begin a wave 2 pullback in yellow sooner rather than later. Under either case, I think the market is going to give us some whipsaw before we are ready to set up to attack the 4600+ region later this year.