Have The Bulls Dropped The Ball Again?
It was quite disappointing to see the bulls fail today when they had a window of opportunity. As I noted over the weekend, they had today to do it, and have completely failed on the immediate term.
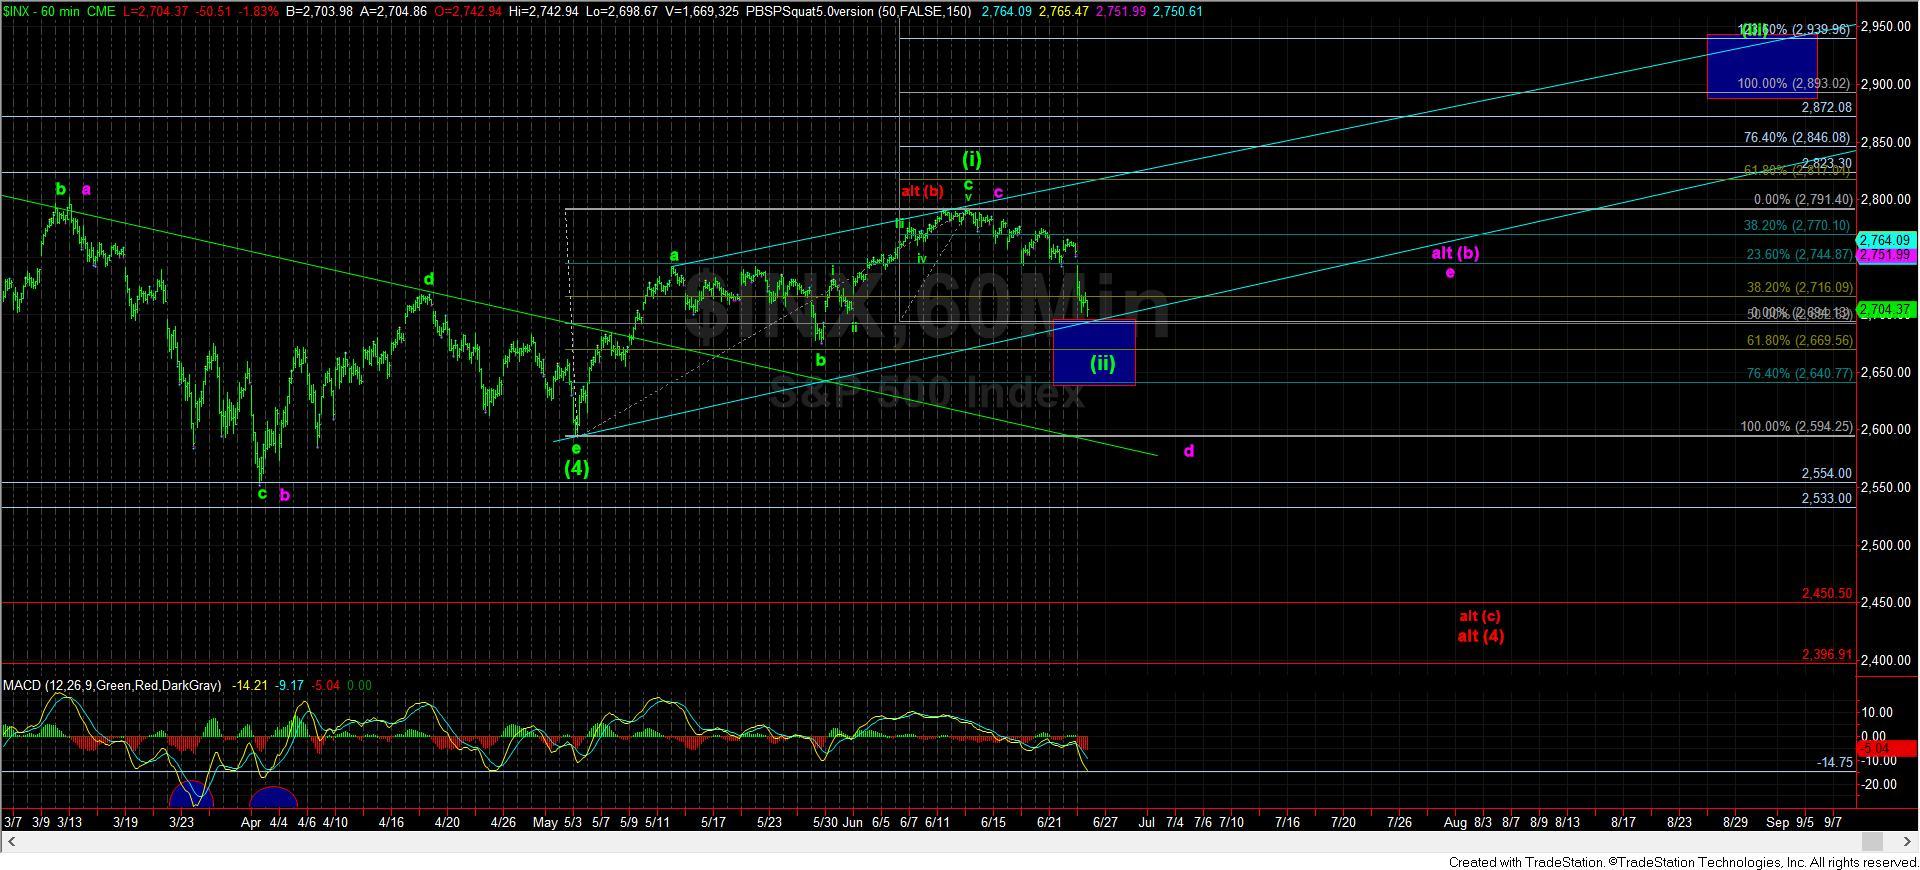
As I also have noted, a break below 2720SPX opens up even further complexity to this market. So, in addition to a questionable completion of a 4th wave in the SPX, we now have overlapping structures which really do not leave us with a solid impulsive count.
This leaves me with what was the alternative in yellow, which seems to fit the IWM and DOW better for an impulsive structure, assuming wave (4) has completed. But, the issue is that this may suggest that this wave (5) to 3000 is developing as an ending diagonal. While having an ending diagonal develop as a completion to a very long-term trend is a nice way to prepare for the impending reversal down the road, it makes trading to those eventual highs quite treacherous and choppy. Even so, this wave (ii) of an ending diagonal has support all the way down to the 2640SPX region, again, which allows for a significant amount of choppiness within large ranges.
The other potential pattern that I have to take a bit more seriously is a leading diagonal off the April lows, which Zac has been following for some time. As you know, I don’t view leading diagonals as high probability patterns, but with the added complexity with which we will now have to grapple, I have to at least consider the potential for the leading diagonal based upon how the market plays out in the coming weeks. But, since that structure still needs a higher move to 2800+ and then another retracement down to 2700 or even lower, I would rather consider the more immediate bullish potentials as more primary so as to not be left behind should we begin to run to 3000 sooner rather than later.
Due to the lack of a solid impulsive structure in the SPX, I am even still considering that we may be within a (b) wave triangle, still within wave (4). Again, I view this as a lower probability at this time, but should the purple count fill out as shown, it would be a strong warning for a (c) wave down to come.
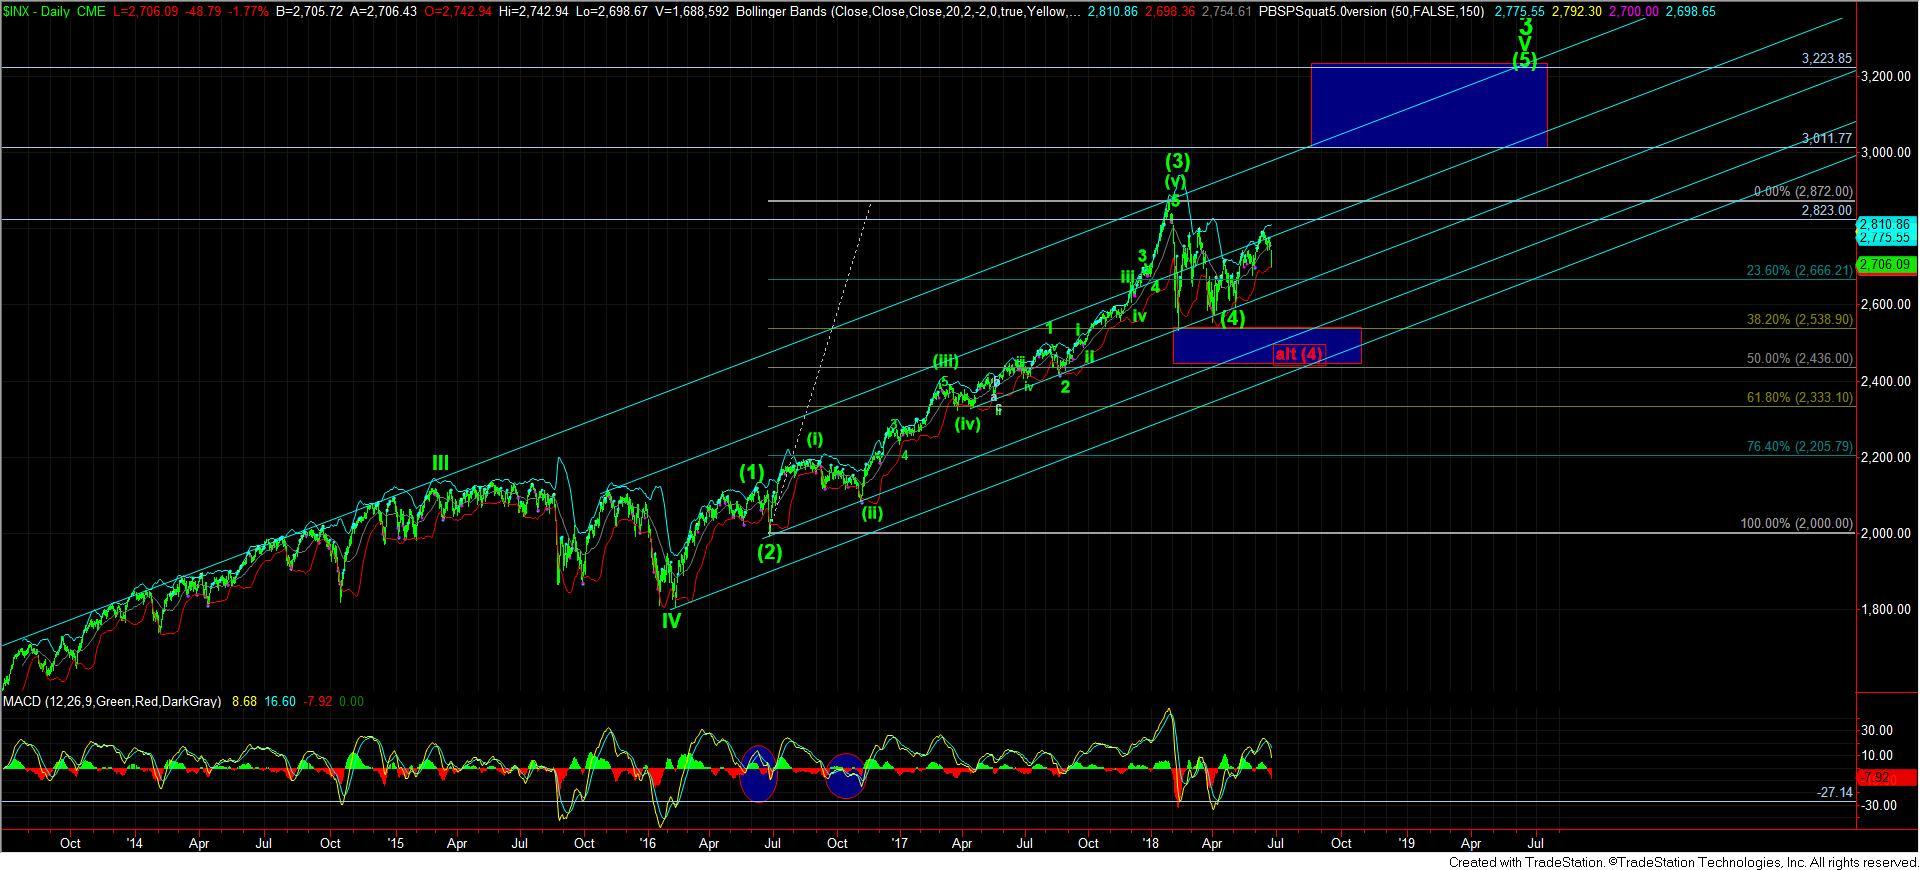
Lastly, I have to at least highlight the red wave count with a deeper (4), which has been left on my daily chart, but which really has not been highlighted on any other charts. The main reason is that I had believed that the probability for such a pattern to play out had been seriously reduced due to the turn down at the .764 extension rather than from the 2823SPX region. While I still think that this potential is still a lower probability at this point in time, if we were to see another follow through day like today which breaks us below 2640SPX, it would certainly make it a much higher probability, and have me consider it as the primary count. But, as I said, for now, I am just highlighting the potential, but have not viewed it as a higher probability just yet.
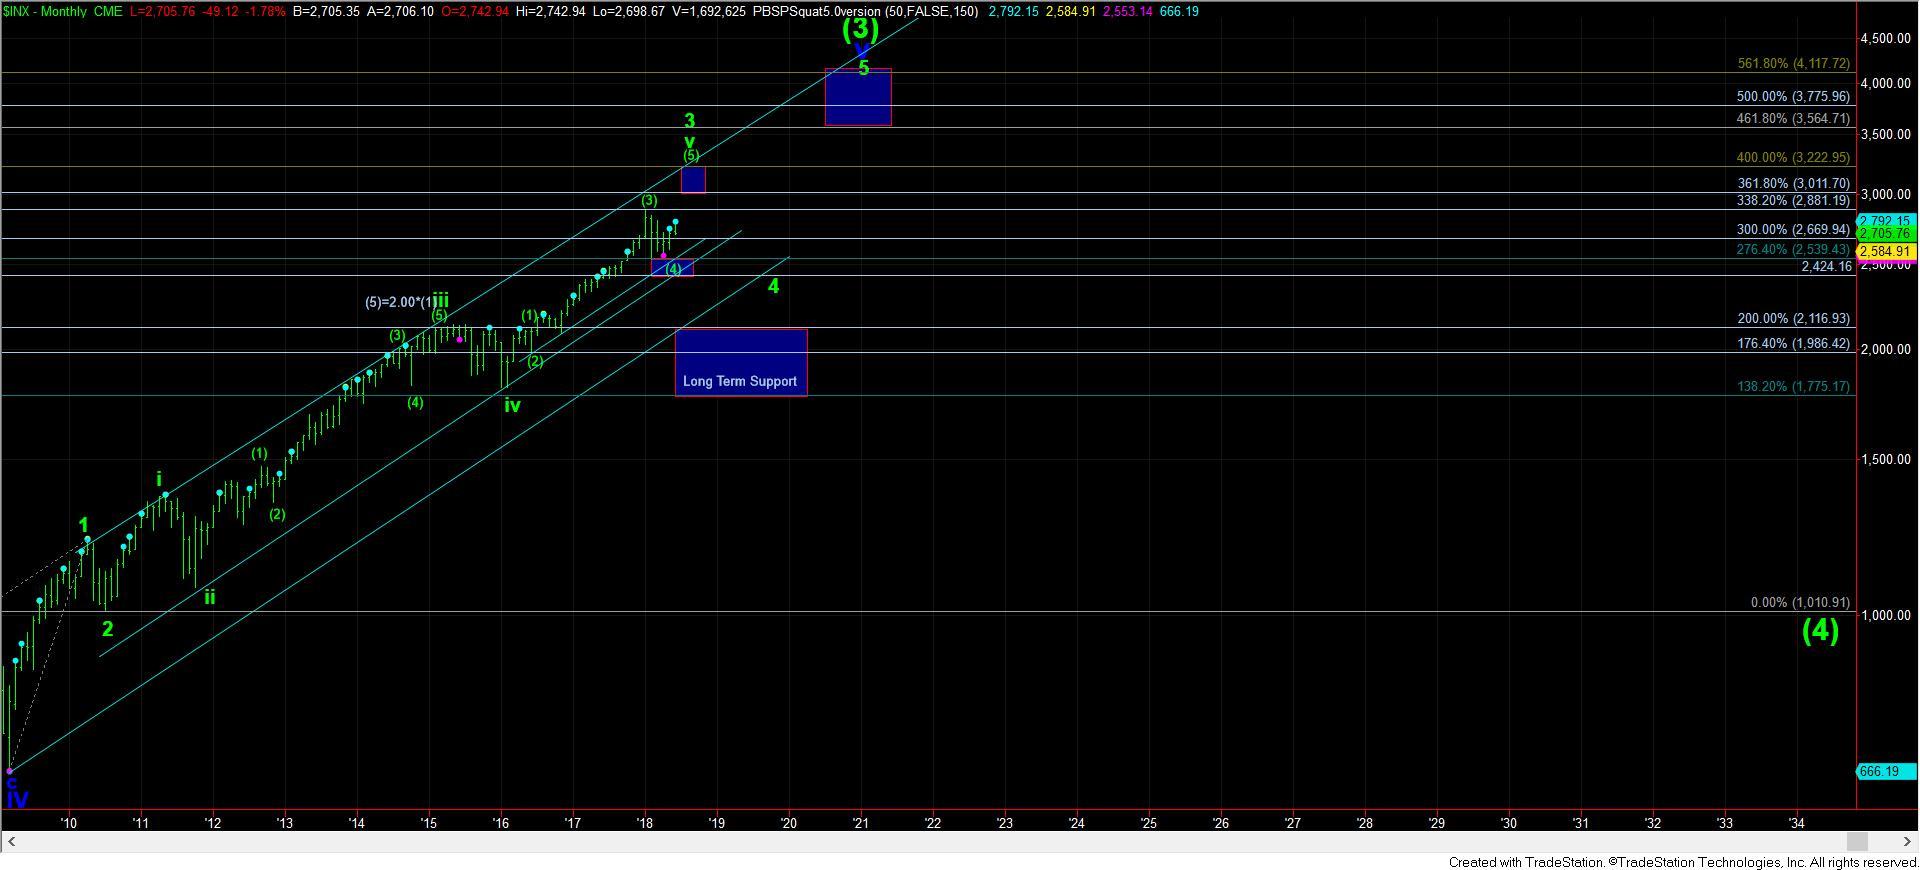
At the end of the day, the bulls did not take a strong stand today when they could have shut the bears out until 2019. So, it has placed us in a more precarious position, with much more added complexity, as we feel out which pattern will be taking us up to the 3000 level before we strike a top that will usher in that 20-30% correction we expect into 2019. At this point in time, I am focusing upon the modified green count, which was my alternative until today.