Has The Next Bullish Uptrend Begun?
 By
Avi Gilburt
There is a lot to discuss in this evening update, so take your time when reading through it.
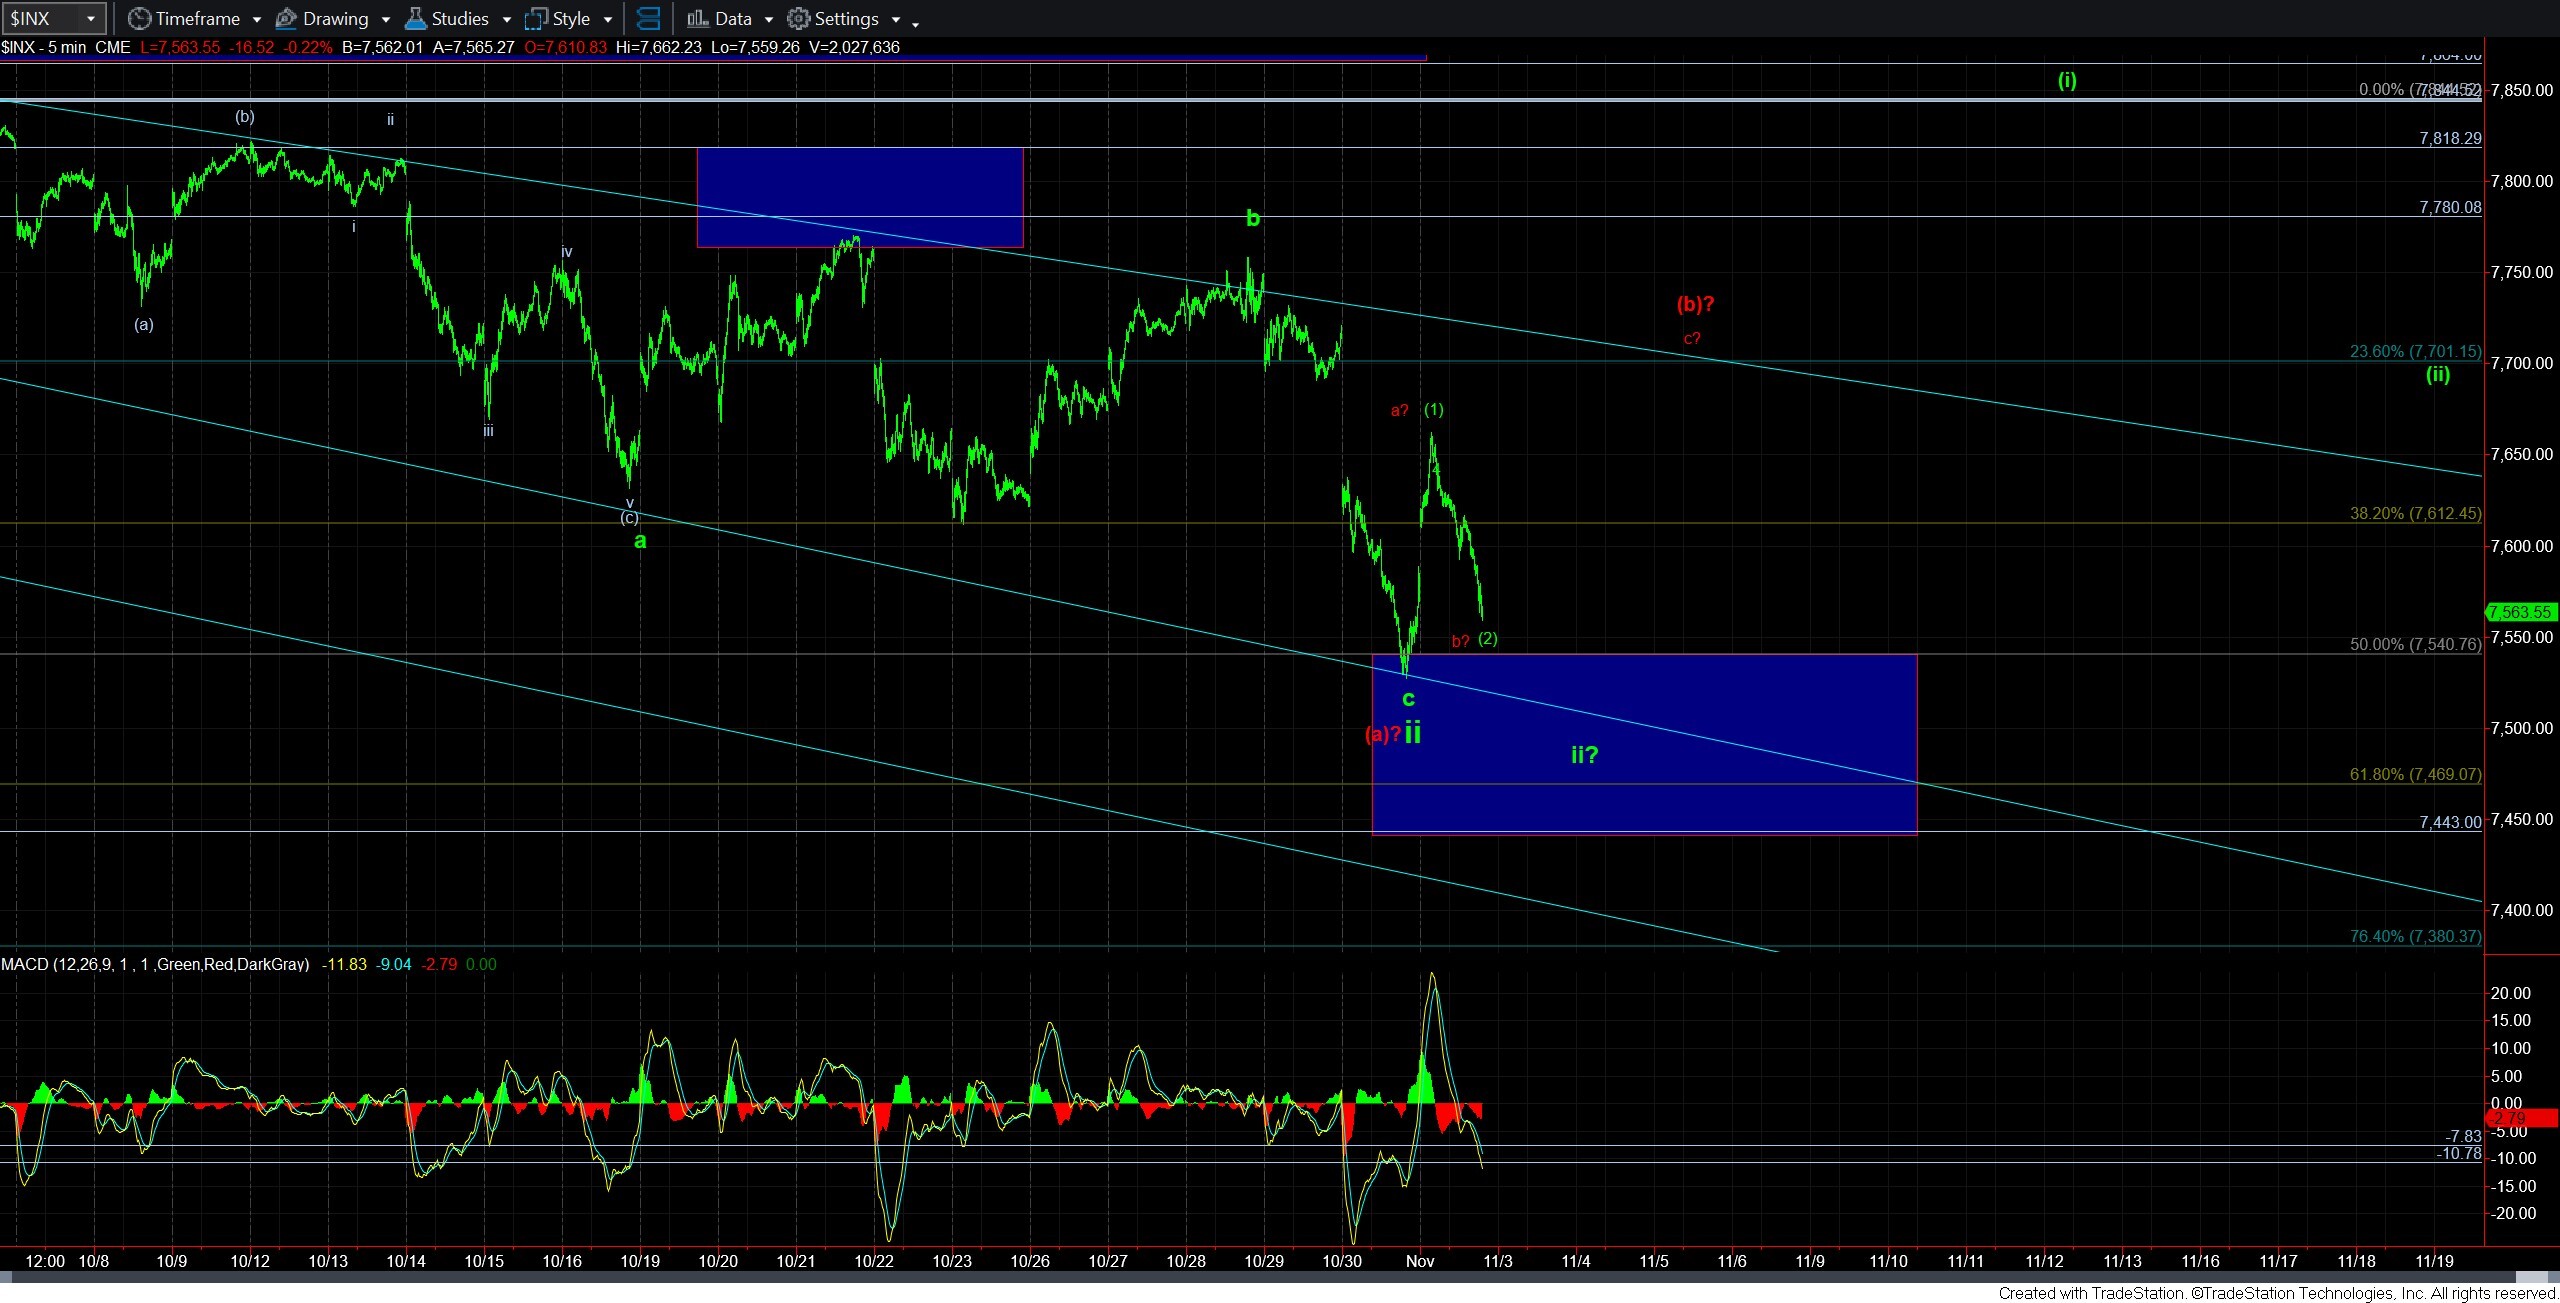
First, even though the market has moved through initial resistance to suggest this bounce is more than a 4th wave, I cannot help but keeping that potential in the back of my mind, with another lower low to be seen to complete the c-wave down. But, in order for that to be the case, then the rally into today’s high would be an a-b-c structure wherein the c-wave is equal to .618 the size of the a-wave. But, that is relatively rare, so it forces me to assume that the bottom of the c-wave has indeed been struck.
Yet, please keep that alternative in the back of your mind despite it not being on the chart other than the wave ii? on the SPX chart. When the market has begun a strong uptrend in the last two years, we really have not seen this deep of a retracement. So, I am just keeping this option in the back of my mind for now.
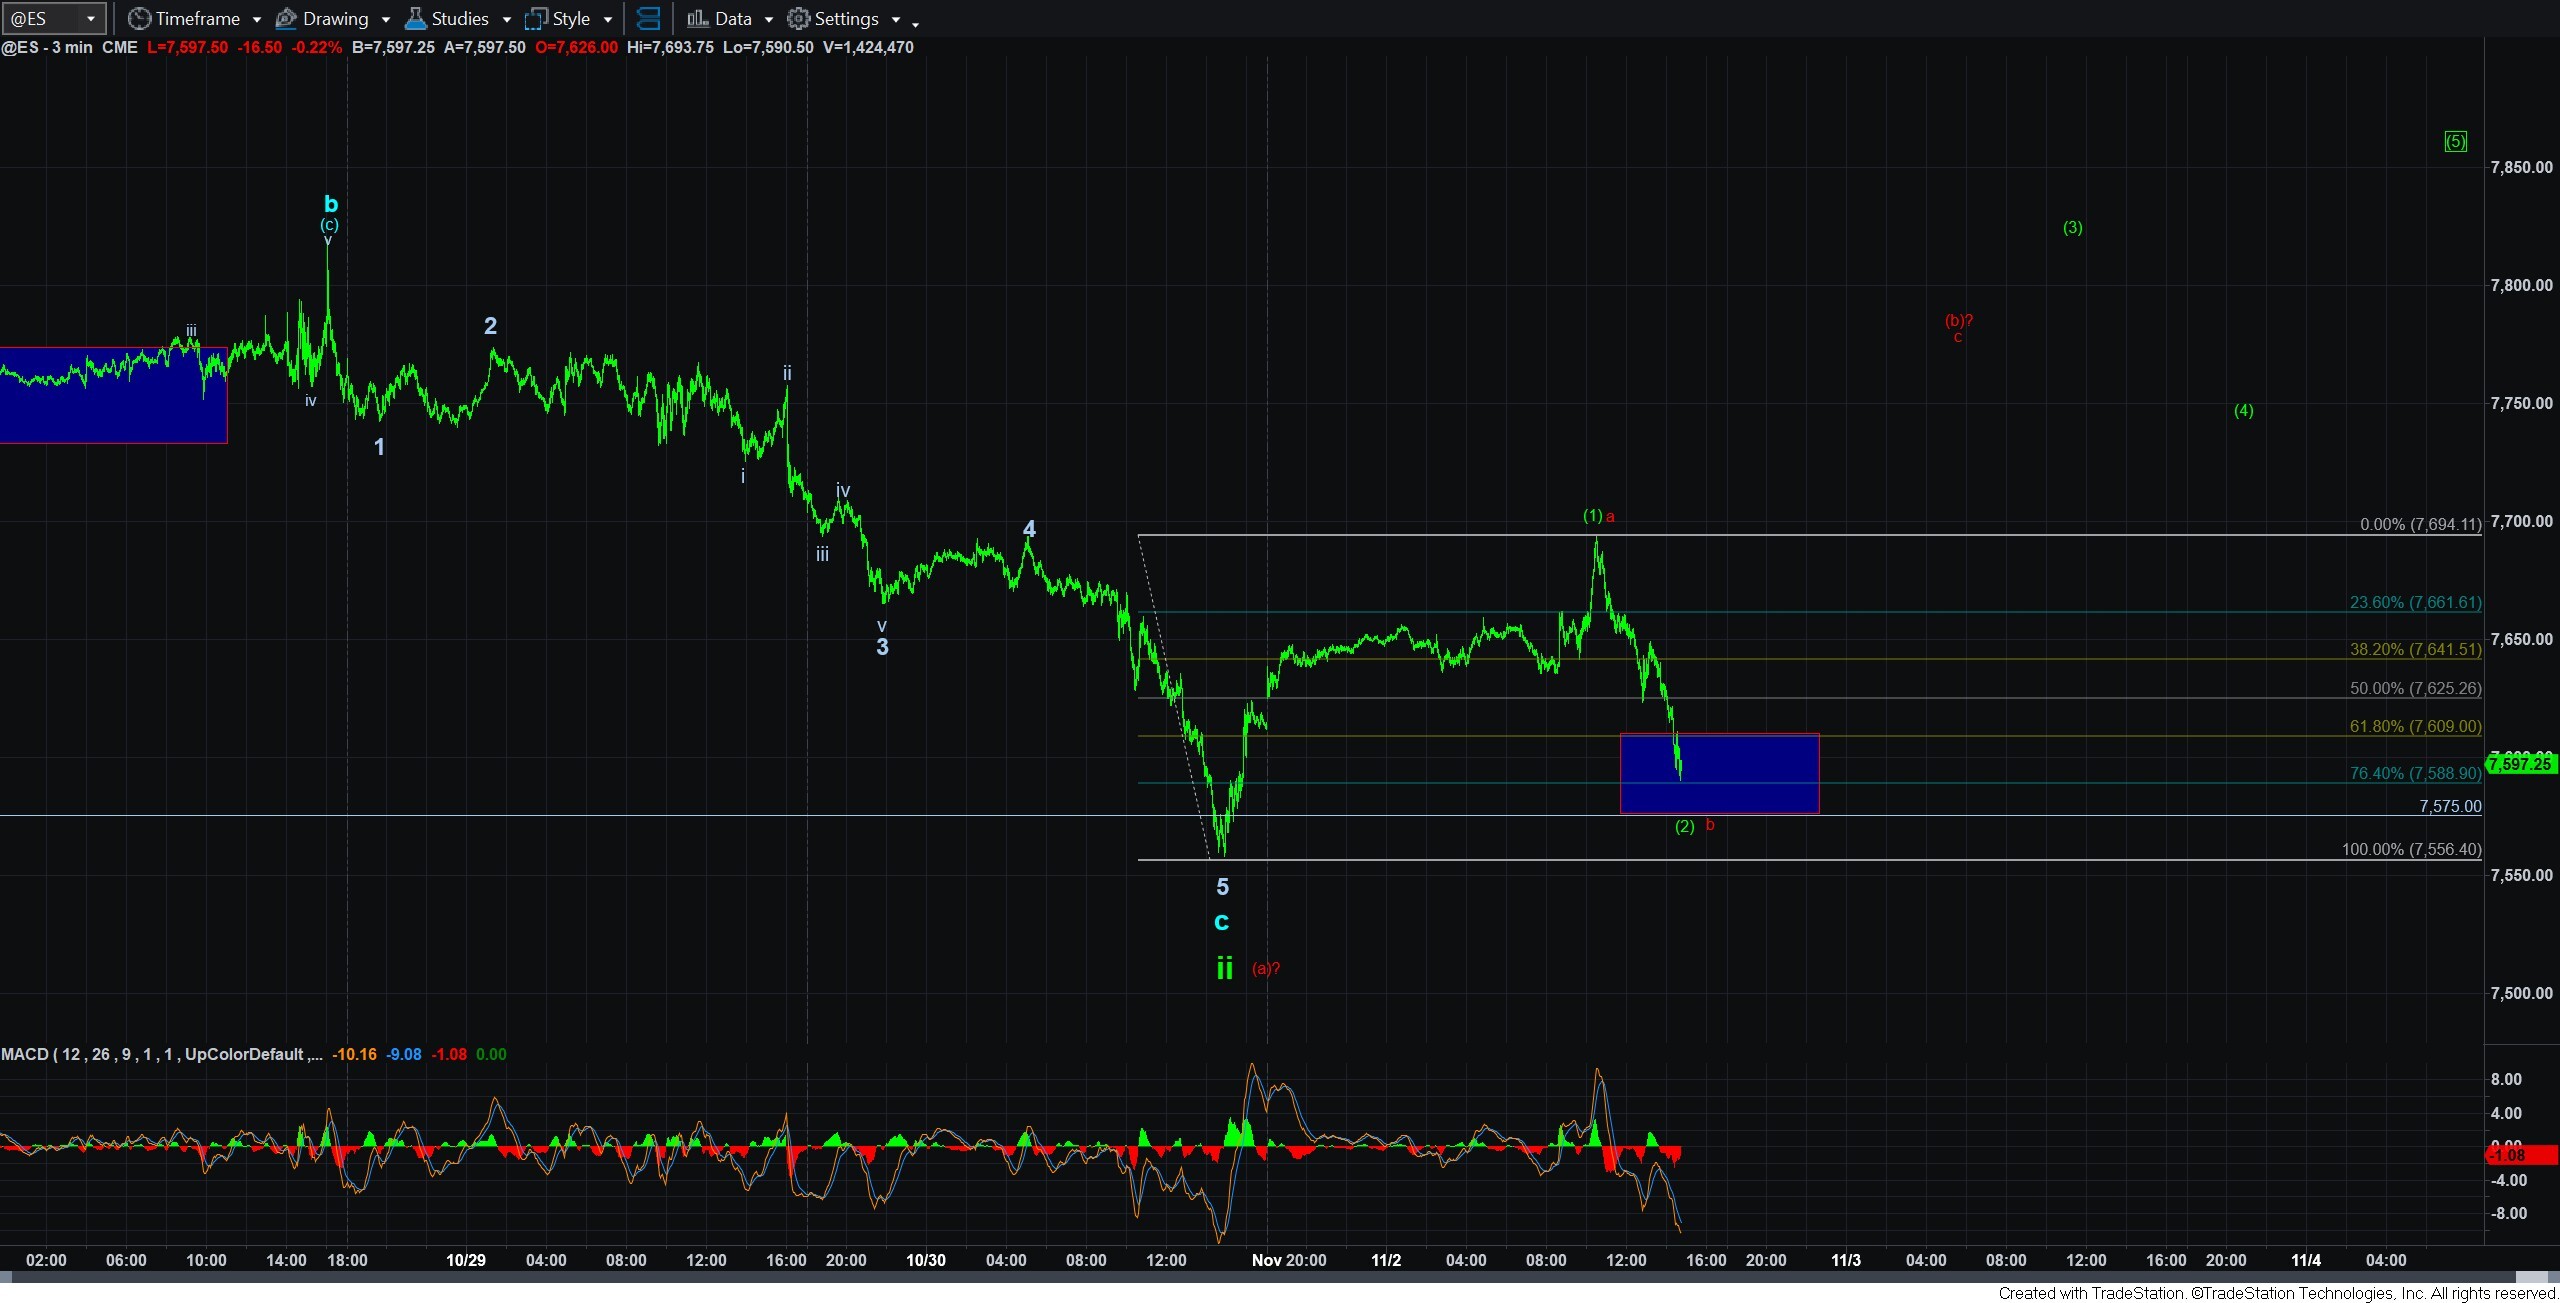
This also reminds us of the issues we had between the ES and SPX, wherein the SPX really looks better with one more lower low, whereas the low on Friday was enough to complete the c-wave in the ES. So, I am not 100% convinced that this issue has been settled. Yet, if the market begins an impulsive rally off the support box outlined on the ES chart, then we have something more to work with.
And, take note that the ES retracement box does go deeper than the standard .764 lower end of support with which I normally work due to the a=c off today’s high points to the lower end of the box. Of course, a break down below the bottom of that support box makes it highly likely that the c-wave for wave ii had not yet completed, as per the SPX wave structure.
This now brings me to the move higher. Assuming the box of support holds in the coming hours, then the next rally is going to be key to how we view the market in the coming months.
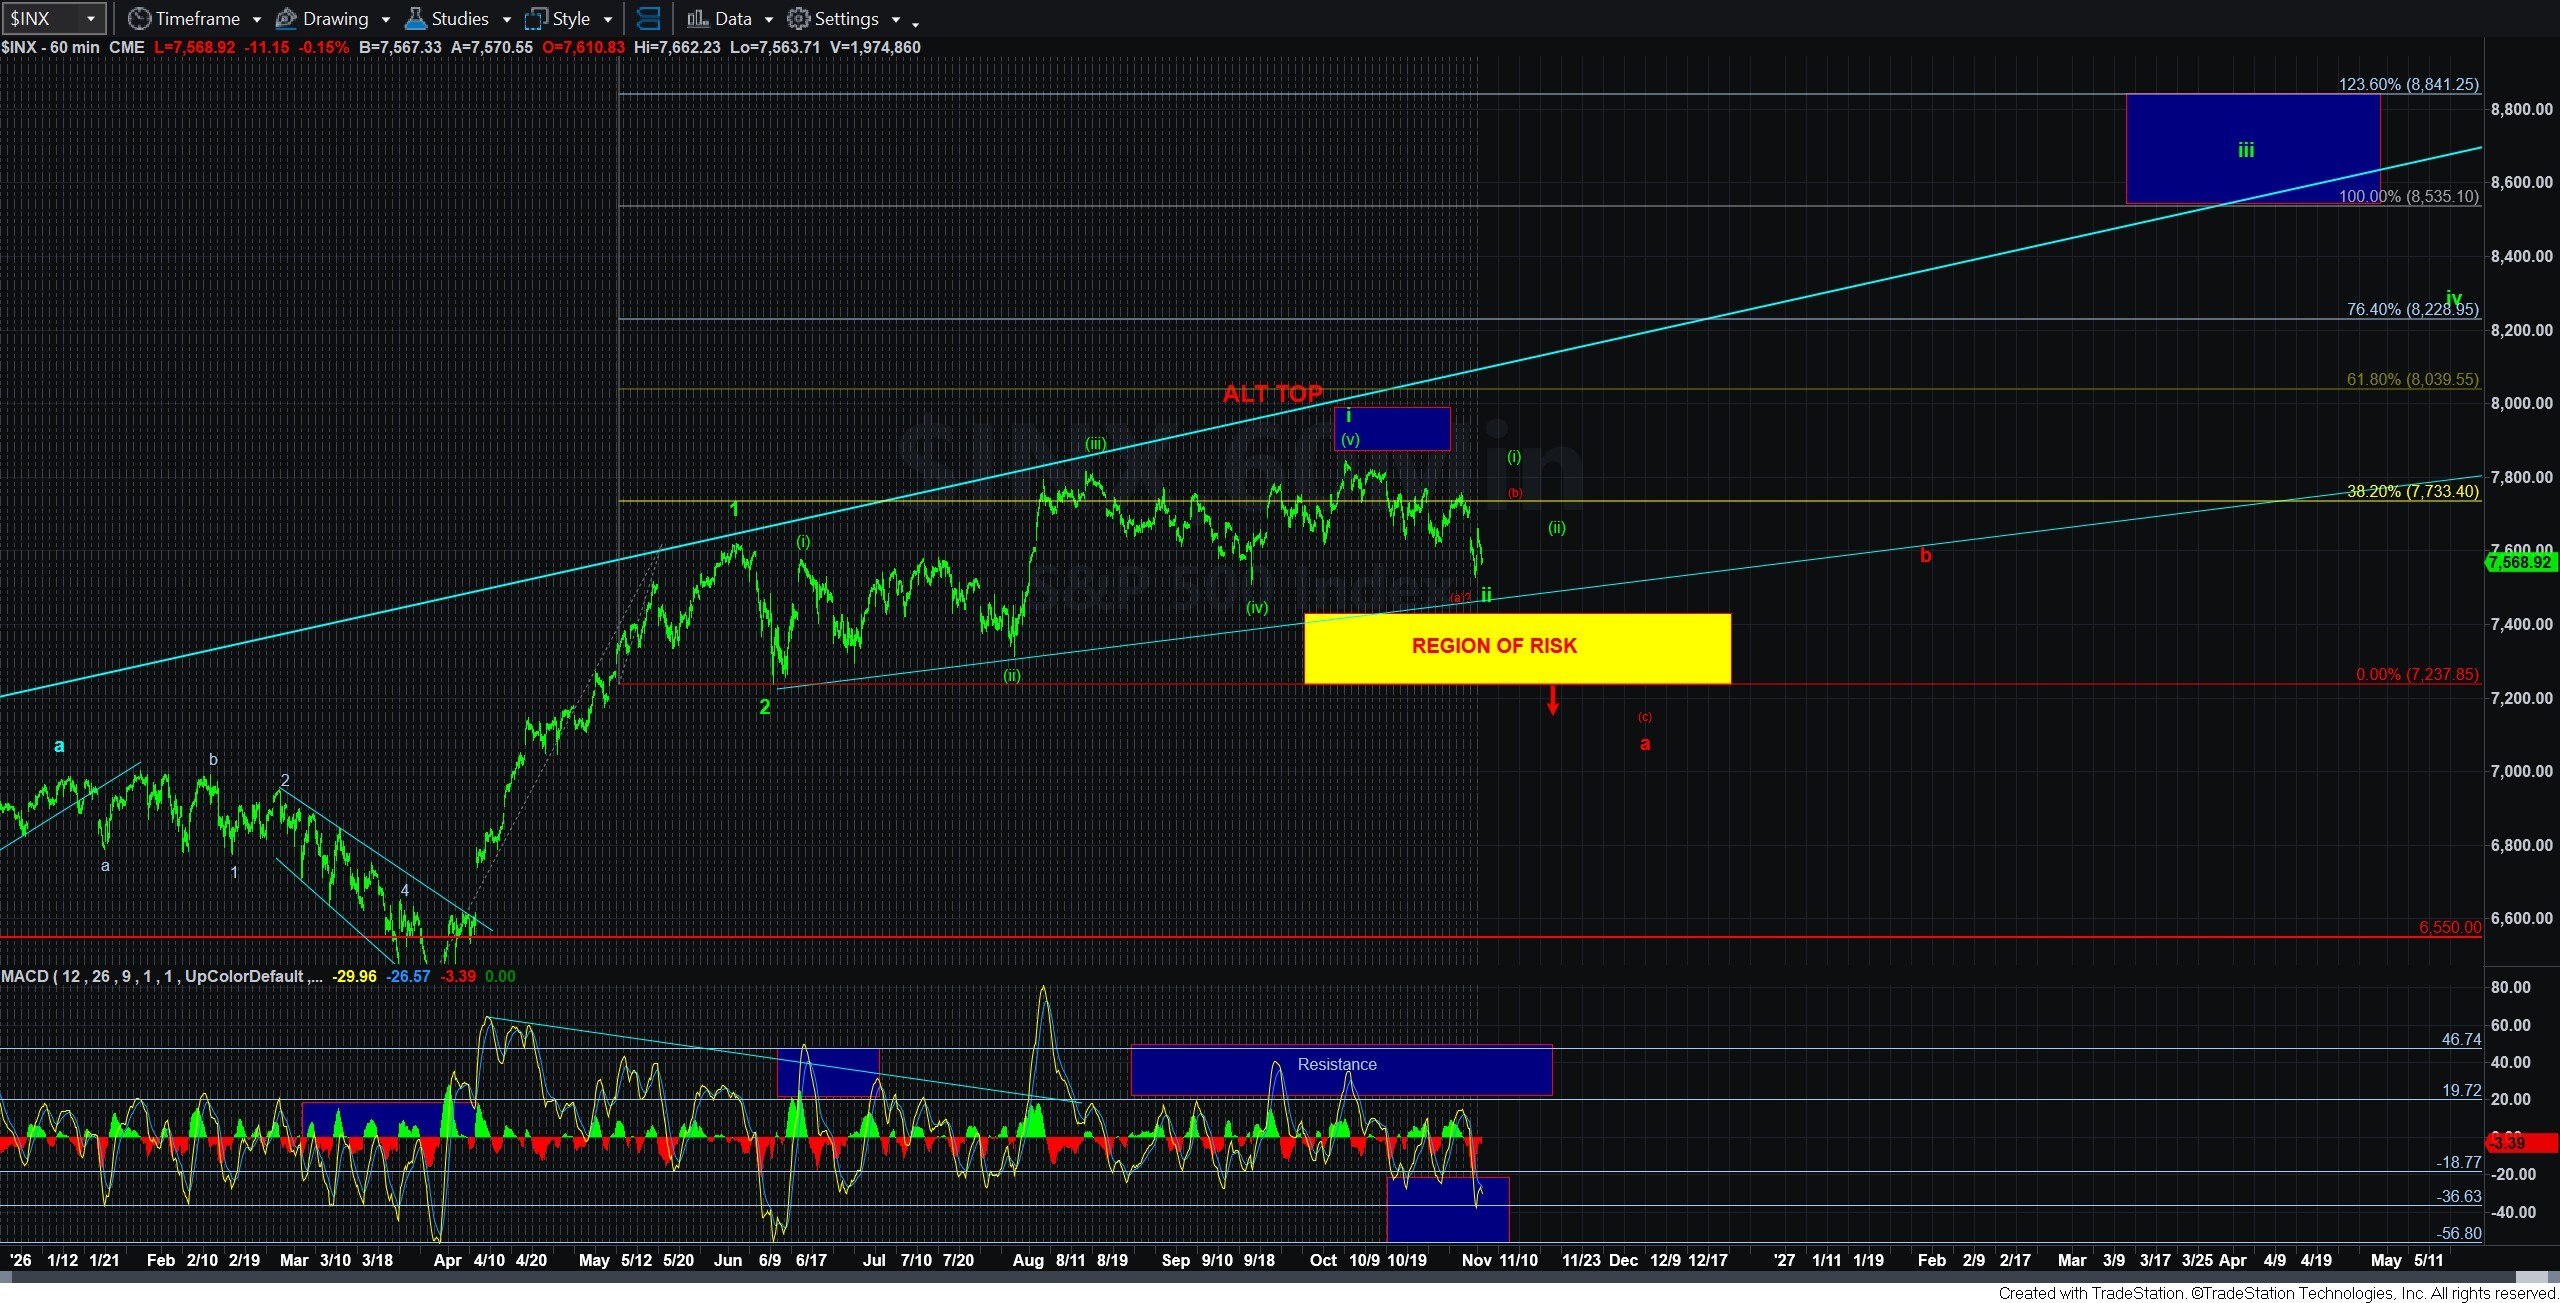
Should the market provide us with a nice 5-wave structure, as outlined in green, then that would complete wave (i) of iii of 3, and the wave (ii) would be a buying opportunity for a rally that should take us north of 8500SPX for just wave iii of 3.
However, if the market is unable to complete a 5-wave rally as shown in green, and we only reach the 1.00 or 1.382 extension and then come back down below the pivot in impulsive fashion, then we will have to contend with the red count again. (No, the pivot has not been added yet since we do not know where this pullback is going to bottom just yet).
Remember, this bull market is quite mature, and we have enough waves in place to consider a major top as having been struck. But, while we have not seen the type of reversal I would expect once an ending diagonal of this magnitude has completed, I have my doubts about the major top being in place yet, as I have mentioned a number of times before.
Of course, even if we do only see an a-b-c rally as per the red count (b) wave, it may also be a b-wave in a bigger green wave (ii). But, I am getting way ahead of myself right now. Yet, I do want to at least outline much of my thoughts as to how this can resolve in the coming week or two.
Remember, until we get a clear 5-wave rally for wave (i) of iii of 3, there is risk of which you must be aware and for which you must consider in your risk management plan.
So, for now, as long as the 7575ES level holds as support, I am seeking another rally in the coming days. Whether that rally completes a full 5-wave structure for waves (3), (4) and (5) of wave (i) or falls short, I am unable to opine as I am not a fortune teller or prophet as I cannot see the futures. I can simply give you the parameters that the market provides to me. And, if it continues to color between the bullish lines, then we have a set up for a major market rally as we look towards the end of this year and next.