Green a-Wave Pushing Lower
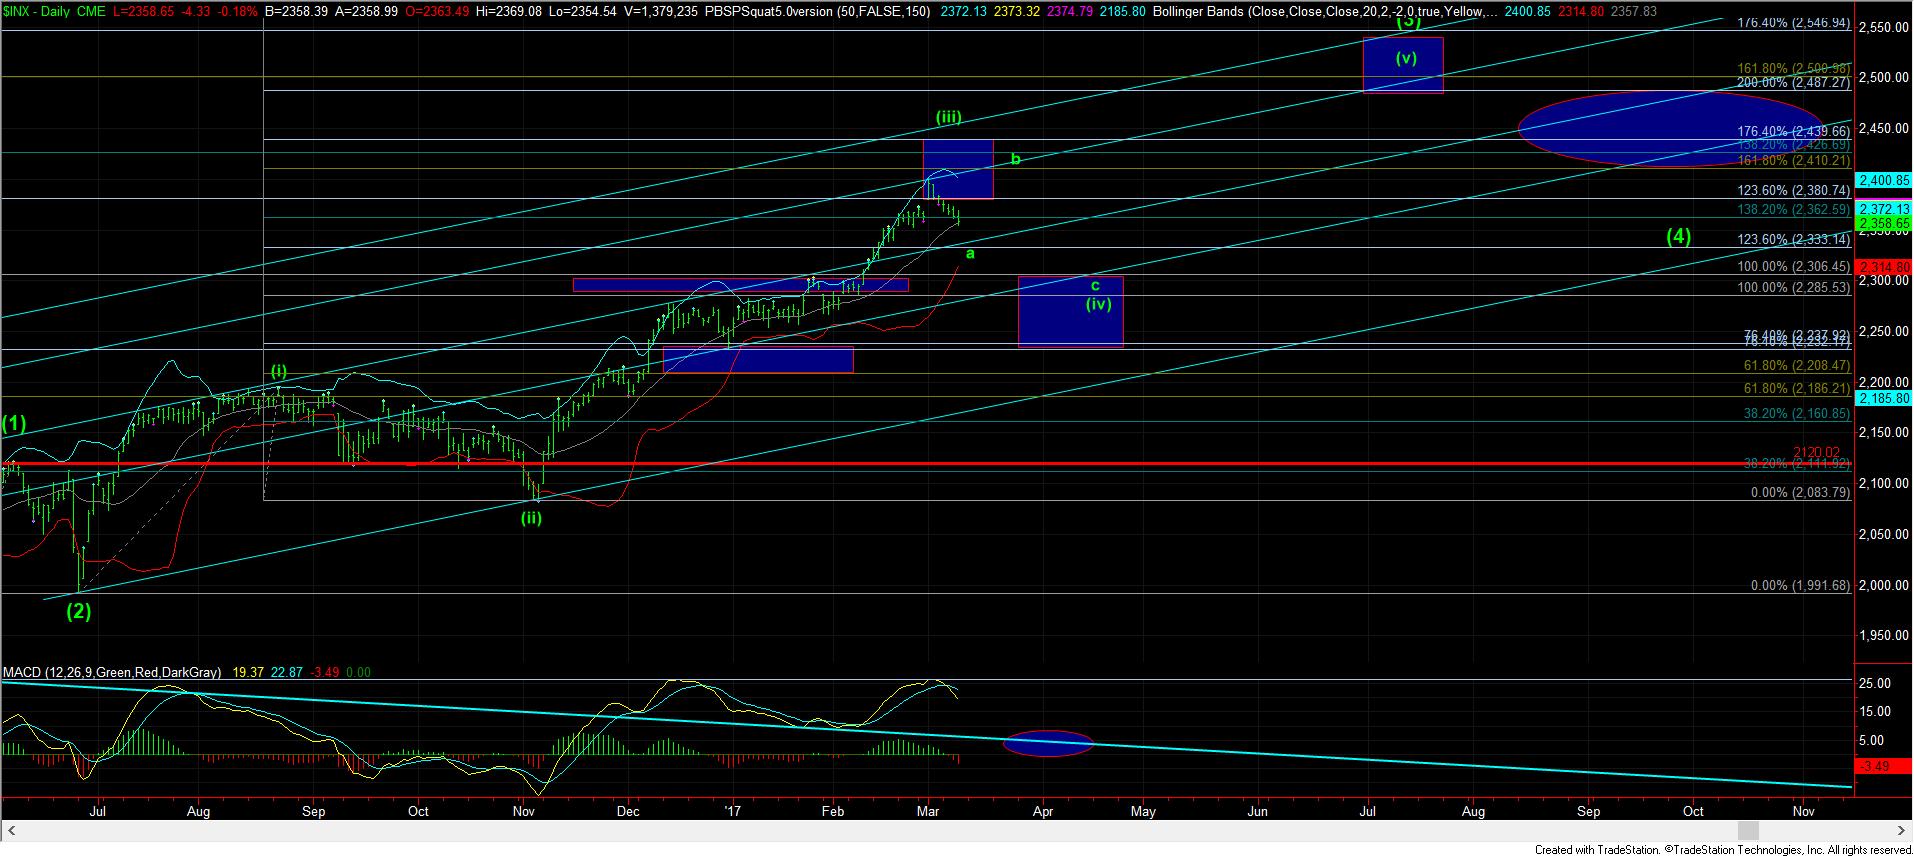
With the market dropping a bit more today, the a-wave down has now struck the middle Bollinger Band on the daily chart. Moreover, the bearishness that has developed from this small drop from the all-time highs may suggest that the a-wave may not get all the way down to our ideal target at the .236 retracement of wave (iii) in the 2335SPX region.
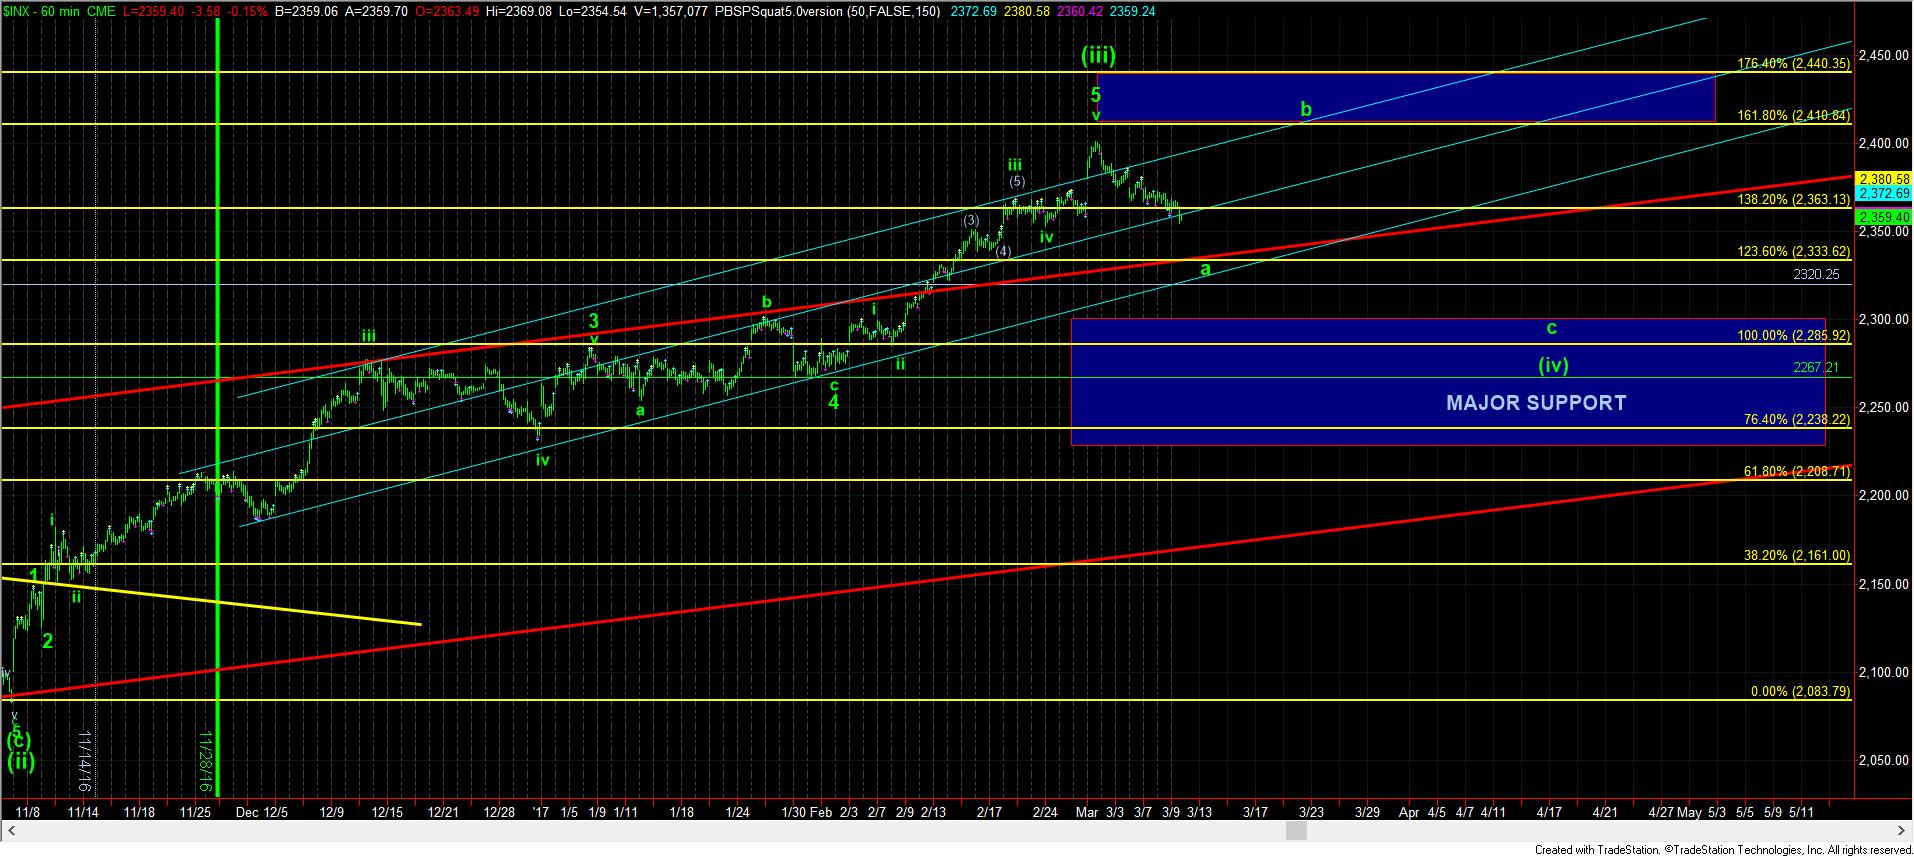
So, as I have noted many times, 4th waves present us with major whipsaw points, and usually chew up those trying to trade them. For now, we can begin a b-wave rally at any point from here and within 20 points lower. As I have also noted several times, when the wave (iii) fails to strike the appropriate Fib levels overhead – we came about 10 points short – then we may see a b-wave begin soon which will strike those higher levels later this month.
For those with a longer-term perspective, and are looking for an ideal entry for wave (v), while there are no guarantees we will correct to this degree, I would love to the see the MACD – which has now turned over on the daily chart – drop down to the ellipse I have highlighted on the chart.