Good News And Bad News
Since I cannot ask you which do you want first, I am going to give you the good news first.
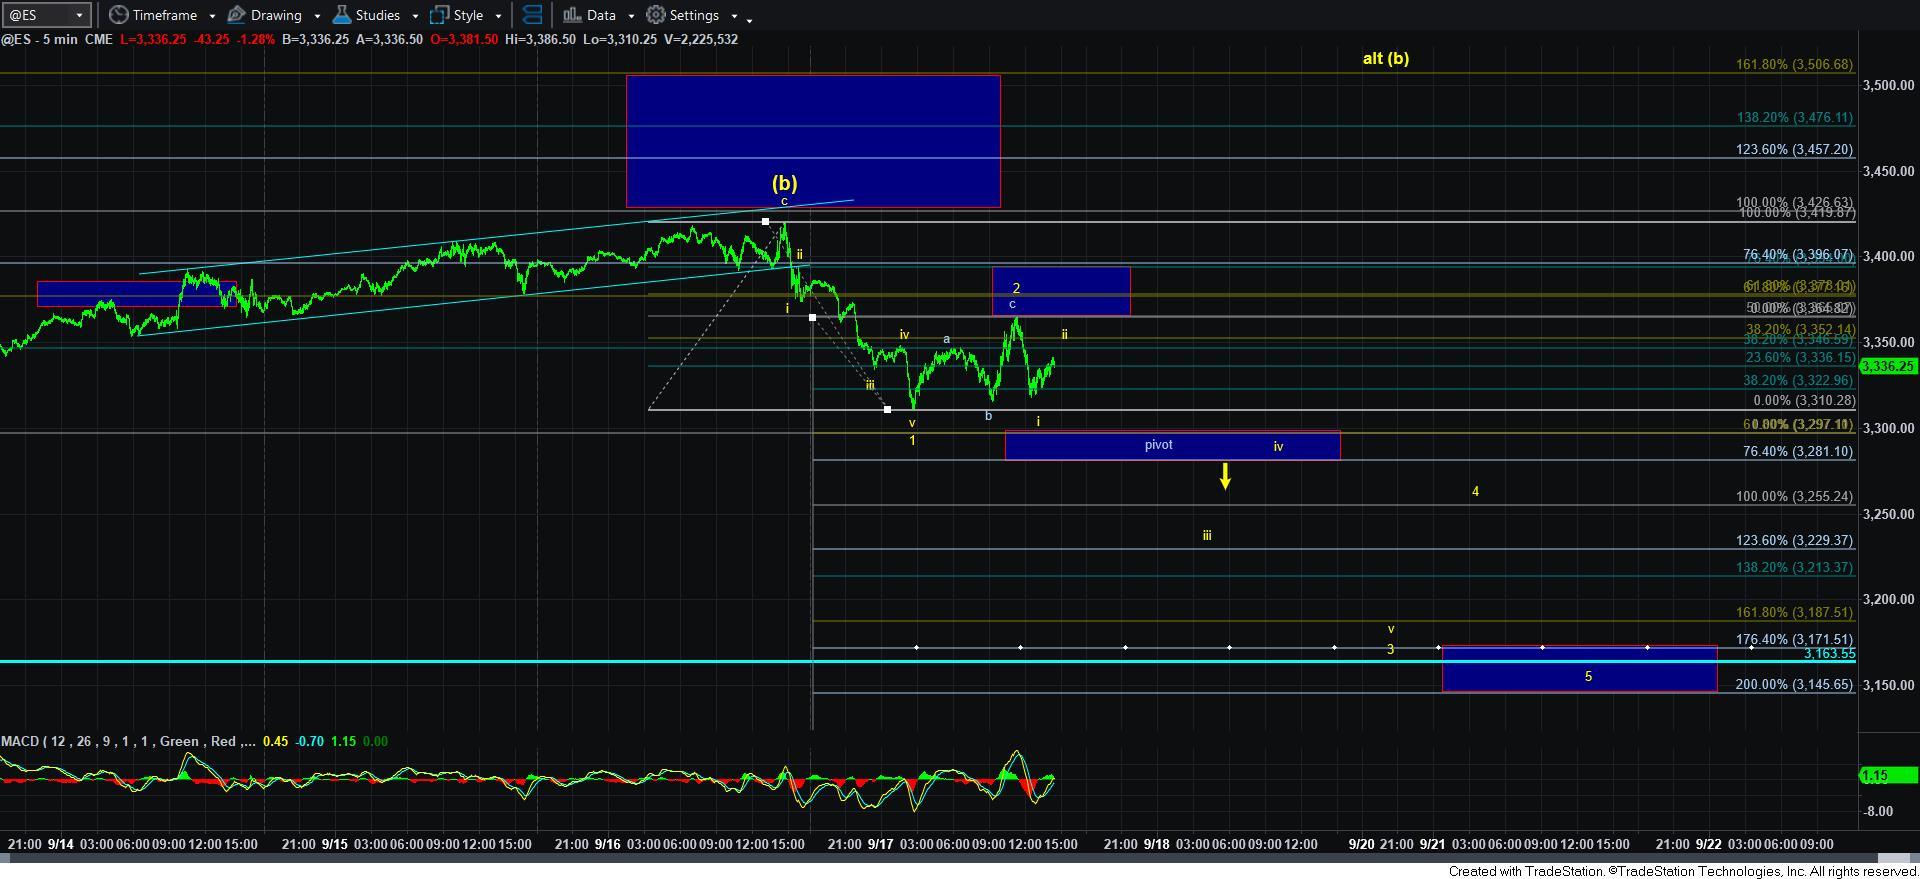
We have been looking for a set up to points us to a test of the 3200 region for about a week now, and the ES has just about given us that set up, at least from a Fibonacci Pinball perspective.
While the market topped out a bit short of the ideal target for the [b] wave, we do have what is reasonably considered to be a 5 wave decline overnight into the larger degree pivot we have had on our ES chart. Moreover, since we bottomed in that 5-wave decline, we have a clear a-b-c rally right up to the .500 retrace of the drop off yesterday’s high. For now, that is labeled as a 1-2 in yellow.
Since the high struck for the potential wave 2 in yellow, we have an “arguable” 5 wave decline. Normally, a wave i of 3 targets the .382-.618 extensions of waves 1 and 2. In our case, we went just beyond the .382 extension, and turned back up in a corrective looking manner.
Normally, I would say that a wave 1-2, i-ii set up has a 70% probability of following through. Therefore, for as long as we remain below today’s wave 2 high, we have a rather decent 1-2, i-ii downside set up presenting in the ES chart.
Now, it is time for the bad news.
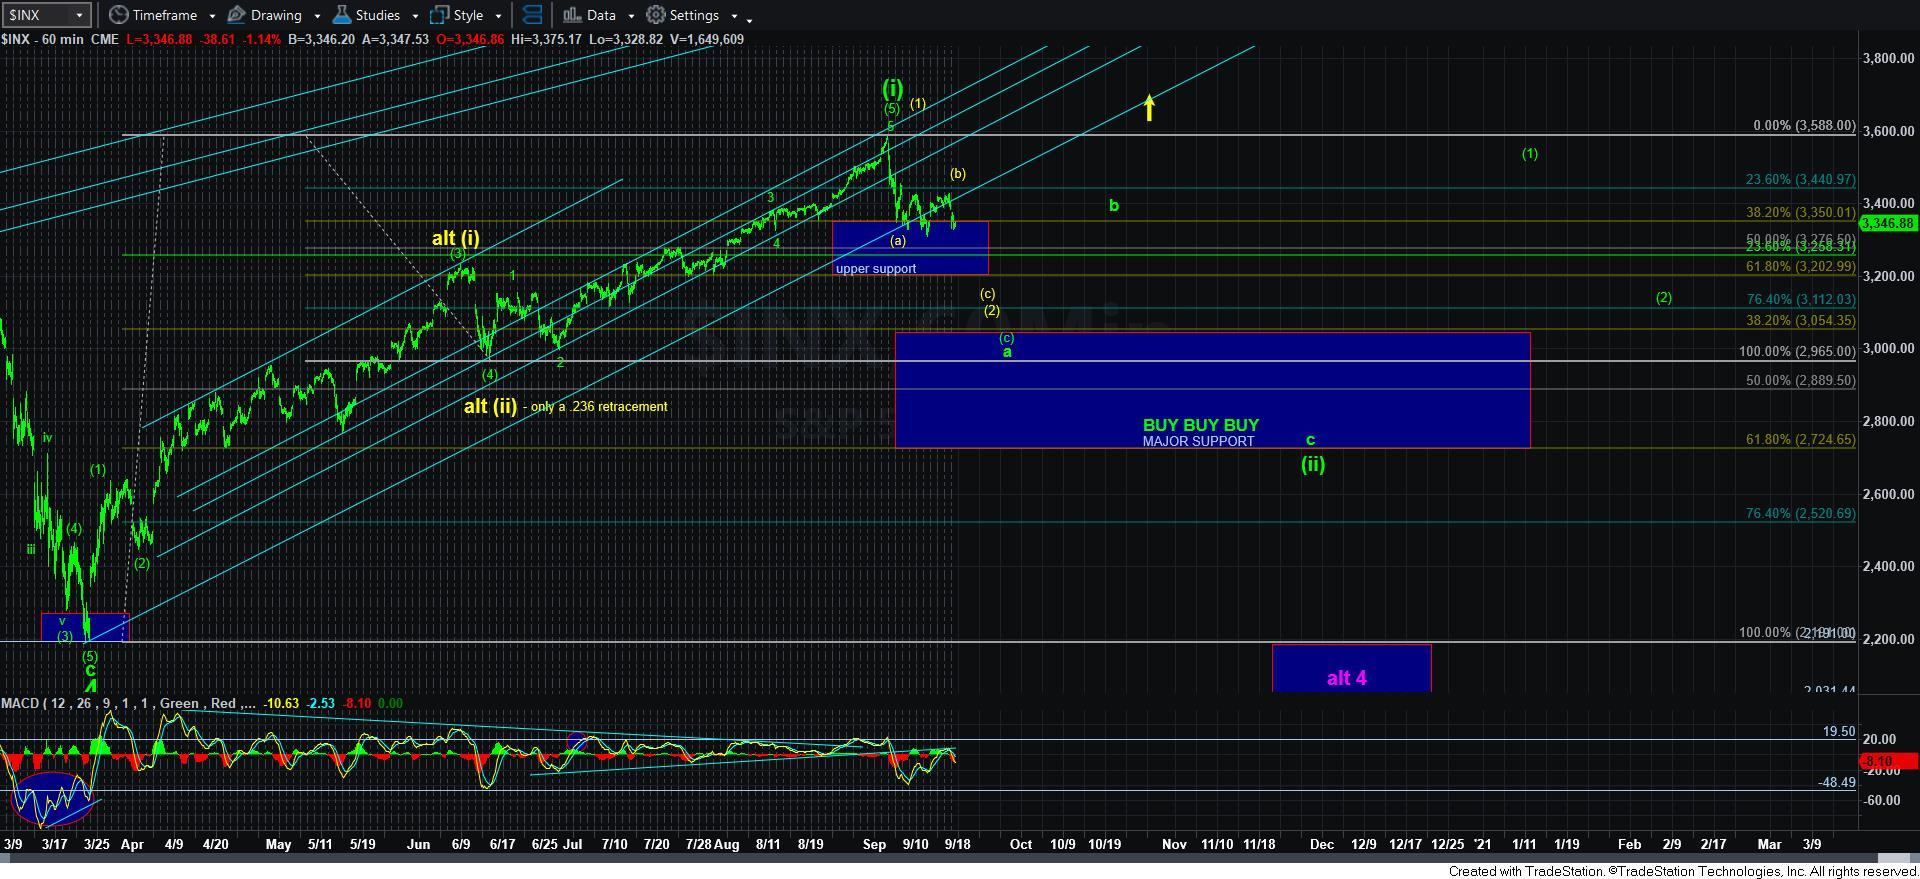
Despite the set up in the ES, the SPX and other charts really do not match this potential set up. So, while it may be in place in the ES, I do have some questions about the immediate break down structure.
The other issue I have with the set up in the ES is that I am not sure I can clearly count a 5-wave decline for wave i of 3. So, that also leaves some questions in my mind.
Therefore, I have to note that there is still a more than minimal probability that the market can trace out a bigger wave 2 retrace back to the 3400ES region, or even see a bigger [b] wave take shape in the coming days . . . that is, for as long as we remain over today’s low.
Should we break below today’s low, then I think we have a much more strong probability for the imminent wave 3 decline I want to see to complete this [c] wave I am expecting to the downside.
I have added a path for the potential [c] wave on the ES chart. Take note of the micro pivot on the chart, for should we break below that pivot, it then becomes resistance for a wave iv bounce within the 5-wave decline structure I would expect in the [c] wave down if we see immediate downside follow through on the ES set up.
So, now I have outlined the good and the bad for you so that you can understand the risks inherent within the corrective region and structure within which we now find ourselves. I would imagine that if the market choses the immediate downside structure, we can see a sizeable gap down overnight, and take us to completion of this [c] wave within the next week.
Alternatively, a sustained break out 3350ES would place this immediate set up in question.